Introduction
The notions of topology have been invoked for more than a century in the physical world in fields as diverse as condensed-matter physics, high-energy physics, and cosmology to describe the properties of matter and the universe, respectively, thus spanning the nano- and mesoscales (100 nm–1000 nm) to macroscopic (≥ a few microns) length scales. Reference Nakahara1–Reference Francis3 However, topology has not yet taken proper root in materials science with the question: “Do topology and geometry affect materials physical properties at the nano-/mesoscale, and, if so, how can we use them to understand and design materials from this new perspective?” One of the principal goals of this article is to address this and related questions, and materials scientists are now well poised to tap into the richness of this field due to recent advancements in measurements. Thus the goal is to identify and utilize advanced metrological techniques to probe topology and to relate the latter to the functional properties for a broad class of novel functional materials similar to what has been achieved in condensed matter physics. Reference Nakahara1 In other words, we look for analogues of identifying “edge states” in quantum Hall materials and topological insulators, Reference Hasan and Kane4 which allows us to measure and evaluate transport properties, including surface conductivity, the Hall coefficient, and related parameters.
The topology of a material goes beyond its physical shape and geometry in that it directly affects physical properties such as electronic conduction, charge and spin transport, light transmission, and response to a magnetic field. The nontrivial aspects of topology and geometry have numerous applications in modern condensed matter physics where they play an important role in various physically and technologically interesting systems. Reference Nakahara1,Reference Hasan and Kane4 This incipient appreciation for the importance of topology is beginning to allow researchers to engineer entirely new materials with unusual topologies that lead to either exotic or enhanced properties. Reference Massiot, Messinger, Cadars, Deschamps, Montouillout, Pellerin, Veron, Allix, Florian and Fayon5–Reference Evans, Hutchinson, Fleck, Ashby and Wadley7 Nevertheless, for most materials scientists, structural chemists, and biologists, topological methods remain obscure and unusually distant as compared to existing traditional methods.
We first introduce the essentials of topological concepts (for example, handlebars or genus of a structure) by means of illustrations without invoking explicit mathematics. We then distinguish between local and global topological aspects of materials and mostly focus on nanocarbons, soft matter, and biomaterials to describe their topology, a variety of topological defects (e.g., vortices, skyrmions), Reference Nakahara1,Reference Muhlbauer, Binz, Jonietz, Pfleiderer, Rosch, Neubauer, Georgii and Boni8 and their role in controlling physical properties. To this end, we introduce many topology characterization techniques that underscore the emerging field of topological metrology. The novel and important aspects of this nascent field encompass both qualitative and quantitative trends examined experimentally through measurable quantities such as a change in Raman spectroscopy (RS) bands (e.g., G, D, and 2D) of advanced nanoscale carbons, Reference Gupta and Saxena9,Reference Gupta and Saxena10 indicative of mechanical loading or deformation, as a function of genus and other topological attributes.
These concepts are also applicable to topological networks Reference Yook, Oltvai and Barabasi11,Reference Yang, Coombs and Ozin12 or nets, periodic structures (e.g., metal–organic frameworks, Reference Zhao, Timmons, Yuan and Zhou13 supramolecular architectures Reference Turro, Garcia-Garibay and Ramamurthy14 ), and geometrical hierarchies found in many soft- and biomaterials. Reference Hyde and Schröder-Turk15 Topological computer algorithms and databases (e.g., TOPOS 16 and EPINET 17 ), developed over the past decade and a half in conjunction with advanced visualization techniques, are greatly assisting the design of extended crystalline architectures and frameworks. Beyond the periodic and network structures, we will also discuss the emerging class of topological materials, Reference Yan and Zhang18 such as topological insulators Reference Hasan and Kane4 and Dirac materials, Reference Cayssol19 with an emphasis on the underlying quantum phenomena. Finally, having demonstrated the importance of topology, we hope to establish the topology/geometry → property → functionality paradigm in materials science.
What is topology?
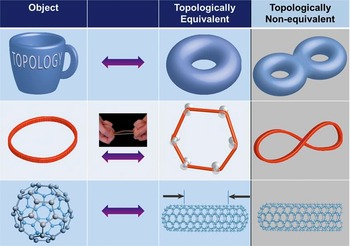
Topology is a field that studies invariance of certain properties under continuous deformation, such as stretching, bending, or twisting, of the underlying geometry. By continuous deformation we mean that nearby points on the object (e.g., a curve or a surface) remain neighbors, and no cutting or gluing is allowed. The continuous change can be continuously reverted, thus retrieving the original shape. We illustrate these apparently abstract concepts through specific examples in Figure 1 using a pedagogical approach, as explained later.
Illustration of topological equivalence between a coffee mug and a donut (top row), between a circle and a hexagon (middle row) (through a stretched rubber band), and between a sphere and a cylinder (bottom row) closed on both sides. The topological inequivalence is delineated in the right column, as a double donut cannot be created by continuously deforming a donut (without cutting or gluing). Similarly, a figure eight cannot be distorted into a circular rubber band without ungluing the intersection point. A one-side open cylinder is topologically different from a closed cylinder because one side has been cut (or unglued).

If we take a rubber band, which is almost a circle, we can continuously deform it to look like a hexagon or other shape. It is topologically equivalent because it is connected by a continuous deformation, stretching in this case. We can undo the deformation (i.e., retrieve the circular rubber band from the hexagon by un-stretching it or removing the push pins, Figure 1). (Note also that circles of different radii are all topologically equivalent, by radially stretching them.) Now, assume that the circular object is electrically conducting, such as a metallic ring with a current flowing in it. When it is deformed to the hexagonal shape, the current remains the same. Thus, the current in this case becomes the invariant property that only depends upon the topology but not on the underlying geometry (i.e., insensitive to the shape).
As noted previously, continuous deformation means nearby points remain neighbors, which is true for the circle-to-hexagon deformation and any other polygon (e.g., square or octagon) we could create through stretching the circle. Now consider that the circular rubber band is deformed in a figure-eight shape in which the crossing point is glued. If we unglue this point by stretching, it will become two points, which upon further stretching, will end up as two diametrically opposite points on a circle (i.e., the nearby points do not remain neighbors). Therefore, a circle and a figure eight are topologically inequivalent: a circle has one hole, while a figure eight has two holes, which means they have different topological characteristics, denoted by genus (g), where g = 1 for the circle and g = 2 for the figure eight.
As a two-dimensional (2D) surface example, if we take a coffee mug (made from a deformable soft material, see Figure 1), we can continuously reshape the mug into a donut. The mug handle becomes the hole in the donut. Conversely, we can start with the donut and reshape it into a mug. Thus, a mug and a donut are topologically equivalent since they both have a hole (g = 1). A donut, however, is topologically inequivalent to a double donut (g = 2) or a simple pretzel because a donut cannot be continuously deformed (without cutting or gluing) into a double donut. Interestingly, a donut is also topologically inequivalent to a cookie, for instance (i.e., no holes, g = 0).
Turning our attention now to real-world materials, if we look at the surface of a fullerene (third row, left column of Figure 1), it is the surface of a sphere. Assuming the spherical surface is elastic, if we stretch it laterally, it would appear as a capped nanotube on both sides (i.e., a closed cylinder). Thus, a sphere and a closed cylinder are topologically equivalent, both with no holes (g = 0). However, the sphere or the closed cylinder is topologically not equivalent to a one-side open cylinder (third row, right column) because we cannot obtain the one-side open cylinder from a sphere or a closed cylinder without cutting it somewhere. In fact, the one-side open cylinder is topologically equivalent to a finite flat disk (or a cookie), as it can be continuously stretched and opened to look like a disk. The open boundary is captured by another topological characteristic, namely the Euler characteristic, χ, besides genus g.
Connecting topology to geometry
Global topology of materials denotes distortion of invariant properties of spaces and objects rather than their topographic (or geometric) description.
Reference Nakahara1,Reference Munkres2
It is characterized by a parameter called genus g (i.e., the “handles” of an arrangement), which is an integer, as mentioned earlier. It is a topological invariant in that it is a conserved quantity under smooth continuous mechanical deformation, and it does not depend on the static or dynamic equations describing the material geometry.
Reference Nakahara1–Reference Francis3
In other words, if two orientable closed surfaces have the same genus, then they are topologically equivalent. Orientable means that a normal vector is uniquely defined at all points on the surface; the Möbius strip, discussed later, is a notable exception and is a non-orientable surface.
Reference Nakahara1–Reference Francis3
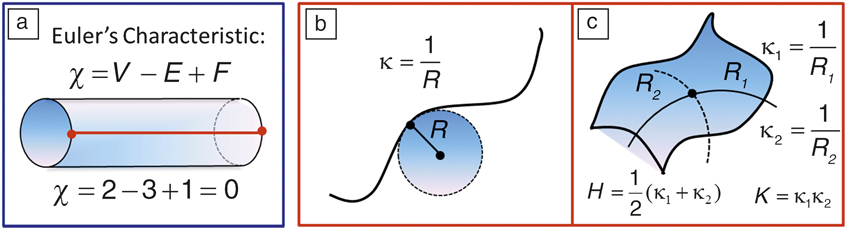
The genus is related to the Euler characteristic (χ) of a surface, defined by
 ${\rm{\chi }} = 2(1 - g)$
. However, when there are edges (or boundaries), it can be geometrically expressed as
 ${\rm{\chi }} = V - E + F$
, where V, F, and E represent the number of vertices, faces, and edges of a polyhedron “triangulating” the surface, respectively (see
Figure 2
a). The geometry and global topology are intimately connected by the celebrated Gauss–Bonnet theorem:
Reference Nakahara1,Reference Munkres2
 $$\int\limits_S {KdS = } 2{\rm{\pi \chi }},$$
where K is the local Gaussian curvature of the closed surface (S) defined later. If we integrate over K on the surface of a given geometry, it equals 2π times the Euler characteristic of that object. Note that K will vary as we deform the surface, or change the geometry, but χ will be unaffected. Regardless of how you may choose to deform the surface (without cutting or gluing), it is uniquely characterized by its topology (χ). Similar to K, χ can be negative. However, the mean curvature H (defined below and see Figures 2b and 2c) and g are strictly non-negative.
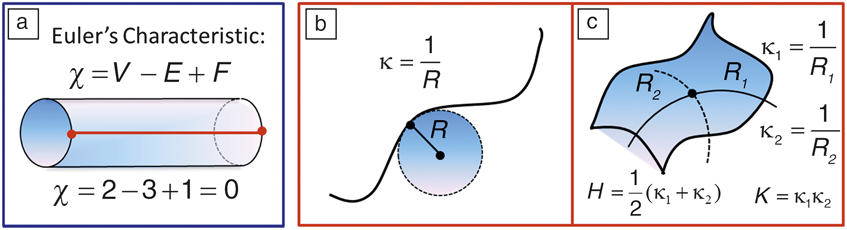
(a) Euler characteristic (χ) for surfaces with open boundaries. The red line ending on the circular boundaries creates two vertices (V = 2). (b) Principal curvature of a curve (κ) at a given point is the inverse of the radius (R) of the tangent circle. (c) A surface has two principal curvatures (κ1, κ2) defined by the radius of two orthogonal tangent circles (R 1, R 2) at a given point, defining geometric mean (H) and Gaussian (K) curvatures. Note: E, number of edges; F, number of faces; κ1, principal curvature for tangent circle 1; κ2, principal curvature for tangent circle 2.
To illustrate these concepts, we note that the spherical fullerene (C60) has χ = 2 since g = 0 (no holes or handles). All hyperfullerenes (C70,84,90,…) and hypofullerenes (C36,50,…) are topologically equivalent to a sphere (i.e., g = 0, χ = 2). For a simple torus (e.g., a carbon nanoring), χ = 0 since g = 1 (see
Table I
). Similarly, for a double torus (or a double nanoring), χ = –2 since g = 2. A cylindrical single-walled carbon nanotube (SWCNT) open at both ends is a surface with genus one (g = 1) with open boundaries, which implies χ = 0. To understand this, we can draw an edge from one end to the other on the surface of the cylinder (Figure 2a). This would give F = 1, E = 3, as there are two edges at the ends of the cylinder and V = 2; therefore,
 ${\rm{\chi }} = V - E + F$
= 0. A carbon nanocone is topologically equivalent to a disk, and thus to a graphene sheet (g = 0, χ = 2).
Topology of nanocarbon allotropes.
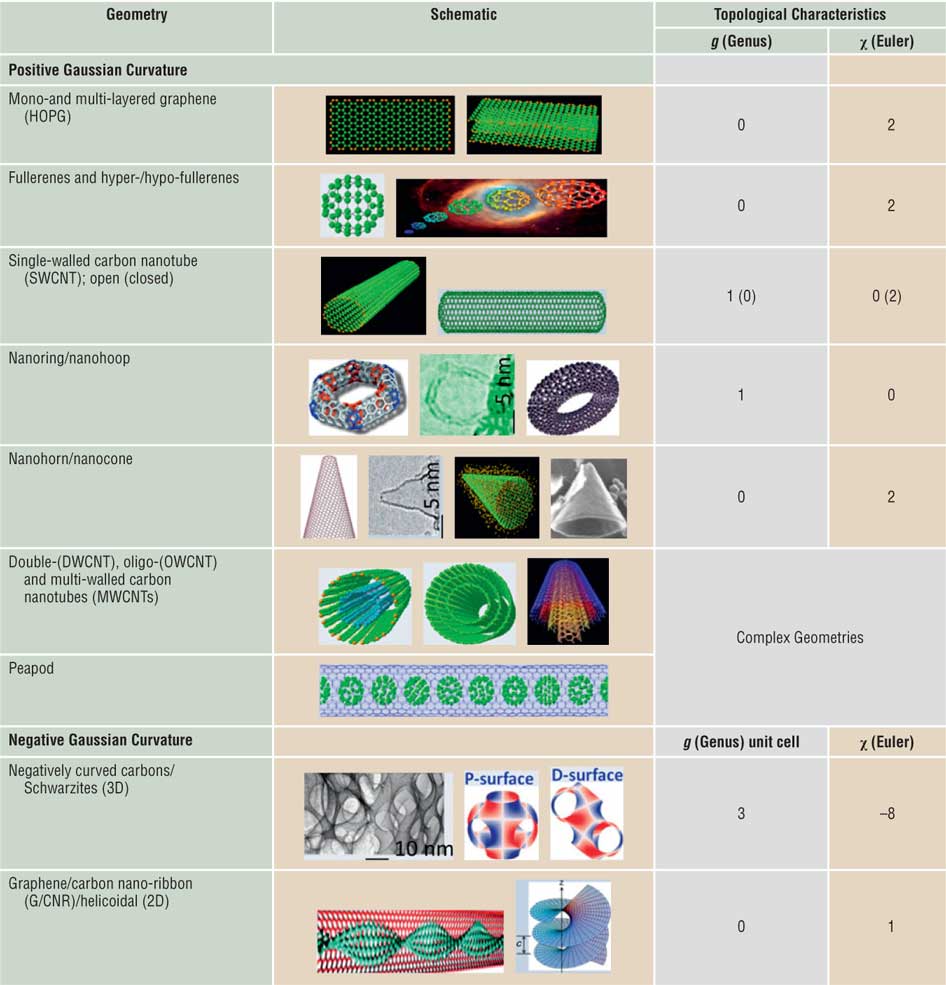
Topological characteristics of distinct nanostructured curved carbons with different genus (g) and Euler characteristic (χ). Note that both positive and negative curvature geometries are depicted. Note: HOPG, highly oriented pyrolytic graphite; P-surface, primitive Schwarz surface; D-surface, diamond Schwarz surface; c, helicoid pitch.
Topology is essentially elastic (or soft) geometry. Geometry is characterized by fixed distances and angles, or more generally on a surface with mean (H) and Gaussian (K) curvatures.
Reference Nakahara1,Reference Gupta and Saxena10,Reference Gupta and Saxena20
Intuitively, curvature is the amount by which a geometric object (or material) deviates from being flat, or straight in the case of a line. At a given point on a curve, there is one circle of radius R that is tangent to the curve at that point (Figure 2b). The corresponding principal curvature (κ) at that point is simply the reciprocal of the radius (i.e.,
 ${\rm{\kappa }} = 1/R$
). Analogously, there are two principal curvatures
 $({{\rm{\kappa }}_1},{{\rm{\kappa }}_2})$
at a given point on a surface that measure how the surface bends by different amounts in different directions with respect to that point (Figure 2c). The mean curvature is thus defined by
 $H = ({{\rm{\kappa }}_1} + {{\rm{\kappa }}_2})/2$
and the Gaussian curvature by the product
 $K = {{\rm{\kappa }}_1}.{{\rm{\kappa }}_2}$
. Note that under the resulting condition,
 $K \le {H^2}$
, a positive K implies that the surface is locally either a peak or a valley, indicating that the surface bends equally on both sides, which is the case for spherical or ellipsoidal geometry. Similarly, hyperbolic geometry has a negative K,
Reference Nakahara1,Reference Gupta and Saxena10,Reference Gupta and Saxena20
which means that the two principal curvatures have different signs (e.g., a hyperboloid [a hyperbola rotated around its axis]), or the surface locally has saddle points. K = 0 implies that the surface is flat in at least one direction (e.g., a plane, cylinder, or cone). Surfaces with H = 0 are called minimal surfaces; some examples include a plane (trivial), a helicoid, a catenoid, and periodic negatively curved carbon (Schwarzite).
Reference Gupta and Saxena20
Next, we demonstrate and discuss nanocarbon allotropes as a prominent example of topological variation in greater detail.
Topological taxonomy of nanocarbons
Nanocarbons exist in numerous geometries and topologies that range from planar or monolayer and multilayer graphene (the youngest member in the family of synthetic nanocarbons), Reference Novoselov, Geim, Morozov, Jiang, Zhang, Dubonos, Grigorieva and Firsov21 nanotubes (single-, double-, oligo-, and multi-walled), fullerenes and their analogues (hypo- and hyperfullerenes, the oldest member in the synthetic nanocarbons, which marked a pivotal moment in the field of nanotechnology), Reference Kroto, Heath, O’Brien, Curl and Smalley22,Reference Hirsch and Brettreich23 to nanorings, nanocones, nanohorns, and peapods, which we collectively refer to as topologically distinct geometric allotropes of carbon. Reference Gupta and Saxena9 These synthetic nanoscale carbon allotropes represent a growing family of fascinating and aesthetically pleasing architectures with outstanding material properties. In addition, while carbon remains the element of choice for applications, its allotropes offer multifunctional behavior and provide a fertile playing field for expounding the nontrivial notions of global topology and unusual geometric attributes (see Table I). Reference Gupta and Saxena10,Reference Gupta and Saxena20 These concepts are applicable beyond the nanoscale, to the mesoscale, and all the way to the very shape and structure of the macroscale universe. Some of the fullerenes and related nanoscale carbons are known to have formed extraterrestrially in interstellar space, meteorites, lunar rocks, and terrestrial sediments. Reference Kroto, Heath, O’Brien, Curl and Smalley22
Multiwall carbon nanotubes and fullerenes (“nano-onions”) possess complex topologies, as do peapods. The latter comprise SWCNTs filled with C60 fullerenes. Similarly, X-, Y-, and T-junction shaped nanotubes also have complex topologies. Reference Gupta and Saxena9 Assuming closed boundaries, Y- and T-junctions have g = 2, χ = –2, whereas the X-junction has g = 3, χ = –4. Among the negative Gaussian curvature (K < 0) periodic carbon allotropes, Schwarzite has a complex topology with g = 3, χ = –8 per unit cell (Table I). Reference Gupta and Saxena20 Similarly, a helicoid-shaped graphene nanoribbon would have g = 0, χ = 1. Reference Gupta and Saxena20
We summarize the global topology of nanocarbons in Table I in terms of g and χ. Note that the nanocones, nanodisks, and nanotubes closed at one end are topologically equivalent to the flat graphene sheet (g = 0). Similarly, fullerenes (C60), hyperfullerenes (C70,84,90,…), hypofullerenes (C36,50,…), and capped nanotubes have the topology of a sphere (g = 0). As noted, due to the boundaries captured by χ, open nanotubes have a different topology (g = 1, χ = 0) than those of closed ones (g = 0, χ = 2). Carbon nanotori and nanorings are topologically equivalent to a torus (g = 1, χ = 0).
Stable π-conjugated aromatic Möbius annulenes and Möbius strips of single crystals of certain charge-density wave trichalcogenides have been recently synthesized. Reference Tanda, Tsuneta, Okajima, Inagaki, Yamaya and Hatakenaka24 The unusual spin and electronic properties of graphene Möbius strips have also been explored. Reference Yamashiro, Shimoi, Harigaya and Wakabayashi25 The Möbius strip is a structure with an indistinguishable inner and outer surface—a non-orientable surface Reference Nakahara1–Reference Francis3 with Euler characteristic χ = 2 – k = 0, where k = 2 is its non-orientable genus (different from the usual or orientable genus). Multiple twists of the graphene nanoribbons result in topologically distinct strips as observed in transmission electron microscopy (TEM) images. Reference Cai, Ruffieux, Jaafar, Bieri, Braun, Blankenburg, Matthias, Seitsonen, Moussa, Feng, Muellen and Fasel26 A typical twisted graphene nanoribbon has g = 0 and χ = 2. These concepts are applicable to a much broader class of materials discussed next.
Topology of soft/biomaterials and complex networks
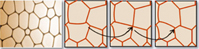
Analogous to carbon nanomaterials, other hard-, soft-, and biomaterials come in a variety of topological forms. Some examples include titania (TiO2) and silica (SiO2) nanotubes, Reference Sinnott and Andrews27 boron-nitride nanotubes and nanotori, Reference Rubio, Corkill and Cohen28 helical gold nanotubes, Reference Oshima, Onga and Takayanagi29 Möbius conjugated organic materials, Reference Tanda, Tsuneta, Okajima, Inagaki, Yamaya and Hatakenaka24,Reference Ajami, Oeckler, Simon and Herges30 mesoporous silica networks, Reference Yang, Coombs and Ozin12 di- and tri-block copolymers, Reference Hadjichristidis, Pispas and Floudas31 micelles, colloids, micro-emulsions, biological vesicles, Reference Michalet and Bensimon32,Reference Lipowsky33 microtubules, folded proteins, knotted DNA, supramolecular structures, and photochemistry in restricted space. Reference Turro, Garcia-Garibay and Ramamurthy14 The topology of mixed di- or triblock copolymers, Reference Hadjichristidis, Pispas and Floudas31 as well as single and double gyroid structures Reference Hyde and Schröder-Turk15 (in butterfly wings and bioinspired photonic bandgap materials), zeolites, and other metallo–organic frameworks Reference Zhao, Timmons, Yuan and Zhou13 (MOFs) belongs to periodic minimal surfaces. Reference Gupta and Saxena20,Reference Saranathan, Osuji, Mochrie, Noh, Narayanan, Sandy, Dufresne and Prum34–Reference King36 Also, foams, Reference Hutzler and Weaire37 for instance, possess an interesting network topology, and they change configurations at the local level via a T1 switch (see Table II ), in which the interface between two bubbles shrinks to zero length and then expands to a finite length in another direction, thus causing a local topology change. Reference Bohn38 In addition, many biological processes, including DNA and RNA structure and protein folding, involve network, braid, and knot topologies. Reference Skjeltorp39
Topology of soap bubbles and foam, liquid crystals, di- and triblock copolymers, biomembranes, vesicles, zeolites, metallo–organic frameworks, and supramolecular assemblies.
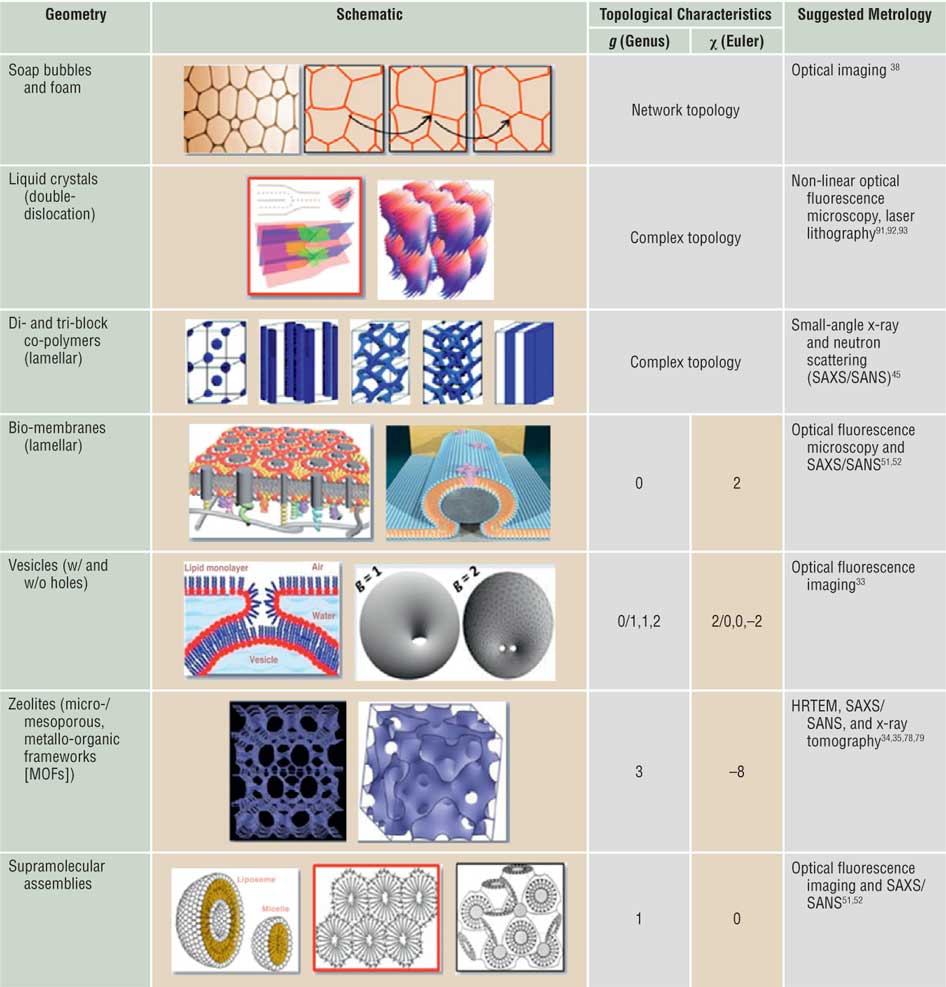
The foam network rearranges itself through T1 switching events shown by black arrows, which are local topological changes as depicted in the side panel (first row). The MOFs (sixth row) are a periodic minimal surface with negative Gaussian curvature and g = 3, χ = –8 per unit cell. Corresponding suggested metrologies for probing topology/geometry are also listed. Note: SAXS, small-angle x-ray scattering; SANS, small-angle neutron scattering.
A network has connected nodes and lines in various ways. Reference Yook, Oltvai and Barabasi11,Reference Yang, Coombs and Ozin12 Lattices are a special kind of network in which the lengths are the same in each periodically repeated unit, called a unit cell. Two networks may have different distances between nodes and other characteristics and yet may have identical topologies (i.e., they can be continuously deformed into each other). As a special case, a square lattice is topologically equivalent to an oblique lattice but not to a triangular lattice. Protein interaction networks, Reference Yook, Oltvai and Barabasi11 biochemical metabolic networks, Reference Christensen and Nielsen40 polymer networks, Reference Sperling41 and mesoporous materials Reference Yang, Coombs and Ozin12 are examples in which correlations between the network structure (or topology) and functional properties provide useful insights into design strategies. Similarly, for studying 2D and 3D microstructure evolution in the context of crystal grain growth Reference Lazar, Mason, MacPherson and Srolovitz42 and topological optimization of materials microstructure Reference Huang, Radman and Xie43 (as well as of multicellular structures such as foams, bubbles, and biological tissues), network topology provides an efficient tool. Reference Hobbs, Jesurum, Pulim and Berger44 Specifically, grain growth strongly favors particular grain topologies. Reference Lazar, Mason, MacPherson and Srolovitz42
In soft- and bio-matter such as di- and tri-block copolymers Reference Hadjichristidis, Pispas and Floudas31 and photonic crystals (in butterfly wings as well as in weevil chitin Reference Hyde and Schröder-Turk15 ), depending on the relative concentration of the two constituents and temperature, the topology can change from a lamellar structure to a tubular structure or to a gyroid structure. Reference Hyde and Schröder-Turk15,Reference Hadjichristidis, Pispas and Floudas31,Reference Ishøy and Mortensen45 These can be classified as a phase change characterized by a change in topology. Some materials are unable to reach their minimum energy state due to topological reasons resulting in topological frustration. Reference Hills, Kathuria, Wallace, Day, Brooks and Matthews46 This is very common during protein folding, but graphene nanoflakes can also exhibit this phenomenon Reference Wang, Yazyev, Meng and Kaxiras47 where magnetic order can develop as a consequence.
Table II also shows examples of complex topology in liquid crystals and block co-polymers. The second row shows multiple dislocations in a liquid crystal
Reference Lavrentovich, Arodz, Dziarmaga and Zurek48
(left panel) and a stacking of cylindrical structures in a hexagonal lattice, with each cylinder possessing a complex topology (i.e., a bundle of helicoidal layers).
Reference Matsumoto, Alexander and Kamien49
The self-assembly of di- and tri-block polymers results in a variety of complex topologies (third row) as a function of the relative concentration of different types of polymer blocks and the interaction energy between different types of monomers
Reference Hadjichristidis, Pispas and Floudas31
(i.e., the Flory-Huggins parameter). Some depicted examples include lamellar, cylindrical, globular, gyroid, and double gyroid structure. Interestingly, the gyroid is a triply periodic minimal surface (mean curvature H = 0) that belongs to the family of P and D (primitive and diamond) Schwarz surfaces
Reference Saranathan, Osuji, Mochrie, Noh, Narayanan, Sandy, Dufresne and Prum34–Reference King36
and separates space into two identical labyrinths of passages. This peculiar structure was discovered in 1970 by Alan Schoen (then a scientist at NASA).
Reference Schoen50
It also corresponds to the last space group (number 230, Ia
 $\bar 3$
d).
Biomembranes can be flat (lamellar) or curved depending on the structures they enclose (fourth row), Reference Sezgin, Kaiser, Baumgart, Schwille, Simons and Levental51 and they can also morph into a spherical or toroidal topology, in some cases with g > 1 (fifth row). As indicated previously, MOFs Reference Zhao, Timmons, Yuan and Zhou13 also form periodic minimal surfaces and gyroid-like structures (sixth row). Finally, supramolecular assemblies may emerge with a variety of topologies, including spheroidal, periodic with g =1, or even a gyroid-like structure. Reference Katsaras and Gutberlet52 It is highly desirable to probe and quantify the topological attributes of the examples portrayed in Tables I and II.
Probing topology of nanocarbons and metrology
Probing topological effects on physical properties of materials in a significant way and identifying topological metrics through analytical techniques that relate to one (or more) experimental physical quantities are some of the pressing questions for materials scientists. As a first step in this direction, we recently attempted to describe the differences between various nanoscale carbons and provided a semi-quantitative topology assessment via monitoring characteristic lattice phonon modes, measured using resonance RS in the first- and second-order, thereby capturing the electronic spectra and elucidating a viable approach. Reference Gupta and Saxena9,Reference Gupta and Saxena10 While the latter can also be obtained using traditional UV-visible optical spectroscopy, high-resolution transmission electron microscopy provided the much needed nanoscopic microstructures of various carbons. Understanding these geometric allotropes of nanocarbons, particularly in terms of their topological characteristics, becomes indispensable because it goes well beyond the traditional paradigm of microscopic structure → property → function correlation to the global topology/geometry → property → function relationship. From this perspective, we can elucidate the notion of global topology and curvature for a range of technologically important nanoscale carbons, including tubular (SWCNTs), spherical (hyperfullerenes), toroidal (nanorings), and conical/complex (nanocones, nanohorns) geometries.
Various forms of carbon at all spatial lengths undoubtedly play a pivotal role for topology due to their structural diversity and geometries from a curvature and topology perspective, thus uniquely positioning carbon as a fertile playing field for global topology versus geometry and curvature attributes. Based on extensive studies on graphite, an infinite multilayered graphene structure with primarily sp2-bonded carbon (sp Reference Munkres2 C) hybridization, it becomes apparent that graphene is the 2D building block for carbon allotropes of every other dimensionality.
Raman spectroscopy technique
RS has emerged inarguably and historically as one of the potential analytical tools and an integral aspect of structural characterization of graphite and related carbon materials at the nanoscale, revealing not only the collective atomic/molecular motions but also localized lattice vibrations. Reference Pimenta, Dresselhaus, Dresselhaus, Cancádo, Jorio and Saito53,Reference Dresselhaus and Eklund54 Some of the primary reasons for this advantage are the strong Raman response to the π-states in sp2 C systems due to resonance enhancement (resonance Raman spectroscopy [RRS]); its simplicity for high-symmetry nanotubes and fullerene species, facile access, and noninvasive nature; and its ability to provide invaluable information on elementary excitations (phonons, defects, stacking order/disorder) in graphite as well as the number and orientation of graphene layers, the quality and type of edges in graphene, effects of perturbations (electric and magnetic fields, strain, doping, disorder, and functional groups), and finite size of the crystallites parallel and perpendicular to the hexagonal axis of the probed material. These advantages result from the sensitivity of RS to the changes that occur in the atomic structure arising from multiple causes.
Our motivation here is at least twofold: (1) to amplify on the structures observed in high-resolution electron microscopy and RRS studies of various nanoscale carbons with arbitrarily low genus by monitoring and identifying the effects in vibrational modes (usually ignored) arising due to curvature, and (2) to provide Raman spectra for otherwise unexplored nanoscale carbons to identify a truly topological metric. Reference Gupta and Saxena9,Reference Gupta and Saxena10 In doing so, we aim to gain a deeper insight and develop a unified understanding from the global topological and curvature perspectives by monitoring the shift in wavenumbers of prominent Raman bands of diverse curved nanocarbons as a topological indicator/metric. In addition, it is anticipated that these shifts in wavenumbers are translated into changes in local curvature resulting from local topological defects, namely either the pentagon-heptagon (P-H) or Stone-Wales (S-W) pair defects and/or the mitosis defect, Reference Charlier55–Reference Duplock, Scheffler and Lindan60 as well as into boundary conditions that are applicable in theory while calculating optical absorption and vibrational spectra using tight-binding models that help map the electronic structure of these nanomaterials.
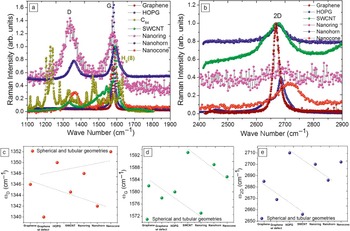
Resonance Raman spectra were measured using a commercial micro-Raman spectrometer equipped with a 2400-g/mm grating, ion-etched Super-Notch-Plus filter, an argon-ion laser operating at excitation wavelength λL = 514 nm (laser incident energy E L = 2.41 eV), and a power <10 mW to avoid local heating and thermal degradation (spectral resolution of ∼1 cm–1, and Spectra Max software for Windows to accumulate raw data). Raman spectra were recorded in the wave-number range of 1000–3000 cm–1 in backscattered configuration and analyzed. Reference Gupta and Saxena9 We measured resonance micro-Raman spectra of pristine monolayer graphene (and equivalently an infinitely multilayered graphene or highly oriented pyrolytic graphite, HOPG), a hyperfullerene (C84), an open-ended SWCNT, a single-walled nanoring (SWNR), a single-walled nanohorn (SWNH), and a nanocone both in the first- and second-order spectral regions ( Figure 3 a–b). Some of these carbon forms were produced in very small quantities using either the electron beam irradiation of SWCNT Reference Gupta and Patel61 or other processing techniques, such as thermal annealing of ultradispersed diamond. Reference Mochalin, Shenderova, Ho and Gogotsi62 Because all of these materials are sp2 C derivatives, it is instructive to compare their Raman spectral features with planar HOPG and monolayer graphene.
Experimental (a) first-order and (b) second-order resonance Raman spectra for monolayer graphene with or without defects, infinite multilayered graphene, or highly oriented pyrolytic graphite (HOPG), hyperfullerene C84, single-walled carbon nanotube (SWCNT), single-walled nanoring and nanohorn, and tip of the nanocone showing prominent bands of interest, namely D, G, and 2D, and Hg(8) for C84. The Raman intensity is normalized with respect to the higher intensity G band. (c–e) show variations in the Raman frequencies ωD, ωG, and ω2D for D, G, and 2D bands, respectively. Since the Raman bands assignment for C84 is different, the variation is not shown for C84 and is mentioned in the text wherever appropriate. The dotted lines in (c–e) are drawn to guide the eye.

Prominent bands of interest in the first-order Raman spectra for all of the nanocarbons are D and G bands occurring at ∼1340 cm–1 and ∼1580 cm–1, respectively. The higher wavenumber G band is associated with the tangential C-C stretch or the tangential displacement mode having an E2g symmetry. For plasma-enhanced chemical vapor deposited SWCNT, the G peak decomposes into two main peaks around 1562 cm–1 and 1593 cm–1 (G+ and G, respectively) with a shoulder at ∼1550 cm–1 (G–). These features have previously been assigned to the E2g symmetry mode of graphite that results from the splitting of an intralayer stretching mode. This splitting arises due to the curvature-induced re-hybridization of σ*-π* states. Reference Dresselhaus and Eklund54,Reference Blasé, Benedict, Shirley and Louie63 In fact, this re-hybridization strengthens the C–C bond, which yields relatively high elastic constants for the SWCNTs. It is worth mentioning that the excitation wavelength of 514.5 nm (or photon energy of E L = 2.41 eV) preferentially excites semiconducting SWCNTs (mean diameter of d t ∼ 1.3 nm) and is in resonance with the E22 SS branch of SWCNT 1D density of states. Qualitatively, the Raman modes of SWCNTs seem to be narrow and sharp, indicating high uniformity and a low level of impurities, thus of reasonably good crystalline quality. Reference Gupta and Patel61
Variation in prominent Raman bands
The D band in sp2 C materials is the disorder-activated band with A1g symmetry in the first-order scattering process arising from in-plane substitutional heteroatoms, vacancies, grain boundaries, or other defects and finite size effects, all of which lower the translational symmetry in a quasi-infinite lattice and violate momentum conservation. Therefore, association of the D band with symmetry-breaking phenomena results in a band intensity that is proportional to the phonon density of states, which is applicable to practically all of the sp2 C-based material systems. Note the onset of the D band in Figure 3, which is absent for defect-free HOPG and graphene. Reference Duplock, Scheffler and Lindan60,Reference Ferrari and Basko64
Stable sp2 C spherical cages are the most abundant fullerenes (C60) with somewhat lower yields of higher analogues such as C84. Figure 3a shows the effect of curvature and geometry on the experimentally observed specific Raman mode in the high wave-number regime for spheroids (D 2d –C84) compared with HOPG. They are synthesized and isolated following Reference 65. While there are only a few Raman lines for C60, the spectrum for C84 shows many more lines due to a deviation from the spherical geometry (usually oblate), large number of C atoms, hybridization, and also to a more reduced symmetry than that of the icosahedral symmetry I h for C60. While it is difficult to interpret the Raman spectrum for C84, a strong vibrational structure resembling a downshifted and split C60 spectrum is apparent for C84, where the center of gravity of the two Raman bands is shifted by a factor of ∼0.85 and 0.87 with respect to the Ag(2) (a well-known pentagonal pinch mode for C60 occurring at ∼1470 cm–1) and Hg(8) bands at ∼1575 cm–1, respectively. A correlation between the cage mass and the frequencies from fullerene modes of similar origin thus seems to be justified. Reference Yamamoto, Tansho, Tomiyama, Shinohara, Kawahara and Kobayashi66,Reference Takata, Nishibori, Umeda, Sakata, Yamamoto and Shinohara67
Figure 3a also shows the Raman spectra for a SWNR, a SWNH, and a nanocone. SWNHs were obtained from Sano’s and Yudasaka’s groups in Japan, both exhibiting similar phonon spectra. Reference Wang, Chhowalla, Sano, Jia and Amaratunga68,Reference Murata, Miyawaki, Yudasaka, Iijima and Kaneko69 They were grown by a DC electric arc discharge between two graphite electrodes submerged in liquid nitrogen. The internal structure of SWNH is described as a mixture of “dahlia-like” and “bud-like” structures as observed by TEM. SWNHs have a graphitic carbon structure similar to that of the usual carbon nanotubes except that they are twisted. One of the potential applications of SWNHs is in fuel cell electrodes because of their large surface area and easy gas and liquid permeation. Reference Yudasaka, Komatsu, Ichihashi, Achiba and Iijima70 On the other hand, SWNRs (g = 1) were formed by electron-beam irradiation. Reference Gupta and Patel61 The Raman spectra of SWNH and SWNR show typical nanocarbon disorder D (∼1350 cm–1) and G (∼1580 cm–1) peaks (Figure 3a). The SWNR Raman spectrum resembles that of SWCNT, but it differs somewhat, accounted for by the shift of the G band. Alternatively, the G band is upshifted, leading to graphene planes with compressive microscopic strain attributed to the graphene plane curvature. This curvature is invoked to explain the relaxation of the Raman selection rules and the appearance of new, albeit weak, Raman peaks at 1100 cm–1 and 1740 cm–1.
Nanocone tip Raman data were obtained from Gogotsi’s group and analyzed. Reference Tan, Dimovski and Gogotsi71 While the D peak shifts from its average position at ∼1340 cm–1, the G peak shifts from 1580 cm–1 for HOPG to ∼1585 cm–1 for a synthetic carbon nanocone. The upshift of the Raman band was attributed to the simultaneous presence of the curved cone surface and smaller crystallite size giving rise to phonon confinement in the nanocone. The presence of a D band in all phonon spectra indicates that the surfaces of cones and graphite with micron-sized crystallites or domains were not perfectly wrapped by graphene. A qualitative observation of the broadening of the G band results from the conical wrapping of layers and bonding of graphene sheets. From the subtracted Raman spectra for a cone and HOPG, it is clear that the Raman spectrum for nanocones is composed of at least two contributions: microcrystalline graphite subsurface carbon layers and multiwall or graphite whiskers close to the surface.
Raman bands of the representative materials mentioned previously were quantitatively analyzed in terms of the position of D and G bands as a possible topological metric due to their sensitivity toward structural modification, however, with weaker or “group” trends. Figure 3c–d summarizes the main effects, including those of graphene and HOPG. Generally speaking, the presence of the G band is a direct indication of the presence of a sp Reference Munkres2 C network, and the shift (either decrease or increase) in the highest wave number position is a measure of (a) different sp2 C configurations; (b) curvature-induced re-hybridization and probably a mixed hybridized character; (c) compressive or tensile stress/strain; and (d) possible phonon confinement (or vibrational localization). It seems that the tensile strain in graphene planes induces curvature by the introduction of pentagons in the hexagonal network governed by Euler’s theorem for fullerenes. Reference Gupta and Saxena9 While the Raman bands for the nanocone and nanohorn appear at almost similar positions, the nanoring lies in the category of a different geometry. (Ideally, the nanoring is a toroidal geometry with genus one.) A quantitative understanding of the Raman line shape and wavenumber shift due to the geometry and topology in these carbon nanostructures requires properly accounting for the changes in both phonon and electronic density of states and the concomitant modification of the electron–phonon interaction. Indeed, recent theoretical studies on nanotori, nanocones, and nanohorns have provided valuable insights in this direction, in direct concurrence with our limited findings. Reference Meunier, Lambin and Lucas72,Reference Charlier and Rignanese73
While the first-order Raman spectra features furnish information about the energies of elementary excitations in solids at the center of the Brillouin zone (BZ), the second-order Raman spectra provides information about the dispersion relations of phonons or high symmetry points of the BZ, which in some respects is the information that optical absorption spectroscopy yields on the electronic band structure. Moreover, in the Raman spectra from low-dimensional (1D and 0D) systems, higher-order or overtone modes are equally or sometimes more informative for phonon spectral representation than for 3D solids or bulk systems. This is related to the fact that in 3D solids, the inclusion of two or more phonon modes in a scattering process relaxes the wave vector selection rule and therefore gives a relatively broad structure to the Raman spectra. However, in low-dimensional materials, the (momentum) k-space integration is only in one direction, and the 2D band (sometimes it is also denoted as D* in the literature) is symmetry allowed by momentum conservation; therefore, the overtone Raman features remain relatively sharp and are an intrinsic feature. The 2D band in the Raman spectra of most of the sp Reference Munkres2 C materials is generally more intense than that of its first-order counterpart and has almost the same intensity as the G band. In general, almost all of the data are consistent with the frequency relation ω2D ≅ 2ωD, particularly for the nanotubes.
As for the physical origin of the disorder-induced D band, it was interpreted initially in terms of phonon density of states maxima, but this was revisited by Vidano et al., Reference Vidano, Fishbach, Willis and Loehr74 who showed that the D band is dispersive (i.e., the D band changes with incident laser energy, E L). The position of the D band upshifts with increasing E L in a linear way over a wide range, the slope (ΔωD/ΔE L) being about 50 cm–1/eV independent of almost any type of sp2 C bonding. Likewise, the 2D band also exhibits dispersive behavior, with the slope being twice that for the D band (i.e., 100 cm–1/eV). Baranov et al. Reference Baranov, Bekhterev, Bobovich and Petrov75 made the first successful attempt to explain the origin and the dispersive behavior in wave numbers of D and 2D bands, namely double resonance, and Thomsen and Reich Reference Thomsen and Reich76 further developed this. Figure 3b shows the second-order Raman spectra of all the representative nanocarbons discussed earlier. Each of the Raman spectrum intensity is normalized with that of the G band. Given the dispersion with laser energy, the “dispersive behavior,” albeit with curvature, in these nanoscale carbonaceous materials both in the D and 2D bands, is shown in Figure 3c and 3e, respectively, which is akin to Figure 3d for the G band. Electronic structure is usually captured through resonance Raman spectral features, as well as through the differential second-order Raman spectra, wherein the observed spectra are interpreted in terms of maxima in the joint electron density of states. The “dispersion” in the position of D and 2D bands is the key factor in the quantitative evaluation of geometrical curvature and corresponding topology, assigned to either microscopic tensile or compressive stresses/strains depending on down- and upshifts, respectively.
Alternatively, these bands are also useful for quantifying mechanical deformation in nanocarbons alone or when combined with host materials forming functional nanocomposites. While the G band variation is rather weak, the variation in D and 2D bands provides yet another measure of the curvature/ topology, as they are sensitive to structural modification induced by local pentagons or intrinsic defects. Following the “isolated pentagon rule,” two adjacent pentagons (mitosis defect) Reference Zsoldos59 are somewhat unstable, which manifest curvature, thus introducing microscopic stress fields in the C–C bonding network. Since the introduction of pentagons in an otherwise hexagonal carbon system modifies the electronic structure, all the properties dependent on the electronic structure of carbon are affected. Moreover, it turns out that the ordering of the valence or highest occupied molecular orbitals states is largely unaffected by the curvature, only the lowest unoccupied molecular orbitals states are affected. Besides, theoretical numerical calculations for nanotubes show smoothening of the van Hove singularities in density of states devoid of standard singular behavior, with an increasing number of layers and an increasing curvature or strain. This can be explained by an increase in the “mass factor” due to geometry/curvature, which lowers the wave number in the phonon spectra. The obtained RS results are in qualitative agreement with the tight-binding calculations for the closed nanotube. Reference Mennella, Monaco, Colangeli and Bussoletti77 Similar information for the hyperfullerenes is not shown because the assignment of bands differs from that for other sp2 C materials discussed. Once established, this knowledge provides a powerful machinery to understand newer nanocarbons and indeed points to an unprecedented emergent paradigm of global topology/curvature → property → functionality relationship.
Other metrological techniques
We emphasize that these concepts are applicable to other topologically distinct nanomaterials, which include boron-nitride (BN) nanotubes and nanotori, Reference Rubio, Corkill and Cohen28 helical gold nanotubes, Reference Oshima, Onga and Takayanagi29 and Möbius conjugated organics. Reference Tanda, Tsuneta, Okajima, Inagaki, Yamaya and Hatakenaka24,Reference Ajami, Oeckler, Simon and Herges30 In addition to RS, there are other techniques such as small-angle x-ray and neutron scattering (SAXS/SANS), scanning electron microscopy, TEM, and various optical imaging techniques that can be used as metrological tools to link materials topology. Topological correlations that could be obtained via scattering techniques would be highly desirable in this regard. Similarly, two-point (r and r′) network topology correlations could be obtained by appropriately choosing the momentum k range in scattering experiments. X-ray tomography has also been used for the topological characterization of porous media and porous networks. Reference Vogel, Mecke and Stoyan78,Reference Chae, Siberio-Perez, Kim, Go, Eddaoudi, Matzger, O’Keefe and Yaghi79 Eventually, metrological techniques will allow us to probe topology from nano- to meso- and macroscale lengths in various materials.
Topological defects: Local versus extended
Local or extended deviations from the given topology of a material result in topological defects. They can substantially alter materials properties or give rise to entirely new functionality in some cases. In the case of carbon defects, local violation by topological defects (i.e., violating nanoscale translational order inherent in periodic nanostructures) leads to novel curved nanocarbons, Reference Gupta and Saxena9 which in turn transcends to the global topology of the material. In particular, a pentagon (or a heptagon) is a local topological defect in the hexagonal network of graphene or graphite, or a defect with sp3 character in a sp2-bonded lattice. Presence of these defects not only introduces curvature in the material, thus affecting the global topology, but also affects the electronic structure, physical properties, and functionality. It has been recently reported that even with defects, graphene is the strongest material, and “so strong that it would take an elephant, balanced on a pencil, to break through a sheet of graphene the thickness of Saran Wrap.” Reference Lee, Cooper, An, Lee, van der Zande, Petrone, Hammerberg, Lee, Crawford, Oliver, Kysar and Hone80 In other materials, for instance, connectivity at various nodes in cross-linked polymer networks Reference Hadjichristidis, Pispas and Floudas31,Reference Sperling41 and silica networks Reference Hobbs, Jesurum, Pulim and Berger44 defines the local topology, which is characterized by local clusters, bond-angle distributions, and radial correlations.
Materials properties crucially depend on the presence and type of defects in the lattice. In the same vein, topological defects are even more interesting, as their existence puts a novel twist on the properties of materials. In particular, it is the mesoscale control and characterization of these defects that will allow us to tap into the full potential of topology in materials. Semiconductors are a good example in which a ppm or ppb level defect concentration can alter the transport properties rather substantially. Vacancies, substitutional, interstitial, and other point defects are examples of non-topological defects. Extended defects such as dislocations, disclinations, domain walls (including twin boundaries that connect two different crystallographic orientations or variants), vortices, and magnetic flux tubes in Type II superconductors are all examples of topological defects. Reference Nakahara1 Topological defects occur either at the boundary of two equal energy states, such as the interface between two different magnetic moment directions or two different crystalline orientations, or when the crystalline continuity is broken, for instance, in a screw dislocation. Such defects are responsible for many common phase transitions, including melting and certain magnetic transitions. Topological defects are characterized by, in addition to the material’s genus and Euler characteristic, their topological charge (e.g., the Burgers vector strength can be viewed Reference Gröger, Lookman and Saxena81 as “topological elastic charge density”).
Familiar defects in materials include domain walls between two differently oriented crystals or magnetic states, which are in fact a kind of topological defect called solitons. Solitons are ubiquitous in nature as well as in materials; they are created by a cancellation of the nonlinear and dispersive effects in the material (or medium). Reference Dauxois and Peyrard82 Dispersive refers to the speed of a soliton or solitary wave that depends on its frequency. Ideally, solitons (and domain walls) propagate through a material or medium or through each other without altering their shape. Similarly, some superconducting materials and Heisenberg magnets exhibit other types of topological defects (e.g., vortex lines and a variety [spiral, helical] of spin textures as well as flux tubes). Missing half planes in crystals are also extended topological defects denoted as edge dislocations. Likewise, fivefold coordinated entities in some crystals are actually orientational disclinations (i.e., topological defects in an otherwise sixfold coordinated triangular lattice).
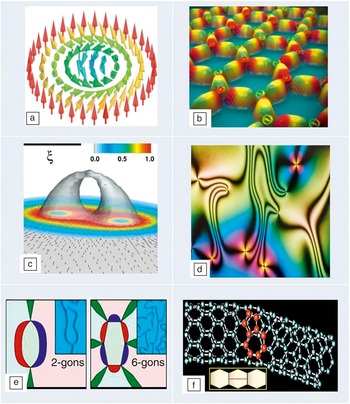
Here, we choose to describe more elaborate topological defects because they have been observed in many complex functional materials and possess rich internal structures, which affect materials properties in unexpected, multiple ways. Figure 4 depicts a half dozen such exotic topological defects in a diverse variety of functional materials. Skyrmions (Figure 4a) are spin textures that cover a sphere once (i.e., spin orientation goes from 0 to π) and have been observed in both metallic and insulating chiral magnets. Reference Muhlbauer, Binz, Jonietz, Pfleiderer, Rosch, Neubauer, Georgii and Boni8,Reference Seki, Yu, Ishiwata and Tokura83 Unlike vortices, skyrmions do not have a core and thus can be driven by a small electrical current with apparent applications in information storage. However, similar to vortices, they also form a periodic structure called the skyrmion lattice, which has been observed in chiral magnetic metals, Reference Muhlbauer, Binz, Jonietz, Pfleiderer, Rosch, Neubauer, Georgii and Boni8 chiral magnetic insulators (and multiferroics), Reference Seki, Yu, Ishiwata and Tokura83 and chiral nematic liquid crystals. Reference Fukuda and Zumer84 Isolated magnetic monopoles (or magnetic charges) are otherwise deemed impossible to exist, but they have been recently observed in artificial spin ice Reference Zhang, Gilbert, Nisoli, Chern, Erickson, O’Brien, Leighton, Lammert, Crespi and Schiffer85 (Figure 4b), which is an example of a frustrated magnet with application in memory devices. The skyrmion lattice can also exhibit magnetic monopoles (and associated Dirac strings). Reference Milde, Kohler, Seidel, Eng, Bauer, Chacon, Kindervater, Muhlbauer, Pfleiderer, Buhrandt, Schutte and Rosch86
Exotic topological defects in functional materials. (a) A spin texture called skyrmion in chiral magnets (red to blue color denotes rotation of spin by π); Reference Muhlbauer, Binz, Jonietz, Pfleiderer, Rosch, Neubauer, Georgii and Boni8,Reference Seki, Yu, Ishiwata and Tokura83 (b) magnetic monopoles (+ and – magnetic charges in a hexagonal configuration of nanomagnets) in artificial spin ice; Reference Zhang, Gilbert, Nisoli, Chern, Erickson, O’Brien, Leighton, Lammert, Crespi and Schiffer85 (c) double-core boojum structure in colloidal particles dispersed in a nematic liquid crystal. The correlation length ξ is related to the colloidal particle radius R = 0.1 μm ∼ 9.3ξ. The color bars represent the degree of nematic biaxiality; Reference Tasinkevych, Silvestre and Telo da Gama87 (d) Schlieren texture in a uniaxial nematic liquid crystal; Reference Lavrentovich, Arodz, Dziarmaga and Zurek48,Reference Settles88,Reference Dierking, Marshall, Wright and Bulleid89 (e) multi-gon vortices in multiferroic thin films (different ferroelectric domain edges are denoted by red, blue, and green colors); Reference Chae, Horibe, Jeong, Rodan, Lee and Cheong90 and (f) a pentagon-heptagon defect in a curved carbon nanotube (and inset shows the mitosis defect through a horizontal red line). Reference Chico, Crespi, Benedict, Louie and Cohen57

The middle row in Figure 4 shows other exotic topological defects. Figure 4c depicts 3D boojums with a complex structure for colloidal particles dispersed in a liquid crystal. Reference Tasinkevych, Silvestre and Telo da Gama87 Boojums are surface defects, first observed in superfluids (with hedgehog point defects being their bulk counterpart), and are now ubiquitous in soft materials, including Langmuir monolayers, liquid crystals, and even in Bose–Einstein condensates. Figure 4d depicts a Schlieren texture Reference Lavrentovich, Arodz, Dziarmaga and Zurek48,Reference Settles88,Reference Dierking, Marshall, Wright and Bulleid89 related to the “director field” of a uniaxial nematic crystal observed under a polarizing microscope. Some nanoscale ferroelectrics and multiferroic thin films can show double (electric and magnetic) vortices, Reference Chae, Horibe, Jeong, Rodan, Lee and Cheong90 as depicted in Figure 4e, which can affect the magnetoelectric response of the material. Finally, Figure 4f shows a pentagon-heptagon pair topological defect in a carbon nanotube, Reference Chico, Crespi, Benedict, Louie and Cohen57 which renders it with a curvature. Other unusual topological defects in materials (e.g., umbilical defects Reference Dierking, Marshall, Wright and Bulleid89 ) have not been discussed here.
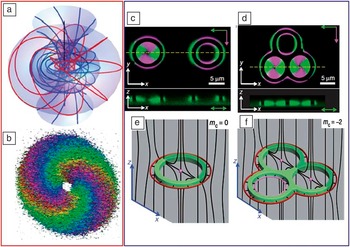
From a metrological perspective, another recently observed exotic topological defect is the Hopf fibration in a chiral nematic liquid crystal. Reference Chen, Ackerman, Alexander, Kamien and Smalyukh91 The Hopf fibration is a complex texture that resembles a series of linked rings wrapped around a torus (see Figure 5 a, left column). It can be controllably generated experimentally in cholesteric liquid crystals (i.e., nematics) with a twist (or preferential handedness), as depicted in Figure 5b with a specific color coding. Using specially shaped laser and electron beams, one can orient the molecules in a liquid crystal to form not just vortices and knots, but also exotic topological defects, including the Hopf fibration. The latter was imaged Reference Chen, Ackerman, Alexander, Kamien and Smalyukh91 with three-photon excitation fluorescence polarizing microscopy in conjunction with holographic optical tweezers in the same optical setup. In fact, interfering light beams can create a textured molecular field in a liquid crystal, and optical laser lithography Reference Fischer and Wegener92 can then be used to sculpt specific topological shapes out of a material. This approach opens up the exciting area of topological imaging in materials science.
Illustration of topological metrology in two different experimental situations. (a) Schematic and (b) experimentally inferred image of an exotic topological defect called a Hopf fibration in a chiral nematic liquid crystal. Reference Chen, Ackerman, Alexander, Kamien and Smalyukh91 The image was obtained using three-photon excitation fluorescence polarizing microscopy (3PEF-PM) in conjunction with holographic optical tweezers. In the schematic, the flow lines with different colors correspond to different regions. In the image, winding bands of color meet at two hedgehog defects. The direction of the director field ranges from red to violet as the field rotates by π. (c) Single and (d) triple handlebody (g = 1,3, respectively) textures of non-spherical colloidal particles dispersed in a liquid crystal obtained by 3PEF-PM. Reference Senyuk, Liu, He, Kamien, Kusner, Lubensky and Smalyukh93 Green and magenta colors correspond to two orthogonal polarizations of excitation light. The cross-sectional image in the lower panels of (c) and (d) were obtained along the dashed yellow line. (e–f) Schematic diagrams of the corresponding director field (black lines). Red and magenta lines show outer and inner disclination loops. Reference Senyuk, Liu, He, Kamien, Kusner, Lubensky and Smalyukh93 In the (e) and (f) panels, m c denotes the topological charge. (c–f) Adapted with permission from Reference 93.

Nonspherical colloidal particles with genus varying between 1 and 5 dispersed in nematic liquid crystals Reference Senyuk, Liu, He, Kamien, Kusner, Lubensky and Smalyukh93 underscore the importance of topology in materials science by way of inducing a zoo of topological defects and concomitant changes in material properties. These colloidal particles are accompanied by unusual topological defects with a net topological charge always equal to half of the Euler characteristic, χ/2. Figure 5 exhibits results for g = 1, 3 as observed (Figure 5c–d), schematically indicating different configurations (Figure 5e–f). These experiments may enable topology-dictated elastic colloidal interactions and self-assembly of reconfigurable topological memory devices. Three-dimensional nonlinear optical imaging reveals that the topological charge is conserved. On the other hand, photothermal melting, laser tweezing, and electric fields cause transformations between these different configurations of colloidal particle-induced structures.
Some materials display topological disorder, which is quite distinct from the presence of topological defects. An example is that of 2D foams, where the distribution of the number of bubble sides provides a quantitative measure of topological disorder (as opposed to geometric disorder, which is related to the distribution of bubble area). Reference Quillet, Talebi, Rabaud, Kafer, Cox and Graner94 In particular, topological disorder in 2D foams (e.g., Table II) under shear can be measured by direct video imaging of a fluorescent tube, which provides bubble size-topology correlations. Reference Quillet, Talebi, Rabaud, Kafer, Cox and Graner94 For soft materials such as colloids, 3D nonlinear optical imaging is employed to measure the topological charge of defects. Similarly, external fields (electric, magnetic, pressure or stress), photothermal melting, laser tweezing, and other techniques are used to reveal their defect structures. Magnetic vortices and skyrmions are imaged via electron holography and Lorentz transmission electron microscopy. Schlieren imaging techniques could also come in handy when probing the topology of a variety of defects (e.g., in liquid crystals). Reference Lavrentovich, Arodz, Dziarmaga and Zurek48,Reference Settles88 Next, we demonstrate how topology can be usefully invoked to determine the deformation energy of materials, specifically soft matter.
Elastic deformation energy
Biological vesicles have been observed to have a genus up to g = 3; however, synthetic vesicles can have very large values (∼50) of g. Reference Michalet and Bensimon32 First, we start with the Helfrich-Canham curvature free energy: Reference Lipowsky33
 $$E_{^g } = \int {dS\matrix{ {} \cr } [{{\kappa _b } \over 2}(} H - H_0 )^2 + \kappa _G K],$$
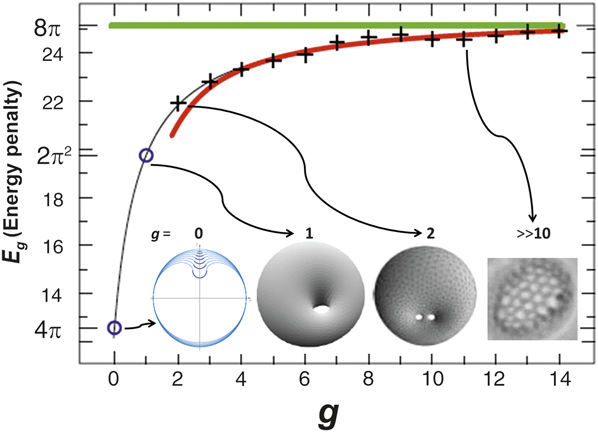
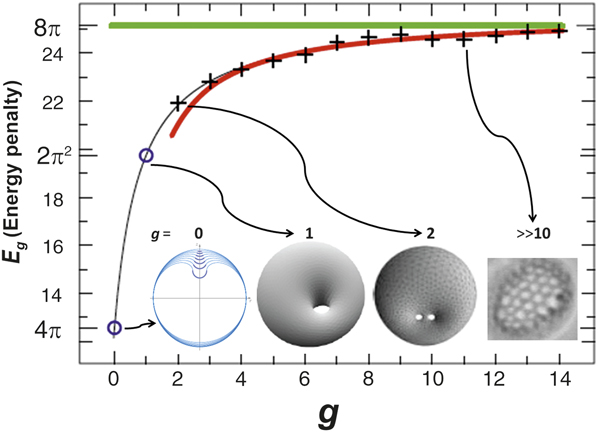
where κb= bending rigidity, κG= Gaussian rigidity, dS = element of surface, H 0 is the spontaneous mean curvature, and H and K are the mean and Gaussian curvature, respectively. Next, by using only topological means (such as Bogomol’nyi decomposition, Reference Benoit, Saxena and Lookman95 which is usually invoked to study topological invariance and indicates that the energy in Equation 2 is greater than or equal to 4π κG times a genus dependent term), one can calculate the elastic energy of deformation as a function of genus for vesicles, Reference Benoit, Saxena and Lookman95 as depicted in Figure 6 . The energy increases monotonically with genus and asymptotically reaches the value of 8π, consistent with the Wilmore conjecture, a mathematical extrapolation. Reference Benoit, Saxena and Lookman95 From topological analysis, one finds that the spontaneous bending energy contribution resulting from any deformation of the vesicles from their metastable shapes falls into two distinct topological sets: shapes of spherical topology (g = 0) and shapes of non-spherical topology (g > 0). These ideas can be readily applied to other materials and topologies.
Elastic deformation energy of vesicles (E g ) as a function of genus (g). Reference Benoit, Saxena and Lookman95 Blue circles represent exact values; crosses represent numerical estimates computed with a (Brakke’s) surface evolver. The red curve is an estimated fit to the deformation energy for large values of g. Green line denotes the asymptotic value of 8π. Reference Benoit, Saxena and Lookman95
Analogously, the deformation of negative curvature periodic minimal surfaces such as Schwarzites and double gyroids can be calculated, specifically under hydrostatic stress, assuming that only the lattice parameter changes under deformation. Reference Gupta and Saxena20 Similarly, carbon and graphene nanoribbons can exist in helicoidal shape, and their axial deformation can be readily calculated by varying the pitch of the helicoid. Reference Gupta and Saxena20 In both cases, the elastic energy is proportional to the Gaussian curvature and the material’s bulk (or axial) modulus.
Finally, we consider topological quantum effects that are pervasive in condensed matter physics and have greatly enriched the discovery of novel phenomena as well as their attendant device applications.
Topological quantum effects
Topology is frequently invoked in condensed matter physics (wherein topology of the wave function affects the observed phenomena) such as in the quantum Hall effect; Reference Nakahara1 the Aharonov–Bohm (AB) effect; Reference Nakahara1 and many related effects Reference Aharonov and Casher96,Reference Aharonov and Anandan97 with applications in nanowire devices, Reference Mourik, Zuo, Frolov, Plissard, Bakkers and Kouwenhoven98 photonic waveguides, Reference Haldane and Raghu99 and photonic quasicrystals. Reference Verbin, Zilberberg, Kraus, Lahini and Silberberg100 Another quantum effect is the Casimir force that has found many applications in nanomechanics and nanoelectromechanical systems. Reference Mostepanenko and Trunov101 Furthermore, the topological Casimir effect has also been studied in CNTs, nanorings, and graphene. Reference Bellucci and Saharian102
Topological materials and phase transitions
In materials such as topological insulators Reference Hasan and Kane4 (e.g., Bi2Se3, Bi2Te3) and topological superconductors Reference Sasaki, Kriener, Segawa, Yada, Tanaka, Sato and Ando103 (e.g., Cu x Bi2Se3), the topological order changes under the influence of external fields, resulting in a topological phase transition. Topological order refers to a kind of order at zero temperature, which is macroscopically described as a “robust ground state degeneracy.” It is also related to time reversal symmetry and spin-orbit coupling in materials, directly affecting the magnetoelectric response of the material. In topological insulators, the bulk is insulating, while the nontrivial topology of the bulk electronic energy bands demands that Dirac (i.e., relativistic) fermions are realized as surface states (which are metallic). Reference Hasan and Kane4 Instead of the usual quadratic dispersion, their electronic band structure has a linear dispersion (a Dirac cone) in the center of the bandgap that arises from the topological properties of their band structure. Analogously, topological crystalline insulators have been proposed as well. Reference Fu104
Dirac materials
Materials whose nontrivial electronic properties are a direct consequence of the linear energy Dirac spectrum E
D = νk, where
 $E$
D denotes the band electronic energy, ν is a constant, and
 $k$
is the wave vector, are called “Dirac materials.”
Reference Cayssol19,Reference Rossi, Bardarson, Fuhrer and Sarma105,Reference Balatsky, Vekhter and Zhu106
In other words, the conduction and valence bands touch at an isolated set of points called the Dirac points. Graphene, strong topological insulators
Reference Hasan and Kane4
(Bi2Se3), and some d-wave superconductors
Reference Balatsky, Vekhter and Zhu106,Reference Wehling, Black-Schaffer and Balatsky107
(Bi2Sr2CaCu2O8) are excellent examples. The motion of electrons in these materials is described not by the Schrödinger equation but by the Dirac equation. The low energy properties of Dirac materials are described by 2D massless Dirac fermions. These materials provide an entirely new avenue for exploring unusual electronic and thermal transport properties with potential applications. It is apparent that materials scientists are now primed to harness topological quantum effects in a slew of emerging topological materials.
Reference Yan and Zhang18
Summary and outlook
Using nanocarbons, Reference Gupta and Saxena9,Reference Gupta and Saxena10 soft matter, Reference Hadjichristidis, Pispas and Floudas31,Reference Hutzler and Weaire37,Reference Lavrentovich, Arodz, Dziarmaga and Zurek48 and biological systems Reference Skjeltorp39,Reference Katsaras and Gutberlet52 as illustrative examples, we have demonstrated that understanding the physical properties of a broad class of materials in terms of topology and geometry is not just useful but imperative for progress in materials science. We described the essential concepts of topology, topological characteristics, and their emerging role, clearly delineating the differences between local versus global topology, ubiquity, and importance of a menagerie of topological defects ranging from the commonplace domain walls to exotic skyrmions, boojums, and magnetic monopoles. Although topology is effectively elastic geometry, we emphasized the difference and how to link the two.
We also illustrated how RS, nonlinear optical imaging, and other analytical techniques adopted to topological characterization of materials provide a preliminary indication that a powerful topological metrology toolbox is now available to materials scientists. In particular, we identified the effects that arise due to curvature in lattice vibrational modes (usually ignored), and provided Raman spectra for otherwise unexplored nanoscale carbons in order to posit a truly viable topological metric. Reference Gupta and Saxena9,Reference Gupta and Saxena10 This is a field in its infancy where many new metrological techniques are likely to be developed and discoveries are to be made in the near future.
In addition, we discussed complex and network topologies prevalent in soft matter, foams, DNA, proteins, and other biomaterials. We envision that novel topological and geometric characteristics can also be identified and adopted as metrics to design and synthesize advanced hard, soft, and biomacromolecular materials and analyze them from an entirely different perspective that explicitly incorporates topological metrology (i.e., a search for quantifying spatial and temporal topological correlations). Adopting theory, modeling, topological algorithms and databases, 16,17 and extensive simulation tools already used in condensed matter physics and quantum chemistry to the specific topological problems will accomplish these goals. As another manifestation of topology, using the Helfrich–Canham bending energy, we calculated the elastic deformation energy of vesicles with varying genus. Recent observations of multi-genus colloidal particles, Reference Senyuk, Liu, He, Kamien, Kusner, Lubensky and Smalyukh93 Hopf fibrations, Reference Chen, Ackerman, Alexander, Kamien and Smalyukh91 and dislocation reactions using topological tweezers Reference Irvine, Hollingsworth, Grier and Chaikin108 attest to the dawning of this field. Likewise, exploiting topological quantum effects and observing topological phase transitions is a significant growth area for research. Reference Yan and Zhang18 Consolidating metrology techniques for probing topology and redirecting geometric concepts toward topological applications are some of the new exciting frontiers, with a substantial scope for unanticipated discoveries. This combined approach of integrating modeling, design and synthesis, and metrology would undoubtedly usher in the powerful emergent paradigm of topology/geometry → property → functionality into materials science.
Acknowledgments
This work was supported in part by the US Department of Energy (A.S. and S.G. through LANL-CINT Gateway).

Sanju Gupta has been an associate professor of physics at Western Kentucky University since August 2013. She holds an adjunct professor position at Drexel University, Philadelphia. Her main research interests are experimental condensed-matter materials physics and biophysics. She is a recipient of NIH, NSF, and JSPS fellowships. Gupta also is a member of the Materials Research Society, the American Physical Society, American NanoSociety, and the American Vacuum Society. Gupta can be reached at the Department of Physics and Astronomy, Western Kentucky University, USA; tel. 270-745-5940; and email sanju.gupta@wku.edu.

Avadh Saxena is a group leader of the Physics of Condensed Matter and Complex Systems group at Los Alamos National Laboratory, where he has been since 1990. He holds adjunct professor positions at the University of Barcelona, Spain, and the University of Arizona, Tucson. He also is a scientific advisor to the National Institute for Materials Science (NIMS), Tsukuba, Japan, and the Institute for Nanoscience and Nanotechnology at the University of Barcelona. Saxena’s main research interests include phase transitions, optical, electronic, magnetic, transport, and vibrational properties of functional materials. He is a member of the American Physical Society, the Materials Research Society, and the Sigma Xi Scientific Research Society. Saxena can be reached at the Los Alamos National Laboratory, Los Alamos, NM, USA; tel. 505-667-5227; and email avadh@lanl.gov.