The subnational turn in comparative politics and international relations has placed local context back at the center of mainstream political science. This is a welcome development for scholars who attend not just to advantages of subnational comparisons for more convincing research designs, Footnote 1 but to the concrete political problems facing subnational regions such as the Catalonia, West Papua, and Tibet, and which affect contemporary politics at both the subnational and national levels. Yet gone unnoticed is how the methodological tools that comparativists employ can erase their ability to study—or perhaps even to see—the politics of such critical subnational regions. Government service provision in so-called “backward” regions such as West Papua and parts of Northeastern Brazil has dramatic implications for the livelihoods of the millions of people—and it is worse than can be explained by theoretical variables such as physical remoteness, ethnic or racial composition, or absolute levels of poverty. Most current surveys of China exclude Tibet Footnote 2 and frequently exclude Xinjiang as well, even though these are the regions that might reveal the limits of the Chinese project of state and nation building. Separatist conflicts in Mindanao and the Basque Country, and insurgencies in Pattani and Chiapas, have both national and international implications, but have more plausible causes than there are instances of insurgency within the national state in which they are located.
The result is a potential disjuncture between what comparative methods can study, and the types of actual political problems that subnational research in comparative and international politics might confront. In the regions just described, “scaling down” Footnote 3 to the subnational level reveals the limits of comparative analysis, even within countries. For those scholars who are committed to addressing concrete problems in subnational politics, comparative methods may fail to produce explanations, even on its own terms, for the very phenomena that scholars set out to tackle.
I argue here that the mainstream methodological language for understanding subnational variation renders such important cases illegible, and precisely because of these regions’ distinct histories and social structures. Eschewing statistical terminology such as “outliers” or “deviant cases,” in which regions or units within them have values on a dependent or independent variable that differ from a general pattern or association across subnational units, Footnote 4 I adopt a problem-driven approach to comparative methods in such cases are defined by their relationship to the causal questions under consideration. Chiapas, Biafra, Pattani, and other such regions are politically consequential subnational units in which key features of the data are unobservable to the researcher, or in which particular conjunctions of historical, social, or other factors render comparative research designs fundamentally indeterminate. More precisely, a region of exception is any region in which either unobservability or indeterminacy prevents causal inference using comparative methods.
Importantly, this definition does not follow an “essentialist” definition for regions of exception, such as linguistic distinctiveness, historical difference, or uniqueness of social structure. Instead, my terminology echoes Giorgio Agamben’s use of “state of exception” to describe a mode of governance that lies outside of the regular constitutional or juridical order. Footnote 5 Regions of exception are “exceptional” in relation to particular social, political, economic, and historical processes found across other subnational regions, and reveal the limits of subnational comparison as a tool for causal inference. Area specialists have long been suspicious of comparative approaches in the social sciences, but my argument is decisively not an argument in favor of context over comparison, and does not require scholars to hold that contextual knowledge is superior to comparative social science (or the reverse). Instead, I identify a new kind of tension that neither area specialists nor comparativists have properly understood, but which affects how political scientists approach the study of subnational units and the political problems that they face. The orienting framework of comparative methods for causal inference leads political scientists to dismiss such regions of exception as irrelevant or “deviant” because they cannot fit neatly within a nomothetic conception of causal explanation. Consequently, subnational comparative designs are blind to some of the most important political problems facing the regions that they study.
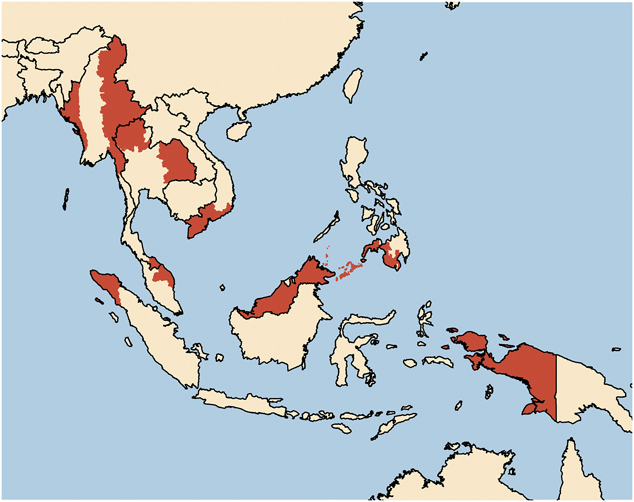
The challenges associated with regions of exception are plainly not unique to subnational comparative designs—they have analogues in cross-national comparative research, in survey design, in experimental political science, even in old debates about American exceptionalism—yet they have not been articulated in ways that highlight the strengths and limits of subnational comparisons. Footnote 6 And just as the methodological issues that I identify are general challenges to comparative research at any level of analysis, they are also issues that span quantitative and qualitative methodologies. In what follows, I first characterize regions of exception using the standard language of causal inference and comparative methods, and then explain why this language is particularly fruitful for grappling with subnational comparative research in mainstream political science. I then illustrate the implications of regions of exception for current practice in comparative politics using three questions for which the subnational comparative method is ideally suited—local public goods and economic development, identity and insurgency, and ethnic voting—using examples from Southeast Asia. Southeast Asia is a particularly useful region through which to explore these issues because of its rich cross-national diversity of state forms, political institutions, and colonial histories alongside the concomitant internal diversity of each state in geographic, cultural, and historical terms. Local public goods, insurgency, and ethnic voting are concrete political issues that occupy politicians, mobilize citizens, affect how citizens vote, and threaten civil peace in every country in the region. Most critically, each country case features at least one distinct region of exception (refer to figure 1).
“Potential” regions of exception in Southeast Asia
Note: The shaded areas in this map are regions that may be considered regions of exception in the context of the causal hypotheses outlined in this article.

Drawing on the examples of regional support for the incumbent regime in the Malaysian states of Sabah and Sarawak, rural electrification in Indonesian Papua, insurgent violence in the Malay-Muslim provinces of southern Thailand, and others, I outline just how comparison renders politics in these regions illegible, and then show how to make that politics legible once again. Although I confine my analysis to Southeast Asian cases, the types of challenges that emerge in this world region are typical of the types of problems associated with regions of exception through the world, including the well-known case of the South in US politics.
My primary audience is scholars who leverage subnational research designs in order to study general causal propositions but who remain committed to engaged scholarship on concrete political topics in subnational politics. For them, my contributions are to clarify exactly how regions of exception challenge subnational comparisons, and the consequences of an unreflective pursuit of comparative methods for understanding the substantive problems that comparative politics studies. My second contribution is to show how to surmount or avoid some of these challenges. Available strategies for confronting regions of exception include modeling the sources of heterogeneity, adjusting the scope conditions of particular causal claims, and embedding subnational comparisons within designs that exploit additional inferential leverage at other levels of analysis.
However, these strategies require tradeoffs. My solutions to the problems raised by regions of exception in comparative designs frequently change the causal parameter of interest, or alternatively, the population being studied. They also force researchers to be modest in their aspiration to follow Adam Przeworski and Henry Teune’s advice to “replac[e] proper names of social systems by the relevant variables,” recognizing that some social formations are best understood as “finite conjunctions of constituent elements” rather than “residua of theoretical variables.” Footnote 7 To the extent that regions of exception are themselves the objects of investigation, rather than nuisances to be accounted for, this has substantial implications for how political scientists address the politics of violence, identity, and development, among many others. These conclusions recommend modesty about the ambit of comparative methods when used for causal inference, and forthrightness about the necessity of both alternative methods of inference and different kinds of subnational research—descriptive, exploratory, conceptual, and interpretive—when confronting some of the most important political phenomena facing political scientists today.
Conceptualizing Regions of Exception
Before addressing how comparative methods and causal inference can render regions of exception illegible, we need an understanding of what makes a subnational region “exceptional.” One approach would be to look at the features of a region, and specify whether or not they vary from other regions: does it have a different majority religion, or a different colonial history, or something similar? I adopt a different approach, one that highlights the research enterprise itself, where a region of exception is any region in which either unobservability or indeterminacy prevents causal inference using comparative methods. I describe unobservability and indeterminacy in greater detail in the next section; for now, five features of this definition of warrant further comment.
First, this definition implies particular understandings of both causality and of the logic of inference using comparative methods. Here, I follow the standard framework of counterfactuals and potential outcomes. Footnote 8 The logic of inference is complementary, and follows Przeworski and Teune; Footnote 9 not only is it the case that “classes of social events are viewed as generalizable beyond the limits of any particular historical social system,” but such generalization is necessary to make causal statements. I make these assumptions explicit to reinforce that nothing in my argument is a critique of either comparison or of contemporary understandings of causal inference in the potential outcome framework.
Second, the definition of regions of exception focuses on the researcher’s ability to use comparative methods to gain inferential leverage over causal questions, rather than the essential features, histories, or social structures of particular regions. Trivially, every region within a country has its own unique history and structure. That uniqueness itself does not create regions of exception, or undermine the logic of comparative inquiry. The challenge is in determining the extent to which any form of unobservability or indeterminacy threatens the ability of the researcher to draw valid inferences across collections of units. This point will prove important in my discussion of unit homogeneity and constant effect assumptions. Relatedly, it is certainly the case that regions that appear “exceptional” or “unusual” often prove to be fruitful sites of comparative theory building. Nevertheless, such efforts—while theoretically productive—may not result in insights that admit causal inference via comparison across subnational units within the country being studied.
Third, following directly from the preceding points, regions of exception are defined in terms of their relationship to causal questions. Because there are many causal questions, there are in principle many regions of exception, and one region may be exceptional for some questions but not others.
Fourth, regions of exception are not the same thing as deviant cases or statistical outliers. Footnote 10 The latter two express the relationship between a case and an observed pattern across other cases, while regions of exception are defined with respect to causal effects that are, by the assumptions of the potential outcomes framework, unobservable. In some applications the two may overlap: outliers might reflect unobserved regional heterogeneity, and deviant cases may reflect heterogeneous causal processes. As such, case selection and model diagnostics can help to reveal regions of exception. But being a deviant case or a statistical outlier is neither necessary nor sufficient for a region to be exceptional.
Finally, the distinctions between qualitative and quantitative methods, or between statistical and non-statistical methods, have no bearing on the inferential problems posed by regional heterogeneity. Under the model of causal inference employed here, neither is immune to inferential threats due to unobservability or indeterminacy.
Common Features of Regions of Exception
If regions of exception are exceptional only with respect to specific causal questions, can we say anything general about them? Many subnational regions share common features that, while neither necessary nor sufficient for identifying them as regions of exception, frequently set them apart from the rest of the country in which they are found. Moreover, the common features of these regions constitute some of the obvious explanations for why these regions threaten causal inference: they involve geographies, colonial legacies, social structures, identities, and other distinctive features of particular regions. These are not defining features of regions of exception, but they are good clues. Conceptually, what unites these features is that each of them (space, history, social structure, and social consciousness) is a variable that may have causal implications for political structures and processes within regions.
Geography is characteristic of many exceptional regions that sit at the borders of modern nation states, making them peripheral from a geographic perspective. Examples abound: Xinjiang (China), Assam (India), Patagonia (Argentina), Chiapas (Mexico), Lappi/Lappland (province of Finland), the Basque Country (Spain), and Biafra (Nigeria). But while regions of exception often sit at borders, they need not. In the case of countries with a single predominant urban agglomeration (Amman, Jordan or Ulaanbator, Mongolia), we may conceptualize that urban center as the region of exception. Regions of exception may also be “vertically” peripheral, as in the region of upland South and Southeast Asia known as Zomia. Footnote 11
Geographic peripheralness is characteristic of many regions of exception, and sometimes a region’s particular geography itself presents the theoretical challenge for causal explanations—mountainous regions may be uniquely resistant to state penetration, for instance. But in most cases, geography is a marker or proxy of other regional characteristics with clearer theoretical implications. In many cases, the colonial legacy or history of state incorporation of a region sets it apart from its neighbors. In postcolonial states in particular, border regions are often subject to distinct trajectories of incorporation into the colonial state: outside of Southeast Asia, examples include Zanzibar (Tanzania), Jammu and Kashmir (India/Pakistan), Newfoundland (Canada), Casamance (Senegal), Cabinda (Angola), and the Chaco region (Paraguay). In other states, border regions were simply incorporated into the modern state at a different historical juncture: relevant examples are Alsace (France), Catalonia (Spain), and Dagestan (Russia). In either case, a region’s incorporation within the broader national state follows a distinct process from that of the remainder of the country. This may have implications for questions of national identity, secessionism, local state capacity, regional economic development, or other issues.
Regions of exception also frequently have distinct social structures. These may include distinct ethnic or racial profiles, patterns of traditional land use, patron-client relations, partisan attachments, levels of inequality, or any number of other salient characteristics of the regional social fabric that differ from those in the remainder of the country. To the extent that these characteristics are unique or distinctive in a particular region, they can define the types of causal questions for which a region is exceptional.
Another common characteristic of regions of exception is the politicization of regional distinctiveness. This phenomenon of contested regional identity corresponds to political debate about the “ideal” extent of the state and the relationship between state and region. The example of Spain is illustrative: depending on the causal hypothesis, Catalonia, the Basque Country, Galicia, and Andalucía may be regions of exception due to their distinct social structures and histories of incorporation into the Spanish state, although only Basque and Catalonian identities are politically salient today. The existence of contested regional identities has clear implications for causal questions about identity and secessionism, but also may influence questions about uneven spatial development or regional voting patterns.
Finally, many regions of exception are understood by their own national governments as having special characteristics. Such distinctions are often legally recognized with special administrative status. Such cases might be historical legacies with little contemporary import, as in the case of Special Area of Yogyakarta in Indonesia. In other instances, such as Aceh or Catalonia, special administrative status has tangible political consequences. Aceh, for example, is the only administrative division in Indonesia where regional parties are legal, which may in turn lead to a distinct logic of ethnic politics with implications for phenomena such as coalition formation in local legislatures. In still other cases, the formal importance or legal consequences of having special administrative status may be minor, but administrative status nevertheless reflects the historical and social reasons why regions may regions of exception for particular causal questions. Such examples include the autonomous regions of China, the ethnic states of Myanmar, and some of the autonomous republics and regions of Russia.
Why Not Observed Features?
Given the many observable characteristics that suggest why particular subnational regions may differ systematically from other regions, why not just use these features to define regions of exception? The first answer is that defining regions of exception with respect to threats to causal inference reflects my argument that these regions are not sociological or historical curiosities, or statistical outliers, but rather analytical problems. The central issue for comparative methods applied to causal questions is not, for example, that the Basque country has a distinct language, culture, and geography. The challenge is what can be learned about how these factors affect violence or secessionism using subnational comparisons for inferential leverage, and in turn, how the application of comparative methods for inferential purposes to such cases will miss the politics that a subnational approach ought to see. Modes of inquiry that eschew comparisons for causal inference do not encounter this specific analytical problem; for these modes of inquiry, regions of exception are not exceptional.
A second reason why I choose not to define regions of exception with respect to some set of inherent features is more subtle, but no less important. It might be that what seem like important inherent features from the perspective of the researcher actually do not matter for particular causal questions. Regions that might seem exceptional at first glance (say, Alsace in France) might actually prove to be entirely typical and unremarkable for particular political phenomena (say, the relationship between employment and voter turnout). By avoiding a definition that classifies regions as exceptional or not ex ante, I avoid a situation in which scholars must argue why particular regions are not exceptional, which would undermine what I consider to be the obvious strength of comparative methods for inferential purposes more generally.
Whose Comparative Method?
My discussion thus far has left unspecified just what “comparative methods” are. Early statements of subnational comparative research used the phrase “the comparative method,” Footnote 12 and thus implied—following Arend Lijphart Footnote 13 —that there exists a singular comparative method. More recently, comparative methodologists rejected the position that there is one comparative method. It is for this reason that I have avoided using the phrase “the comparative method,” and instead employed “comparative methods.” The scope here of my discussion of regions of exception is one particular use of comparison in subnational research, described earlier as comparative methods for causal inferential purposes. It is this particular instantiation of comparative methods that has thrust subnational comparative research into the mainstream of political science, as the search for credible identification strategies recommends close engagement with national and regional politics to better identify research design opportunities and untapped sources of data, Footnote 14 and thus it is this use that I address.
The ambit of comparative methods is in principle much broader. As Benedict Anderson argued in a posthumously published essay in the London Review of Books, the notion of comparison in comparative politics can be considered more expansively: “comparison is not a method or even an academic technique; rather, it is a discursive strategy.” Footnote 15 Understanding alternative ways in which comparison can produce knowledge, through surprise, by raising unexpected questions, or by unsettling established beliefs, is essential for many scholars eager to understand contemporary politics. That said, as I have argued, my purpose is not to criticize or dismiss comparative methods for inferential purposes—I see the case that this should lie at the center of comparative and international politics, both within and across countries, to be unassailable—but instead to identify how this particular understanding of comparison can obscure the politics of the regions to which they are applied, and to show how this matters. Doing so is most effective when making my case on “the comparative method’s” own terms. I discuss in the conclusion how alternatives to the comparative method for causal inference purposes might provide solutions to the issues that I identify here.
Exceptionalism in American, Comparative, and International Politics
The notion that some political unit may be exceptional is plainly not unique to regions of exception in subnational comparative research. American exceptionalism, for instance, occupies both popular debates and an influential literature in American and comparative politics on the “comparability” or “uniqueness” of US politics and society, including most notably Seymour Martin Lipset’s description of the United States as “an outlier.” Footnote 16 In Chinese political studies, Barry Naughton has described the challenges in generalizing anything about a purported “Beijing consensus” from the “exceptional case” of China itself, Footnote 17 and Elizabeth Perry has remarked on “the limits of comparison.” Footnote 18 Within the United States, “Southern exceptionalism” has long been an organizing principle in politics, history, and other fields, as has debate over whether the Southern experience can be reduced to race, economic structure, cultural predisposition, a mix of the three, or something else altogether known as “sectionalism.”
My approach to exceptionalism differs from these understandings of the U.S. South and between the United States and other countries. As noted earlier, it is anti-essentialist, focusing on the analytical problem of cross-case comparison rather than particular social, political, or economic features. In my understanding, what makes America “exceptional” is not its particular church-state relationship, uniquely expensive health care, the ideas of its European colonists and settlers, or some other feature, but rather the inferential problems that arise when trying to ascertain whether or not these (or other factors) matter for understanding American politics as it differs from other countries. When Lipset writes about the United States, and Naughton and Perry about China, they are correctly pointing the dimensions along which these countries are outliers or deviant cases.
Regional Heterogeneity, Unobservability, and Indeterminacy
This section describes in greater detail the challenges of unobservability and indeterminacy, two concepts that are central to any discussion of comparative methods for causal inference. To ground these ideas in a substantive political issue of contemporary importance, I illustrate each through the example of support for the incumbent Barisan Nasional government in the Malaysian states of Sabah and Sarawak. These states are useful because they are natural candidates as regions of exception: located on the northern part of the island of Borneo, these two Malaysian states are physically separated from peninsular Malaysia, they were ruled under different colonial regimes than the rest of Malaysia, they have different ethnic structures than the rest of Malaysia, they were incorporated into Malaysia differently than the states on the peninsula, and they are important sources of electoral support for the ruling coalition. Malaysia’s incumbent competitive authoritarian regime depends completely on votes from Sabah and Sarawak to maintain its electoral dominance, and yet Malaysian political studies retains a bias towards the study of peninsular Malaysia.
The “fundamental problem of causal inference” implies that inference always requires assumptions about unobservable quantities, Footnote 19 and comparative methods likewise depend on untestable assumptions about counterfactual states of the world. Footnote 20 There are three particular ways in which the assumptions necessary for subnational comparative methods can render regions of exception illegible.
Unit Heterogeneity
Unit homogeneity is the assumption that units are comparable, or “that all units with the same value of the explanatory variables have the same expected value of the dependent variable.” For mainstream comparative methods for causal inference, some version of this assumption “lies at the base of all scientific research.” Footnote 21 An illustration of unit heterogeneity is if the relationship between an electoral district’s ethnic composition and vote for an incumbent coalition differs systematically between peninsular Malaysia and Sabah and Sarawak, perhaps due to the distinct ethnic structures of the two East Malaysian states. In this case, the average effect of ethnicity on vote choice across all regions—although still an interesting quantity—is not a consistent estimate of that effect in either the peninsula or in East Malaysia.
Unit heterogeneity reflects the general tension between the definition of causality in the potential outcomes framework as a unit-level phenomenon and the impossibility of observing unit-level causal effects. Causal effects are only estimable in the aggregate, yet the assumptions that justify aggregating across units to estimate average causal effects are not derived from the data and, by definition, obscure unit-level heterogeneity. In one recent formulation,
Due to the ubiquity of heterogeneity in social phenomena, it is impossible to draw causal inferences at the individual level. All efforts to draw causal inferences in social science must take place at the group level. However, comparison of groups requires classification of intrinsically heterogeneous individuals into seemingly homogeneous groups. This is a fundamental dilemma facing all researchers in social science. Footnote 22
Because it is possible to choose any subset of units and explore whether causal effects appear to differ between these units and others, unit heterogeneity is particularly thorny issue, and assumptions of comparability must defended in the context of particular research questions and theoretical expectations. Regions with distinct historical trajectories or social structures, however, are natural candidates for violations of unit homogeneity assumptions.
Unobserved Heterogeneity
Unit homogeneity is an assumption about unobservable causal effects. Unobserved heterogeneity, by contrast, refers to a specific form of omitted variable bias in which one or more confounders varies systematically across units, but the researcher does not observe it. It is common in any data structure featuring units that are nested in different levels, such as panel data with observations grouped by region and year, or cross-sectional data grouped by region. In the running example of Sabah and Sarawak, we may suspect that historical factors unique to each state, but which cannot be captured in variables that are measurable across Malaysian states, affect the expected degree of support for the incumbent coalition in each electoral district.
Unobserved heterogeneity is more conceptually straightforward than unit heterogeneity. Moreover, to the extent that these unobserved factors are constant within regions, in regression-based analyses, fixed-effects estimators adjust for all sources of unobserved heterogeneity. Yet if the goal is to explain each region’s differences rather than simply to acknowledge them—to explain why Sabah and Sarawak differ from the rest of Malaysia instead of simply acknowledging that they do—fixed effect estimators are unsatisfying. This is because they do not adjudicate among competing region-specific sources of variation. This observation about treating unobserved heterogeneity as a nuisance rather than a problem to be analyzed previews the coming discussion about the tradeoffs inherent in the solutions to inferential challenges raised here.
Nonignorable Missingness
Nonignorable missingness occurs when some data is unavailable to the researcher, and the probability of its absence is itself a function of the unavailable data. Footnote 23 In the Malaysia example, suppose we are interested in the relationship between the percentage of an electoral district’s population that is of Indian ancestry and electoral support for the incumbent coalition. This question is of special importance in Malaysian politics, for Malaysian Indians are a relatively marginalized population—socially, economically, and politically—whose representatives within the incumbent BN regime enjoy particularly strong reputations for corruption. However, in Sabah and Sarawak, data on the percentage of a district’s population that is of Indian ancestry is not collected. Footnote 24 We can predict perfectly whether the variable Percent Indian is missing with an indicator variable for Sabah and Sarawak, but such a prediction is trivial. And although we may be able to predict that the values of Percent Indian are small in Sabah and Sarawak, without strong assumptions about the joint distribution of Indians and other groups across regions we cannot make inferences about the distribution of the Indian population by electoral district in Sabah and Sarawak.
This last point helps to illustrate the consequences of nonignorable missingness for causal inference and some of the ways forward. Ignorability assumptions are never testable, but it may be possible to proceed if we assume that the observed data are sufficient to model the missingness. In the case of missing data on Indians in Sabah and Sarawak, one might assume that in Sabah and Sarawak, as in the rest of Malaysia, there is a correlation between the percentage of an electoral district that is Chinese and the percent that is Indian and, furthermore, that Indians are more likely to cluster in urban areas in Sabah and Sarawak. But these are assumptions, and they might easily generate misleading inferences if migrants from Indonesia and the Philippines (who comprise most of the “Other” census category in Sabah and Sarawak) are also disproportionately present in these two states, which is almost certainly the case. An alternative strategy, the traditional method of handling missing data by dropping the missing observations, has the special consequence in this case of excluding the entire region altogether. This is equivalent to changing the research question of interest from the effect of Percent Indian on incumbent vote share in Malaysia to the effect of Percent Indian on incumbent vote share in peninsular Malaysia. Either way, confronting missing data in Sabah and Sarawak makes the two states illegible when studying ethnic voting: assuming away their possible distinctiveness, or excluding them entirely.
Unit heterogeneity, unobserved homogeneity, and nonignorable missingness are challenges to causal inference that arise when some portion of the data is not available to the researcher, either as a result of the fundamental problem of causal inference (in the case of unit heterogeneity) or due to the nature of causal process under consideration. But even assuming that all values on all relevant variables are available to the researcher, regional heterogeneity may still render research designs indeterminate due to small-n problems or complex interactive causality.
Small-n Problems
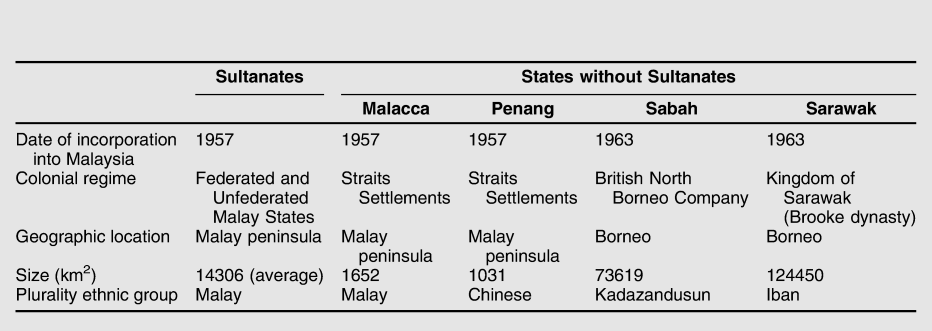
Small-n problems arise when there are insufficient observations to adjudicate among competing explanations for an observed outcome, or when there are more independent variables than there are cases, resulting in an indeterminate research design. Footnote 25 In the example of Malaysian states, suppose one knew that the states of East Malaysia were comparatively more supportive of the incumbent coalition than the other states in Malaysia. There are many potentially causes of such regional inequality, including these states’ unique ethnic structures, the distinct nature of the colonial regimes in East Malaysia, the different terms of incorporation into the Federation of Malaysia, and others. Some of these candidate explanations appear in table 1.
Malaysian States Compared

Any research strategy designed to uncover the region-level differences in support for the incumbent regime between the East Malaysian states and the peninsula is indeterminate: Sabah and Sarawak differ from the rest of Malaysia across multiple observable dimensions, even if they do share several observable characteristics with some peninsular Malaysian cases. Furthermore, it is not possible to “increase the n” by disaggregating to a lower unit of analysis, for these additional observations at a lower level of analysis are not independent from one another, therefore cannot increase inferential leverage on region-level variation. Even worse, several of the observable dimensions across which Sabah and Sarawak differ overlap perfectly with one another. As a result, regional heterogeneity in historical and social structures prohibits gaining inferential leverage on that distinctiveness through cross-regional comparisons.
Complex Interactive Causality
Complex interactive causality describes the possibility that the effects of multiple causal variables are conditional on one another. In the example of electoral support for the incumbent coalition in Sabah and Sarawak, the distinctiveness of politics in East Malaysia may be a result of both their unique history of incorporation into the Federation and their distinct ethnic structure—two variables that are jointly necessary but individually insufficient causes of support for the incumbent coalition. Even if every relevant causal variable is observable, complex interactive causality makes small-n problems more acute, for the number of independent observations necessary to use comparative methods to make causal inferences rises exponentially with the number of potential interactive causes. Footnote 26 Even following a deterministic model of causality, there is insufficient variation in the data to distinguish whether Sabah and Sarawak’s history of incorporation and ethnic structure are (1) jointly necessary, (2) jointly necessary and mutually reinforcing, (3) individually necessary, or (4) one is necessary but the other is not, as causes for higher average support for the incumbent coalition.
Regions of Exception in Southeast Asia
This section illustrates the challenges to subnational comparative designs in the context of important political problems in the Southeast Asian states of Indonesia, Malaysia, Myanmar, the Philippines, Thailand, and Vietnam. The highlighted regions in figure 1 are denoted as “potential” regions of exception because, depending on the causal process (and following the definition of regions of exception advanced here), they may be regions of exception for some questions and not others. I proceed thematically, beginning with local economic development.
Local Public Goods and Economic Development
Public goods provision is a core issue in comparative political economy, both because public goods may prove to be the key foundations upon which economic development takes place, and because of the provision of public goods frequently follows a political rather than a technocratic logic. Footnote 27 Indonesia is a particularly rich country context through which to explore the causes and consequences of local public goods, due both to its striking levels of spatial inequality and diverse sociopolitical structure. In the Indonesian case, few issues are more politically relevant for ordinary citizens—and more inherently contentious—than infrastructural development. It is a site of political contestation, of developmentalist rhetoric, and a window into national state priorities in a diverse and geographically fragmented archipelagic state.
One natural question is how social and economic characteristics of Indonesia’s local political units affect the availability of public goods, a question that speaks to recent research that has conceptualized the provision of electricity in Brazil and India in terms of distributive politics. Footnote 28 For example, are smaller and more remote villages less likely to be incorporated into the state’s electrical grid, provided by the state-owned power company (Perusahaan Listrik Negara, PLN)? Answering this question in the aggregate is relatively straightforward, but the distinct relationship between the provinces of Papua and West Papua and the Indonesian central state may complicate the conclusions. Put baldly, a general perception among Indonesians that Papuans are primitive, backward, or even racially inferior might imply that the Indonesian state does not interpret objective conditions in Papua as warranting state efforts to provide public goods for them.
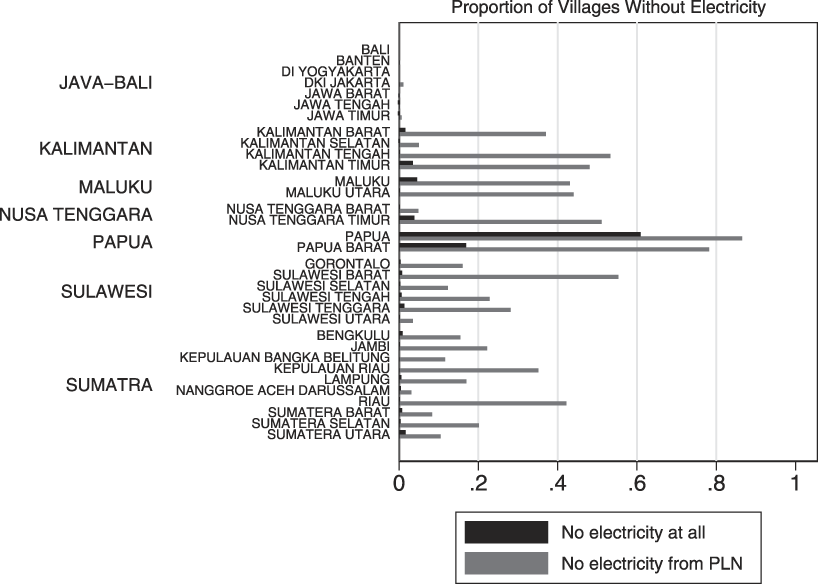
Figure 2 neatly summarizes the distinctiveness of electrification in these two provinces using data from the 2011 Village Potential Survey, or PODES. Footnote 29 Conducted at three-year intervals by Indonesia’s Central Statistical Agency, PODES contains detailed information and social, economic, and political conditions in each of Indonesia’s almost 80,000 villages. The figure shows the proportion of the villages in each province without access to electricity (black) and without access to electricity provided by PLN (gray).
Electrification by province in Indonesia (2011)
Notes: This figure, based on the 2011 Village Potential Survey in Indonesia, shows the proportion of the villages in each province without access to electricity (black) and without access to electricity as provided by the state-owned energy company Perusahaan Listrik Negara (PLN), shown in gray. Provinces are grouped by the island-group in which they are located.

The differences between the two provinces in Papua and the rest of the archipelago are immediately apparent. Not only are a greater proportion of villages in Papua and West Papua provinces unable to access electricity from PLN, a far greater proportion of villages in these two provinces are also unable to access electricity from other sources (which may include generators, illegal tapping from the electrical grid or from nearby enterprises, and others).
This province-level heterogeneity may have substantial implications for understanding village-level provision of public goods. Returning to the question outlined above, one possible explanation for differences in electrification across villages is simply village fundamentals: larger, less remote, and more urban Footnote 30 villages should each be more likely to receive electricity from PLN. To the extent that these are more common in Papua and West Papua provinces—a remote, historically rural, and sparsely populated region—this may explain why these two provinces suffer so greatly from infrastructural underdevelopment.
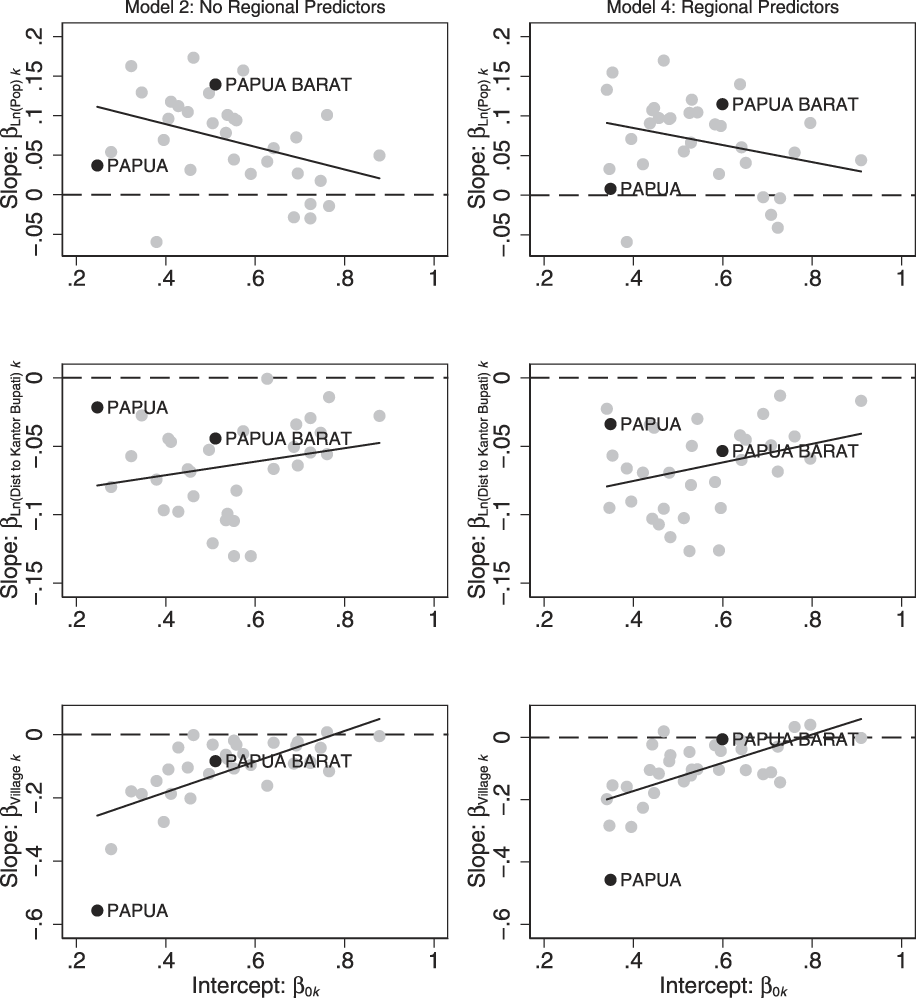
In figure 3, I show the results of two regression models that predict village-level electricity access as a function of village- and province-level characteristics such as village population, distance in kilometers from the village to the office of the district head (a measure of village remoteness), and a dummy variable capturing whether the village is rural or urban (desa or kelurahan). Descriptions of the models and the data appear in the online appendix to this article. To illustrate the substantive results, I plot the estimated relationship between each independent variable and the proportion of the villages with access to electricity from PLN, and the estimated proportion of households within a typical village in each province with electricity.
Village characteristics and electrification by Indonesian Provinces (2011)
Notes: Each graph plots the empirical Bayes estimates of the random slopes and intercepts for village population, distance to village head’s office (kantor bupati), and the rural dummy as estimated from two multilevel regression models (data available upon request from the author; full models appear in the online appendix). Papua and West Papua are highlighted in black.

In provinces with high penetration of PLN, there is only a weak relationship between village population and electrification. In provinces with low PLN penetration, however, there is a stronger relationship, which is consistent with an account of public goods provision where larger villages are first to receive public goods (net of other determinants of village electrification) in regions where public goods remain scarce. Yet Papua province has both a low level of electricity penetration and a weak relationship between village population and access to electricity. Interestingly, West Papua province does not stand out in the same way; the relationship between electricity provision and village population is indistinguishable from that of other provinces with similar average levels of state-provided electricity. The same is true for the second and third graphs in the first column of figure 3. Most striking is the bottom left-hand graph, which shows that rural villages in Papua province (but again, not in West Papua provinces) have far less access to electricity than others.
The second column of figure 3 models the heterogeneity across provinces using two additional provincial-level variables. The distance between a provincial capital and Jakarta is a measure of a province’s remoteness, capturing the intuition that Papuan villages have low levels of electrification because they are remote villages in a remote province. Second, the percentage of majority Muslim villages in each province might also explain why Papua, a majority non-Muslim province, features such low electrification (although high electrification rates in other non-Muslim provinces suggest that this is not the case). In this way, these test the propositions that Papua province is different because it is distant or Christian.
Looking to the top right graph in figure 3, we indeed see a weaker correlation between provincial slopes and intercepts when accounting for observable differences in provincial remoteness and provincial religious composition. Yet this model does not overturn the previous finding that rural villages are much less likely to have access to state-provided electricity in Papua province than in the rest of Indonesia.
These findings have substantial political implications for Indonesians, and for citizens of Papua. They reveal that, much as Papuan independence activists have long charged, the region lags systematically in the provision of key infrastructure. The analysis also reveals that the source of rural Papua’s infrastructural development is distinct, more than can be captured by a model of infrastructural provision that explains the rest of the country well. There is something different about infrastructure in Papua, something more than subnational comparisons alone can explain.
Identity, Insurgency, and Secessionism
The next illustration of regions of exception in Southeast Asia focuses on the broad question of identity, insurgency, and secessionism in multiethnic societies. Subnational comparative designs are particularly well suited for studying civil conflict, which almost always is characterized by marked spatial variation within countries. Footnote 31 The approach in this section is primarily qualitative, with a focus on explaining regional variation in the presence of insurgent secessionist violence in the six major states of Southeast Asia. In contrast to the discussion of rural electrification in Indonesia, the discussion in this section highlights the difficulty of using focused within-country qualitative comparisons to study the determinants of insurgency and secessionism—which is in most cases so rare that it renders subnational research designs indeterminate. For obvious reasons, understanding why some regions demand independence and others do not is of critical importance for understanding state strength and contemporary political order across the region.
Note first that five of the six countries have at least one region with a history of secessionism. In Indonesia, both Aceh (prior to 2005) and Papua and West Papua (ongoing) have seen armed insurgencies. In Myanmar, low-level insurgencies have erupted in each of the seven ethnic states. The southern regions of the Philippines, on the island of Mindanao and neighboring islands in the Sulu Sea, insurgents have sought to create an independent state for the Muslim Moro ethnic group since the late 1800s. In the southernmost provinces of Thailand, another ethnoreligious insurgency has been ongoing for decades. The Republic of Vietnam was an attempt to create an independent non-communist state in the southern portion of present-day Vietnam. Only Malaysia has avoided a regionally-based insurgency movement since independence.
Each of the six Southeast Asian states is a diverse modernizing society whose contemporary borders are the product of colonialism, which leads to the natural question of why only some regions have experienced secessionism and armed insurgency. In Myanmar the answer is straightforward: secessionists emerge in the ethnic states but not in the Burmese-majority regions that cluster around the center of the state’s territory around the Irrawaddy river. Footnote 32 In the other country cases, however, such easily observable patterns cannot be uncovered.
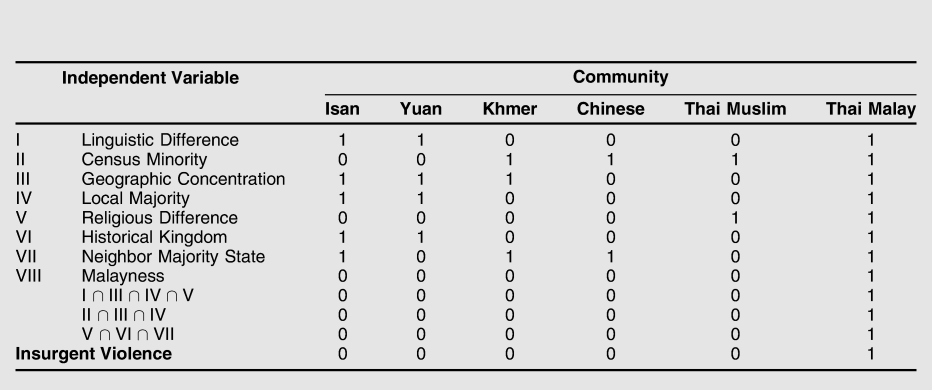
The case of Thailand illustrates the problem well (refer to table 2). While the Thai nationality has proven remarkably adaptive to ethnic groups such as Yuan (Northern Thai), Isan (Northeast Thai), Thai Chinese, and Khmer, the same is not true of the Malays of southern Thailand, and only in southern Thailand is there any history of violence and insurgency. Footnote 33 Why? Thai Malays are ethnically distinct, but so too are Isan, Yuan, and Thai Chinese—their “Thainess” is a political construction, Footnote 34 and one which remains an ongoing project for Thai Malays and Khmers as well. Thai Malays are geographically concentrated in the far south of Thailand, but so too are the Isan and Khmer in the northeast and Yuan in the north. Thai Malays are the majority ethnic group in three provinces, but so too are the Isan and Yuan in their respective territories. Thai Malays can look back to a powerful historical kingdom whose territory is divided across contemporary state borders (Pattani), but so too can the Isan and Yuan (Lan Xang and Lanna, respectively). Thai Malays can look across a close national border to a state in which a closely related ethnic group forms a majority (Malaysia), but so too can Isan and Khmer (Laos and Cambodia, respectively). Thai Malays are Muslims, and therefore a religious minority vis-à-vis the overwhelmingly Theravada Buddhist state, yet there are substantial numbers of Thai Muslims as well. Not only are Thai Muslims’ patriotism and their status as members of the Thai nation generally unquestioned—the leader of the tacitly palace-approved 2006 coup is a Thai Muslim—there is no history of insurgent violence by Thai Muslims, or any evidence of common cause between Thai Muslims and Malay Muslims as insurgents.
Roots of insurgency in Pattani

This is an indeterminate research design: there are more plausible causes of identity-based insurgency and secessionism in Thailand than there are cases of identity-based insurgency in Thailand, and monocausal explanations fail to account even for this variation. It is plausible that a complex interactive account of some subset of these variables could explain the Thai Malay insurgency, but it is also possible that particular features of the Malay identity itself, and of the Thai state’s relationship to that identity, explain insurgent violence in Pattani and its absence elsewhere. Such claims are theoretically coherent and analytically precise, and underlie compelling analyses such as that by Duncan McCargo. Footnote 35 Yet they are not distinguishable from their competitors using the subnational comparative method.
The Muslim insurgency in the southern Philippines parallels that of Pattani in its inferential challenges. As in the case of Thai Malays, a “Moro identity” captures the interaction of local ethnic identities, Islam, accumulated historical grievances dating back to the period of Spanish colonialism, and postcolonial policies targeting the south for migration from other regions of the Philippines. Yet such an account, while both plausible and coherent, is also indeterminate using the subnational comparative method.
Insurgency and secessionism in Indonesia likewise defy simple comparative explanation. Only three regions in a phenomenally diverse country have had active regionally-based secessionist movements since independence. The successful case of Timor Leste was perhaps the signature example of a region of exception when it was still a province of Indonesia: a former Portuguese colony invaded by Indonesia in 1974, predominantly Catholic in a Muslim-majority country, a prominent mestiço political and social elite with ties to metropolitan Portugal, and in a far-off corner of the Lesser Sunda islands. Among the unsuccessful cases, though, Aceh is Muslim while Papua and West Papua are predominantly Christian. Both have experienced substantial in-migration from Java, but this is common in many parts of Sumatra, Sulawesi, Indonesian Borneo, and other regions. Each lies at the end of a sprawling archipelago, but the capital city of Banda Aceh is no more difficult to access than are the major cities in eastern Indonesia. The most compelling comparative analyses of nationalist mobilization in Indonesia do not explain the existence of secessionism, they explain the processes, mechanisms, and dynamics through which mobilization and conflict unfold. Footnote 36 The most careful analyses of the causes of secessionism in one region present complex interactive explanations. Footnote 37
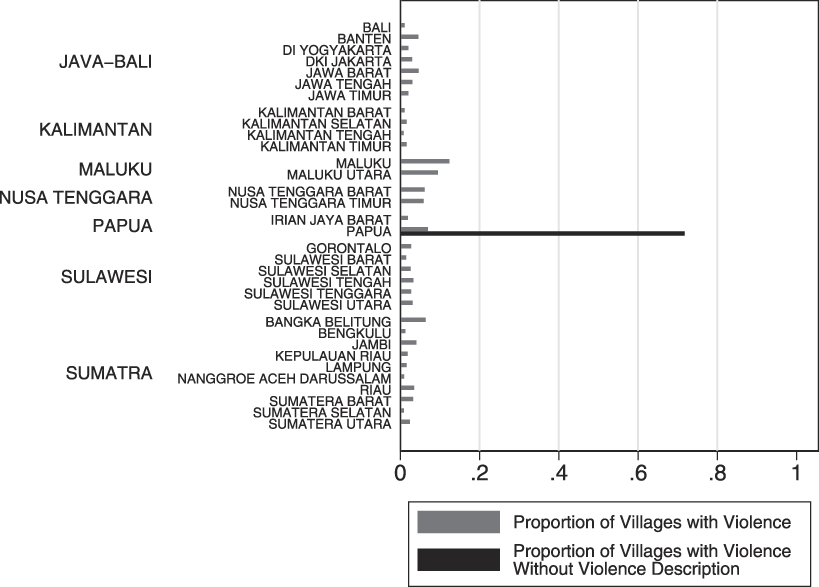
Indonesia is also a rich environment for quantitative studies of local conflict, Footnote 38 both because of the remarkably detailed longitudinal data on local violence and its spatial variation. Yet Indonesia also illustrates how nonignorable missingness can plague quantitative subnational comparative designs. Figure 4 summarizes local violence by province, and also contains information about the extent to which the nature of the violence went unrecorded in the 2008 round of PODES.
Violence by Province in Indonesia (2008)
Notes: This figure, based on the 2008 Village Potential Survey in Indonesia, shows the proportion of the villages in each province experiencing some sort of local violence (gray). It also shows the proportion of those incidents of violence for which data on the type of violence and its severity is not recorded (black). Provinces are grouped by the island-group in which they are located.

A substantial portion of violent incidents in Papua are recorded, but not described using the standard classification scheme: intravillage violence, intervillage violence, violence against security forces, violence against the government, student violence, ethnic violence, and other. It is not clear if the data is missing because it was not collected, not reported, not recorded, or not published. In any case, one obvious reason why is that such violence corresponds to actions by Organization for Papuan Independence (Organisasi Papua Merdeka, OPM), or to irregular actions by others who reject Indonesia’s presence in Papua. To the extent to which the goal of a subnational analysis of violence in Indonesia is to explain violence against the government or security forces, its existence in Papua goes unmeasured, and precisely because of what the data might show. This conclusion has particularly important implications for the study of conflict, for it suggests that it is precisely those places where conflict is most severe, and politically contentious, that it will be understudied.
Ethnic Voting
The final illustration of how regions of exception are rendered illegible is ethnic voting. I begin by returning to the running example of Sabah and Sarawak, and analyze ethnicity and voting patterns in the 2013 Malaysian General Election. Even though Sabah and Sarawak were essential to the BN’s ability to retain power in 2013, prominent subnational comparative studies of ethnicity and voting in the 2013 omit these two states entirely. Footnote 39
The most salient divisions in Malaysian politics are between bumiputeras (sons of the soil) and non-bumiputeras. Bumiputeras are the country’s “indigenous” inhabitants, Footnote 40 while non-bumiputeras include the substantial proportion of Malaysians of Chinese and Indian descent—the latter comprising approximately 30% and 10% of Malaysia’s population, respectively. The incumbent Barisan Nasional (BN) coalition is comprised of a Malay party (UMNO), a Chinese party (MCA), and an Indian party (MIC), each based in the Malay peninsula; two tiny multiethnic parties also rooted in the peninsula (Gerakan and PPP); and nearly a dozen multiethnic parties based exclusively in Sabah and Sarawak. The Malaysian constitution explicitly affords special rights to Malays, and pervasive affirmative action policies—beginning with the New Economic Policy (1971–1990) and continuing today—target bumiputeras for a wide range of subsidies and privileges. UMNO, by far the largest party in the BN, has maintained power virtually without contest since 1957 on the basis of consistent electoral support from bumiputera voters.
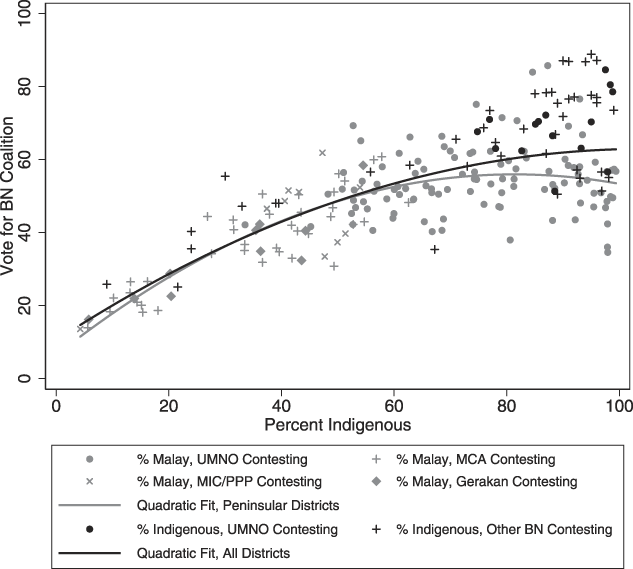
The 2013 General Election provides a window into the continuing relevance of ethnicity in Malaysian politics. Preliminary analyses have focused on competing drivers of vote choice, including urbanization, modernity, and post-communal political identities—as well as the distinct ethnic political landscape in East Malaysia which complicates any discussion of “the Malay vote” across all of Malaysia. Footnote 41 Figure 5 compares BN vote share by the percentage of an electoral district’s population that is bumiputera.
Incumbent vote share by region and party (2013)
Notes: Each graph plots the percent vote share going to incumbent Barisan Nasional coalition in the 2013 Malaysian general elections. The gray points correspond to electoral districts in peninsular Malaysia, and the black points correspond to electoral districts in Sabah and Sarawak. The x-axis measures the percent of the population that is “indigenous” in the local context. In peninsular Malaysia this corresponds to the percent Malay, and in Sabah and Sarawak this includes non-Malay bumiputeras as well.

The fit is tight, both with and without East Malaysia. This suggests that while East Malaysia is likely best understood as a region of exception for questions of money politics and patronage, it may actually not be a region of exception for understanding the relationship between indigenous identity and support for the BN. Footnote 42
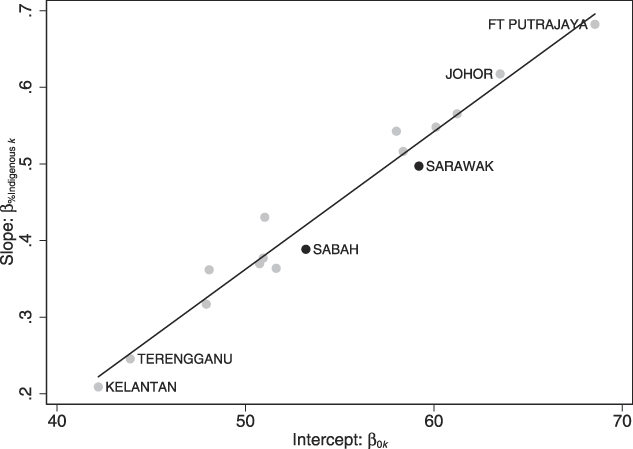
Following the strategy for detecting Papua as a region of exception, in figure 6 I plot the results of regression models that predict BN vote share as a function of BN population share by state; full models and results are available once again in the online appendix.
Ethnicity and BN vote share by Malaysian states (2013)
Notes: This graph plots the empirical Bayes estimates of the random slopes and intercepts for bumiputera population share by state or federal territory as estimated from multilevel regression models (data available upon request from the author; full models appear in the online appendix). Estimates for Sabah and Sarawak are highlighted in black.

The pattern is abundantly clear: in states where the average level of support for the BN is high, a larger bumiputera population per electoral district is associated with more support for the BN. Districts in East Malaysia return higher BN vote shares, but this is fully explained by their relatively large bumiputera population shares. Vis-à-vis other Malaysian states, the link between ethnicity and BN support in Sabah and Sarawak is entirely typical.
Even recognizing that the political, social, and historical in East Malaysia is altogether different than in peninsular Malaysia, this does not complicate the district level relationship between ethnicity and BN support in 2013. In fact, this analysis reveals that the regions of exception are actually Kelantan and Terengganu, two rural, overwhelmingly Malay, and economically backward peninsular states that are the stronghold of Malaysia’s Islamist opposition. I do not address the determinants of these peninsular states’ distinctiveness here, but rather emphasize that the Sabah and Sarawak examples illustrate how standard statistical tools can—in some occasions, and for some causal questions—fully account for the challenges that potential regions of exception present.
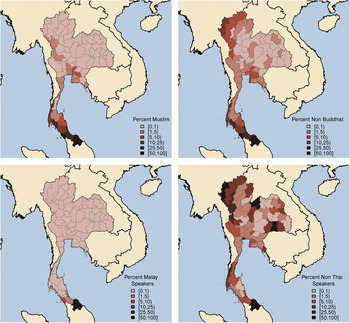
The same is not true in the case of ethnic voting in Thailand. The Thai census does not record ethnicity, but it does record religion and minority-language use. The versions of Thai spoken among Yuan and Isan in northern and northeastern Thailand differ from standard Thai, but are not counted separately, whereas Pattani Malay, Khmer, and “hill tribe languages” are. This makes it possible to estimate the percentage of the population that is Malay using Malay language as a proxy, but it is impossible to estimate the percentage of the population that is Isan or Yuan using the same strategy. Figure 7 contains maps of Thai language and religion by province based on the 2010 Thai census.
Language and ethnicity in Thai census
Notes: This map shows Muslims, non-Buddhists, Malay speakers, and all speakers of languages other than Thai as a fraction of provincial population in the 2010 census. 2000 census figures were used for five provinces with missing data.

The predominance of Malays and Muslims in Thailand’s far south is immediately clear: we can identify minority-dominant regions in the south via official language statistics. The northern portions of Thailand show relatively large proportions of non-Thai speakers, but these reflect Shan, Karen, and other hill tribes. The northeast region shows smaller fractions of non-Thai speakers.
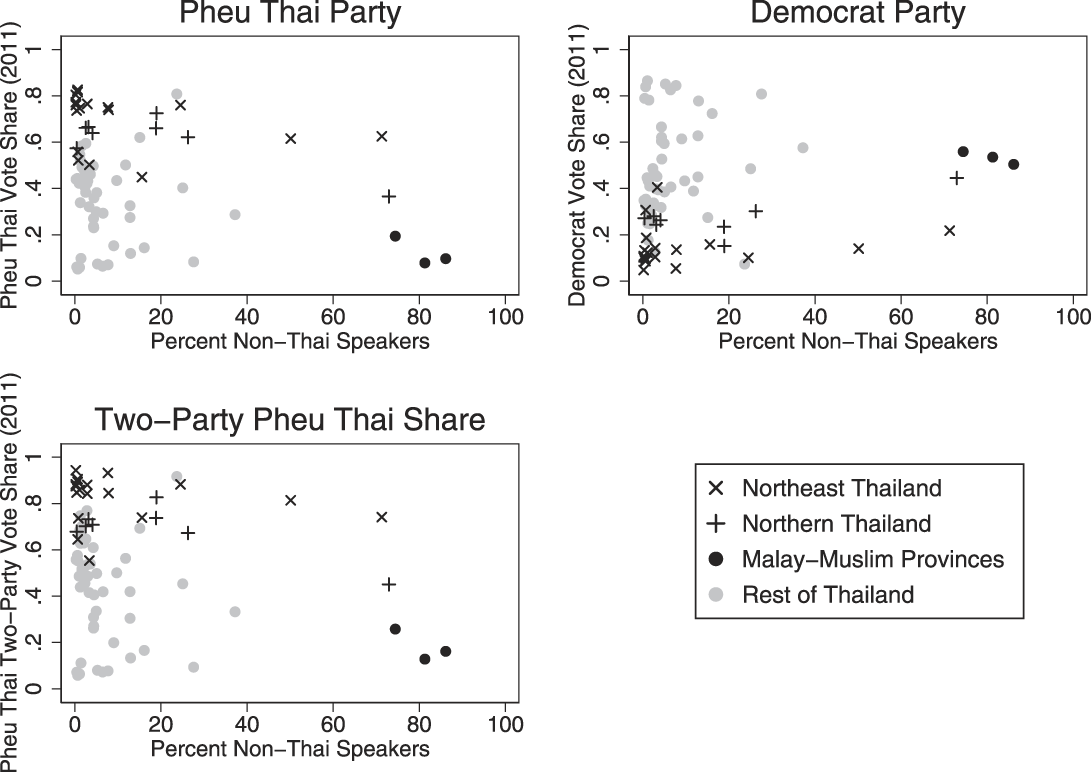
The consequence is that we can infer that the northern and northeastern regions of Thailand have relatively more Yuan and Isan, but not their distribution of these more numerous groups by province or electoral district, which is necessary for the ecological correlations shown in the Malaysian case. For example, we can compare provincial vote returns for the 2011 Thai general election and provincial-level data on language, as in figure 8.
Ethnicity and vote share in Thailand
Notes: These figures compare the percentage of each province speaking a language other than Thai and the vote share for Pheu Thai and Democrat Parties in Thailand’s 2011 parliamentary election.

The results show overwhelming support for Pheu Thai in provinces in the northeast, but as the census data do not distinguish Isan from Thai, we cannot determine what percentage of those provinces are Isan rather than Thai (as we can easily do for the Malay-Muslim provinces). Moreover, these results conflate ethnicity with other determinants of Pheu Thai support such as urban/rural cleavages and relative poverty, all of which varies by province as well. For this reason, the absence of subnational data on basic measures of ethnicity substantially complicates the subnational comparative method for studying ethnic voting in Thailand. It is for this reason that many analyses of Thai politics literally cannot “see” ethnic voting in Thailand, for Yuan and Isan identities are deliberately erased from national population statistics. Such issues also affect survey-based research, in which questions of “Thai-ness” are politically sensitive—and thus subject to biased measurement—precisely because of what they might reveal about a socially meaningful but potentially political consequential identity category.
Conclusion: Tensions, Solutions, Alternatives
The subnational turn in comparative and international politics holds the great promise of bringing scholarship in political science in direct conversation with the very kinds of subnational politics that cross-national comparative research has missed, and which are critical for understanding both regional and national politics. Yet challenges remain, as I have argued in this article. “Scaling down” for purposes of strengthening causal inference—one of the central arguments behind this renewed subnational turn in political science—may prevent scholars from being able to engage with the very subnational political phenomena that are most important for engaged scholars to understand.
The implications of this argument are both methodological and substantive. Consider the methodological issues first. My central point is that scholars of subnational politics must take greater care in understanding how the inferential tools they use constrain what they are actually studying. Here, understanding the link between theory, context, and method is essential. For example, if the main inferential challenge posted by a region of exception is unobserved heterogeneity in a regression analysis, then standard best practices—region fixed effects—already suffice. However, as discussed above in the case of rural electrification in Papua, fixed effects come at the expense of the goal of conceptualizing social systems in nomothetic terms. If we hew to Przeworski and Teune’s template for comparative inquiry, or Gary King’s directive to “attempt to demonstrate that context makes no difference whatsoever,” Footnote 43 we must recognize that simply accounting for unobserved heterogeneity entails abandoning that goal. Multilevel modeling provides one way to model that heterogeneity, but it relies on observables, and provides little additional insights when regional predictors are collinear or rare, yielding an indeterminate research design no matter how many observations are in the dataset. The general point from this example is that strategies to solve problems of causal inference change what is being studied.
Unit heterogeneity, small-n problems, complex interactive causality, and nonignorable missingness present more substantial problems. Each creates a barrier to causal inference using comparative methods that may be insurmountable: within-country comparisons may simply not feature enough observations, variation, or complete enough data to allow inferential leverage on particular causal questions.
There are three solutions for these problems, but each raises its own issues. One is to redefine the population of interest in a way that excludes the region of exception: Indonesia except for Papua province, or Vietnam except for the South. The problem that this raises is a form of selection bias, Footnote 44 as redefining the population in this way is transparently a post-hoc adjustment. The second solution is to “increase the n” by adding additional countries into the sample—this, however, sacrifices the within-country comparability that the subnational comparative method promises, requiring further assumptions about unit heterogeneity across countries that may not be palatable.
The third solution is to pair subnational comparative methods with some other inferential method, such as process tracing. Footnote 45 Doing so, however, requires a broader view of causal inference than the potential-outcomes framework provides. Another solution is to employ case analysis for different purposes: exploratory, descriptive, conceptual, or interpretive. Here, the goal of careful analysis of subnational regions is different: hypothesis generation, understanding, even empathy. It is important to note, however, that even embracing alternatives to mainstream causal inferential techniques, or abandoning the goal of causal inference altogether, may not solve the problems that regions of exception raise. A researcher seeking to use qualitative field techniques even just to describe violence in Papua will quickly find that the same restrictions on data availability that generate missing data in PODES 2008 also prevent him or her from gaining a close understanding “on the ground” of violence too.
How, then, should researchers proceed? In the online appendix I describe a checklist of procedures for scholars wishing to pursue subnational comparative research for the purpose of causal inference: reflect, theorize, model, and adjust. Here, I conclude by advocating for greater attention to the other tasks to which subnational comparative research may be suited: description, exploration, interpretation, and conceptual development.
This is not a standard argument for methodological pluralism in new garb. As I have argued throughout this article, the challenges that regions of exception present are common to qualitative and quantitative research. My argument, instead, is the politics of regions of exception may be rendered more legible by changing the research enterprise from nomothetic causal explanation to ideographic causal discovery. This may happen in many different ways. Interpretivist research may seek to characterize how elites or citizens conceptualize political problems such as violence or identity in regions that are characterized by unusual levels of conflict or particular ethnic or religious structures. Descriptive research may build complex accounts of how public goods come to be underprovided in particular reasons, often using process tracing methods, or logics of contingency or configurational causation to explain what appear to be anomalous cases. Footnote 46 Description and interpretation are no less dependent on theory than is hypothesis testing or cross-case causal inference. As John Gerring argues, description comprises a different kind of research enterprise than causal inference, Footnote 47 but is it no less valuable for understanding politics. A similar case may be made for interpretive and other kinds of inquiry, or for theories of causality that eschew the potential outcomes or related frameworks.
Although examples of secessionism in Thailand and Indonesia listed earlier suggest that scholars must seek alternatives to subnational comparative methods for causal inference, it is also possible that comparative methods for causal inference may complement these alternative uses of subnational analysis. Robert Mickey’s Paths Out of Dixie provides on example of how the different kinds of subnational analysis can work together. Footnote 48 The premise of the book is that the American South is different. But within the South, Mickey uses a standard small-n comparative design to chart different modes of democratization across Southern states. The book thus marries a contextually sensitive recognition of the South as a region of exception in the United States with new conceptual tools for understanding subnational democratization and a cross-case qualitative analysis of four different causal pathways. It is an example of how subnational comparative analysis can achieve several different research goals at once.
I conclude by considering the substantive implications of my argument. As I argued in the introduction, comparative methods for causal inference will lead political scientists to dismiss regions of exception as irrelevant or deviant because they cannot fit neatly within a nomothetic conception of causal explanation. I hold that regions of exception are especially interesting precisely because they are otherwise illegible. Ignoring them means ignoring what may be some of the most urgent political problems today—pockets of authoritarianism that operate outside of the regular democratic political order, regions where states do not try to build strength, subversive forms of ethnic politics, complex local histories of violence and resistance. Taking these exceptional regions seriously allows political scientists to address these otherwise hidden or forgotten sites of politics. Mickey’s Paths Out of Dixie does that for authoritarianism in US South. McCargo’s Tearing Apart the Land does the same for the insurgency in southern Thailand. Other regions of exception hold similar promise.
Supplementary Material
-
Modeling Village Electrification in Indonesia
-
Table A1. Determinants of Village Electrification (2011)
-
Modeling Support for Malaysia’s BN
-
Table A2. Determinants of BN Vote (2013)
-
Reflect, Theorize, Model, and Adjust: A Checklist