Bloodstream infections (BSI) are a major healthcare issue with a disease burden comparable with that caused by myocardial infarction, trauma, and major strokes.Reference Laupland, Gregson, Flemons, Hawkins, Ross and Church 1 BSI represent a significant cause of mortality worldwide,Reference Pien, Sundaram and Raoof 2 leading to approximately 157,000 deaths per year in Northern Europe and more than 79,000 deaths per year in North America.Reference Goto and Al-Hasan 3
Demographic changes and advances in medical technology have changed the epidemiology of BSI in recent decades, and resulted in a shift in the pathogen spectrum. Although gram-positive bacteria were the predominant agents in BSI from 1987–2000,Reference Martin, Mannino, Eaton and Moss 4 gram-negative bacteria have constantly increased since then, with Escherichia coli reemerging as the most prevalent pathogen.Reference Wilson, Elgohari and Livermore 5 Because changes in the spectrum and antimicrobial resistance patterns have a direct impact on the choice of empirical antimicrobial therapy, experts have recommended that the epidemiology of BSI be reassessed periodically on a national scale. 6 Hence, the assessment of this evolution in Switzerland was the primary goal of the study.
Moreover, since 2002 a new category of healthcare-associated bloodstream infection has been introducedReference Friedman, Kaye and Stout 7 and validated that distinguishes between “true” community-acquired (CA) infections and those with previous healthcare exposure.Reference Pien, Sundaram and Raoof 2 , Reference Valles, Calbo and Anoro 8 However, the distinction between BSI encountered in university hospitals (UH) versus community hospitals (CH) has garnered less attention.Reference Rodriguez-Bano, Lopez-Prieto and Portillo 9 – Reference Elhanan, Raz and Pitlik 11
We hypothesized that the epidemiology of BSI differs markedly between UH and CH when analyzed on a national scale. A study specifically addressing these differences therefore provides valuable additional insights into recent trends and patterns of BSI. With the present study we intended to elucidate the epidemiology, etiology, and temporal changes of BSI episodes in CH and UH in Switzerland from 2008 through 2014.
METHODS
Design and Setting
We conducted a longitudinal, observational, retrospective, multicenter study on BSI in Switzerland from 2008 through 2014. Data on BSI were obtained from the national bloodstream infection surveillance database, which is part of the Swiss Centre for Antibiotic Resistance (ANRESIS). 12 Since 2004 the ANRESIS program has collected all routine microbiologic data from a representative group of microbiology laboratories located across Switzerland, with blood culture surveillance introduced in 2006. Each participating laboratory sends bacteremia results on a regular basis to a central database located at the Institute for Infectious Diseases in Bern, Switzerland. Most laboratories collect microbiologic data from different hospitals, including UH and CH from a wide geographic area covering the most densely populated regions.
A few major features differentiate UH from CH in Switzerland. UH perform specific and difficult surgical interventions (eg, cardiac surgery, neurosurgery, and organ transplantation surgery) and manage difficult-to-treat patients that are often transferred from CH. Additionally, the number of beds in UH (>800 beds/hospital) is higher than in CH. CH are characterized by rather small intensive care units (ICU) but play an important role in the Swiss healthcare system by initially stabilizing septic patients and providing treatment for most cases. 13 , Reference De Pietro, Camenzind and Sturny 14
We restricted the dataset to acute care hospitals that continually reported at least 5 BSIs per year without fluctuations from 2008 through 2014. We obtained BSI data from 26 hospitals (Figure A, Supplementary Appendix); the number of acute beds from this sample of hospitals remained stable in relation to the Swiss population over the study period and represented 33.7 % of the acute care beds in Switzerland in 2014. 13 Two hospitals merged in 2011 and were analyzed as 1 hospital throughout the entire study period.
Definitions
We considered only positive blood cultures in the analysis; cultures from intravascular tips were interpreted as blood cultures. Organisms were isolated and speciated according to the Clinical Laboratory Standards Institute guidelines. 15 Positive cultures were grouped as a BSI episode if they occurred within a 7-day window in the same patient. If another set of cultures was obtained more than 7 days after the most recent positive blood culture result, it was considered a separate episode.
Contaminant episodes were excluded from the analysis, being defined as episodes including only 1 positive culture of a typical contaminant (namely coagulase-negative staphylococci [CoNS], anaerobes such as Bacillus spp., Corynebacterium spp., Propionibacterium spp., oral streptococci, and others [see Supplementary Appendix]). If the same contaminant occurred at least twice (specifically, from 2 blood cultures or from a catheter tip and 1 blood culture) in a 7-day window, the episode was considered to be a true BSI. A BSI was defined as polymicrobial if different microbial species were isolated from 1 or more cultures within the same episode.
The following pathogen categories were selected for more detailed analysis: Staphylococcus aureus, CoNS, Enterococcus spp., E. coli, Enterobacteriaceae other than E. coli, gram-negative nonfermenters, anaerobes, polymicrobial infection, fungi, and “others.” Descriptive statistics were used to compare pathogen prevalence over time. The analyses were stratified by gender, age groups, linguistic region (ie, Southwest vs Northeast), season (winter, defined as October 1 to March 30, vs summer), hospital type (CH vs UH), hospital department (outpatient department, ICU, general wards), and year of detection (2008 to 2014). Patterns and temporal trends were calculated for the 4 major microorganism groups (E. coli, S. aureus, CoNS, and polymicrobial). BSI for which the hospitalization date was available were grouped into hospital-acquired (HA; positive blood culture >2 days after admission) and CA. Both HA and CA BSI were further differentiated into infections occurring in CH and UH.
Statistical Analysis
Group comparisons were performed using the χ2 test.Reference Vollset 16 The Bonferroni correction was used to correct for multiple comparisons on a family-wise basis, where appropriate. A critical P value for testing at the 5% level of significance was accordingly set at .005 for tests, otherwise at the level of .05. For linear time trends, tests of significant difference between the gradients of regression curves were based on standard analysis of variance techniques. All analyses were conducted with the statistical package R (R Foundation for Statistical Computing). 17
RESULTS
Etiology of BSIs
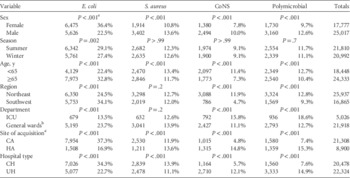
From 2008 through 2014, a total of 57,544 BSI episodes were identified after considering 118,224 individual positive blood cultures. Of these, 42,802 episodes (74.4%) were classified as true infections. Most of the 14,742 contaminant episodes were from CoNS (79.3%, 11,696). Fifty-eight percent ( Reference Mostofsky, Lipsitch and Regev-Yochay 25 , 017 ) of BSIs occurred in male patients, more than half (57%) of episodes occurred in people at least 65 years of age, and 52% were detected in UH (Table 1).
Epidemiology of 42,802 BSIs in Switzerland, 2008–2014

NOTE. Data are no. (%) of microorganisms unless otherwise indicated. BSI, bloodstream infection; CA, community-acquired; CH, community hospital; CoNS, coagulase-negative staphylococci; E. coli, Escherichia coli; HA, hospital-acquired; ICU, intensive care unit; S. aureus, Staphylococcus aureus; UH, university hospital.
a χ2 test on equal proportions, adjusted for column marginal totals, Bonferroni corrected.
b General wards excluding outpatients.
c Acquisition: Excluding 29% of BSIs that were not attributable to either category.
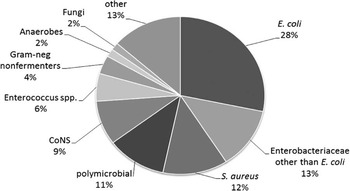
E. coli was the most frequent agent (28%), followed by Enterobacteriaceae other than E. coli (13%) and S. aureus (12%). Polymicrobial BSIs accounted for 11% of all episodes (Figure 1). A review of the following 4 microorganism (E. coli, S. aureus, CoNS, polymicrobial) groups is provided in Table 1.
Distribution of microorganisms encountered in bloodstream infections, Switzerland, 2008-2014. E. coli, Escherichia coli; CoNS, coagulase-negative staphylococci; S. aureus, Staphylococcus aureus.

E. coli was more prevalent in females than males (36% vs 23%, P<.001) and in older patients (33% in >65 years vs 22% in 15-45-year-olds, P<.001). E. coli was more common during summertime (29% vs 27%, P=.002), in general wards (24% vs 14%, P<.001), and in Southwest Switzerland (34% vs 25%, P<.001). Furthermore, E. coli was more frequently detected in CA vs HA episodes (37% vs 17%, P<.001), and in CH compared with UH (34% vs 23%, P<.001).
S. aureus was found to be more common in male patients (14% vs 11%, P<.001) and among patients aged at least 65 years. However, there were no significant seasonal or regional differences, and no differences between ICU and general wards. S. aureus was more frequently detected in HA episodes (14% vs 12%, P<.001) and in CH (14% vs 11%, P<.001).
CoNS occurred more frequently in males (10% vs 8%, P<.001), in patients younger than 65 years (11% vs 7%, P<.001), and in the Northeast region (12% vs 5%, P<.001). In addition, ICU departments (16% vs 11%, P<.001), hospital acquisition (15% vs 5%, P<.001), and UH (12% vs 6%, P<.001) were associated with a higher proportion of CoNS BSIs.
Polymicrobial BSIs were more common in male patients (13% vs 10%, P<.001), Northeast Switzerland (13% vs 9%, P<.001), ICU departments (19% vs 13%, P<.001), in HA episodes (15% vs 7.4%, P<.001), and in UH (15% vs 8%, P<.001).
Pattern of Microorganisms by Site of Acquisition and Hospital Type
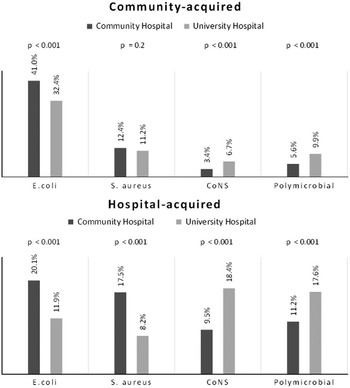
The following analyses were restricted to 30,208 episodes (70.6%) with known hospitalization date. Of these, 21,308 (70.5%) were CA-BSI. Among CA-BSIs, CH-onset BSIs were more frequent in those more than 65 years of age (64% vs 55%, P<.001), and in non-ICU departments (85% vs 79%, P=.002). Moreover, E. coli was observed more often in CH, whereas polymicrobial BSIs and CoNS were more frequent in the university setting (Figure 2).
Proportion (%) of Escherichia coli, Staphylococcus aureus, coagulase-negative staphylococci (CoNS), and polymicrobial sources in community-acquired (top) and hospital-acquired (bottom) bloodstream infections, Switzerland 2008–2014.

For HA infections, the proportion of elderly patients was greater in CH-onset BSIs (60%) vs in UH-onset BSIs (47%) (P<.001). There was a similar picture with E. coli and S. aureus being more frequent in CH, whereas UH saw more CoNS and polymicrobial BSI (Figure 2). Focusing on larger CH (>500 beds), we found the same patterns as in the CH group as a whole (data not shown).
Time Trends 2008 Through 2014
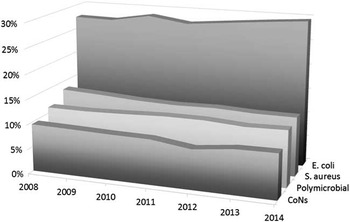
The annual total of reported episodes increased over time from 5,754 in 2008 to 6,694 in 2014. In terms of microorganisms, the proportion of E. coli BSI increased from 1,582 (28%) in 2008 to 1,978 (30%) in 2014 (P=.04), whereas there was a decreasing trend in the proportion of S. aureus from 765 (13%) to 803 (12%) during the same period (P=.05; Figure 3).
Trends of Escherichia coli, Staphylococcus aureus, polymicrobial sources, and coagulase-negative staphylococci (CoNS) in bloodstream infections, Switzerland 2008–2014.

Trends by Site of Acquisition and Hospital Type
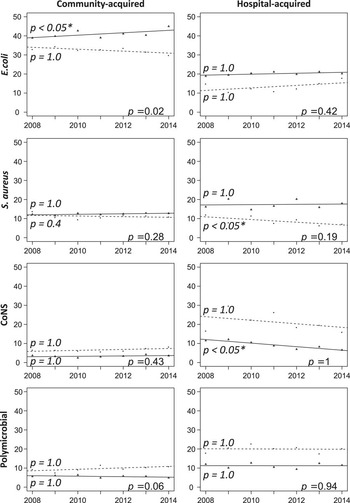
No increase in the identification of the site of acquisition was detected over the study period. As noted previously, E. coli was more prevalent in CA infections and even more so in CH. Moreover, in the CH setting, the trend increased over time from a prevalence of 39% in 2008 to 45% in 2014 (P=.05), differing significantly from the stable prevalence encountered in CA E. coli infections in UH (33% in 2008 vs 30% in 2014, P=.16, P for divergence=.02; Figure 4). For HA infections, we observed a stable proportion of E. coli in both CH and UH. Moreover, we observed a significant decrease for HA S. aureus BSI in UH (12% in 2008 vs 7.1% in 2014, P=0.04) and for HA CoNS in CH (12% in 2008 vs 6.6% in 2014, P=.04). Trends for other microorganism groups are shown in Figure 4.
Trends in community hospitals and university hospitals by site of acquisition for Escherichia coli, Staphylococcus aureus, coagulase-negative staphylococci (CoNS), and polymicrobial bloodstream infections. Linear regression denoted by solid line for community hospitals, and by dotted line for university hospitals. P values on the regression lines pertain to the gradient, those at the bottom right refer to the divergence of these lines. Asterisks indicate a significant effect at the 5% level.

DISCUSSION
To our knowledge, this is the first report on the national bacteremia surveillance in Switzerland. Including approximately one-third of BSIs nationwide, the database can be considered as representative for the entire country. In addition, given the geographic location at the crossroads of Europe, our findings may be useful for benchmarking purposes with other European countries. The analysis incorporated data on 9 microorganism groups from 26 hospitals reporting data consistently, comprising both CH and UH, and included 7 years of data.
As in other countries, E. coli was the predominant cause of BSI.Reference Wilson, Elgohari and Livermore 5 , Reference Skogberg, Lyytikainen, Ollgren, Nuorti and Ruutu 18 E. coli, which is usually considered as a pathogen acquired in the community, was also the most common cause of HA-BSI and the most detected across all hospital disciplines. The increasing trend in bacteremia caused by E. coli until 2014 is noteworthy and consistent with European trends, as reported by de Kraker et alReference de Kraker, Jarlier, Monen, Heuer, van de Sande and Grundmann 19 and others.Reference Wilson, Elgohari and Livermore 5 One possible explanation for this trend is the earlier discharge of patients to the community (reflected in a decreasing average length-of-stay over the study period 13 ), where they are at greater risk of developing E. coli BSI.Reference van der Mee-Marquet, Blanc and Gbaguidi-Haore 20 , Reference Hoenigl, Wagner and Raggam 21 Furthermore, the increase in bacteremia due to E. coli should be considered particularly alarming because third-generation cephalosporin resistance among E. coli is increasing in SwitzerlandReference Kronenberg, Hilty, Endimiani and Muhlemann 22 and surrounding countries. 6
Consistent with the findings of most population-based studies, S. aureus was the second most frequent pathogen identified.Reference Skogberg, Lyytikainen, Ollgren, Nuorti and Ruutu 18 , Reference Laupland 23 In most European countries, decreasing incidences of S. aureus BSI have been described up to 2008,Reference Wilson, Elgohari and Livermore 5 , Reference de Kraker, Jarlier, Monen, Heuer, van de Sande and Grundmann 19 , Reference Nielsen, Pedersen, Jensen, Gradel, Kolmos and Lassen 24 whereas more recent data are not yet available. Our study confirmed this ongoing trend for Switzerland, including the years up to 2014. In some European countries this decrease could be explained by a decline in methicillin-resistant S. aureus infections, and may be the result of national initiatives aimed at reducing such infections.Reference Wilson, Elgohari and Livermore 5 , 6 , Reference Mostofsky, Lipsitch and Regev-Yochay 25 , Reference Eggimann and Pittet 26 In addition, improving standards in hospital infection prevention may concurrently have led to fewer methicillin-susceptible S. aureus bacteremias.Reference David, Daum and Bayer 27
Polymicrobial BSIs are of particular concern because they are often associated with increased mortality.Reference Skogberg, Lyytikainen, Ollgren, Nuorti and Ruutu 18 , Reference Pavlaki, Drimousis and Adamis 28 However, the lack of a generally accepted definition for what constitutes polymicrobial complicates the evaluation of patterns and trends of polymicrobial BSI. Most authors define polymicrobial as being a sequence of episodes of bacteremia occurring within a time frame varying between 24 hours and 1 week.Reference Pien, Sundaram and Raoof 2 , Reference Skogberg, Lyytikainen, Ollgren, Nuorti and Ruutu 18 , Reference Luzzaro, Ortisi, Larosa, Drago, Brigante and Gesu 29 – Reference Bouza, Burillo, Munoz, Guinea, Marin and Rodriguez-Creixems 31 In contrast, Chowers et alReference Chowers, Gottesman, Paul, Weinberger, Pitlik and Leibovici 32 consider an episode as being polymicrobial if multiple microorganisms were isolated in the same patient within 1 month. In our study we considered an episode as being polymicrobial if multiple pathogens were isolated within 1 week. According to this definition 11.4% of all BSIs from 2008 through 2014 were polymicrobial, which is comparable to the observations of other studies relying on the same definition.Reference Lin, Lai and Chen 30 , Reference Bouza, Burillo, Munoz, Guinea, Marin and Rodriguez-Creixems 31 As expected, a higher frequency of polymicrobial BSI was detected in nosocomial BSI, in ICU and in UH,Reference Pavlaki, Drimousis and Adamis 28 , Reference Sancho, Artero, Zaragoza, Camarena, Gonzalez and Nogueira 33 with a stable proportion observed over the past 7 years.Reference Nielsen, Pedersen, Jensen, Gradel, Kolmos and Lassen 24 Of particular note, polymicrobial BSIs often include significant proportions of Enterococcus spp. and Pseudomonas spp.Reference Pavlaki, Drimousis and Adamis 28 , Reference Lin, Lai and Chen 30 , Reference Bouza, Burillo, Munoz, Guinea, Marin and Rodriguez-Creixems 31 and, consequently, standard empirical therapies in Switzerland (eg, amoxicillin/clavulanate or a third-generation cephalosporin) may not always be adequate.
To our knowledge, this is also the first nationwide study describing differences in BSI between CH and UH. Only few studies, with a limited number of hospitals, have performed a comparison between the community and the academic setting up to now,Reference Rodriguez-Bano, Lopez-Prieto and Portillo 9 – Reference Elhanan, Raz and Pitlik 11 with the latter often being overrepresented in large-scale surveillances. 6 This might be considered somewhat surprising because CH contribute a significant percentage of positive blood cultures, with CH representing 83% of all patients admitted to acute care hospitals in Switzerland. 13 Similar healthcare systems characterize other European countriesReference Hofmarcher and Quentin 34 , Reference Anell, Glenngard and Merkur 35 or the United States—for example, in 2009 69% of all hospitals in the United States were nonteaching CH and, in 2010, 51% (19.9 million) of patient discharges were from nonteaching facilities.Reference Rice, Rosenau, Unruh, Barnes, Saltman and van Ginneken 36 , Reference Anderson, Moehring and Sloane 37
The hypothesis that the patterns and trends of BSI differ between UH and CH was confirmed. E. coli and S. aureus were identified more frequently in CH, whereas polymicrobial BSIs and CoNS were more commonly observed in the university setting. Interestingly, this difference was not only observed in HA infections but, with the exception of S. aureus, in CA-BSI too. Our findings were further confirmed by the divergent trend for CA-E. coli BSI in the 2 hospital types in the 2008–2014 period: E. coli increased in CH to 45% of all CA episodes and decreased in UH. This trend and the observed patterns among CA-BSI probably reflect the differences between the 2 hospital settings, with elderly patients and a different mix of clinical presentations (eg, more pneumonia, abdominal infections, cutaneous ulcers, fewer chronic renal failures) being more often observed in CH.Reference Rodriguez-Bano, Lopez-Prieto and Portillo 9 , Reference Mylotte, Kahler and McCann 10 Furthermore, HA-BSIs are often associated with hematologic cancer, neutropenic patients, venous catheter infections, and less commonly with urinary tract infections or abdominal infections in tertiary care centers.Reference Rodriguez-Bano, Lopez-Prieto and Portillo 9 Our results provide the first microbiologic description on a national scale for the clinical manifestation witnessed in other, smaller clinical studies.Reference Rodriguez-Bano, Lopez-Prieto and Portillo 9 – Reference Elhanan, Raz and Pitlik 11
The significant differences in the distribution of microorganisms causing BSI in CH and UH affect clinical care. Empirical antibiotic treatment guidelines in Switzerland are often produced by academic centers and distributed to networks of smaller centers. Such protocols are mostly based on the local epidemiology observed in the academic setting, and application to community centers may be less appropriate. For example, a reduced use of broad-spectrum antimicrobial agents (eg, antibiotics against oxacillin-resistant strains usually found in polymicrobial and CoNS BSIs) could be envisioned for the treatment of CA infections in community centers.
Our study has several limitations. Although the initial selection of hospitals was representative, selection bias could have been introduced when restricting the analysis to BSIs with known acquisition (71% of included episodes). In this context, inaccurate documentation of the date of sampling might be a source of uncertainty. Furthermore, possible “healthcare-associated” infections were not identified among CA infections because we had no access to pertinent clinical data. Prospective observational studies are needed to better delineate differences in site of acquisition and the role of hospital setting. Moreover, because we did not distinguish between catheter and peripheral culture results, we may have overestimated the number of BSIs due to “noncontaminant” organisms. Finally, we did not provide data on resistance of microorganisms, which are essential for decision-making about empirical antimicrobial therapies.
In conclusion, this study documents a very timely picture of the BSI epidemiology in Switzerland over a 7-year period. E. coli maintains a predominant role in BSIs and its importance has become even more pronounced, especially in CH. Difficult-to-treat infections—for example, CoNS and polymicrobial BSIs—remain important, especially in HA infections and UH. CH and UH show divergent BSI epidemiology, with E. coli representing almost half of CA-BSIs in CH in 2014. The choice of empirical antibiotic treatment should follow the local epidemiology, in particular taking the type of hospital into consideration, especially in countries with a similar healthcare system.
MEMBERS OF ANRESIS
R. Auckenthaler, Synlab Suisse, Switzerland; A. Cherkaoui, Bacteriology Laboratory, Geneva University Hospitals, Switzerland; M. Dolina, Department of Microbiology, EOLAB, Bellinzona, Switzerland; O. Dubuis, Viollier AG, Basel, Switzerland; R. Frei, Clinical Microbiology Laboratory, University Hospital Basel, Switzerland; D. Koch, Federal Office of Public Health, Bern, Switzerland; A. Kronenberg, Institute for Infectious Diseases, University of Bern, Switzerland; S. Luyet, Swiss Conference of the Cantonal Ministers of Public Health, Switzerland; P. Nordmann, Molecular and Medical Microbiology, Department of Medicine, University Fribourg, Switzerland; V. Perreten, Institute of Veterinary Bacteriology, University of Bern, Switzerland; J.-C. Piffaretti, Interlifescience, Massagno, Switzerland; G. Prod’hom, Institute of Microbiology, Centre Hospitalier Universitaire Vaudois, Lausanne, Switzerland; J. Schrenzel, Bacteriology Laboratory, Geneva University Hospitals, Geneva, Switzerland; M. Täuber, Institute for Infectious Diseases, University of Bern, Switzerland; A. F. Widmer, Division of Infectious Diseases & Hospital Epidemiology, University of Basel, Switzerland; G. Zanetti, Service of Hospital Preventive Medicine, Centre Hospitalier Universitaire Vaudois, Lausanne, Switzerland; R. Zbinden, Institute of Medical Microbiology, University of Zürich, Switzerland.
ACKNOWLEDGMENTS
We thank all microbiology laboratories participating in the ANRESIS network: Institute for Laboratory Medicine, Cantonal Hospital Aarau; Central Laboratory, Microbiology Section, Cantonal Hospital Baden; Clinical Microbiology, University Hospital Basel; Viollier AG, Basel; Laboratory Medicine EOLAB, Department of Microbiology, Bellinzona; Institute for Infectious Diseases, University Bern; Microbiology Laboratory, Unilabs, Coppet; Central Laboratory, Cantonal Hospital Graubünden; Microbiology Laboratory, Hospital Thurgau; Microbiology Laboratory Hôpital Fribourgeois, Fribourg; Bacteriology Laboratory, Geneva University Hospitals, Geneva; ADMED Microbiology, La Chaux-de-Fonds; Institute for Microbiology, Université de Lausanne; Centre for Laboratory Medicine, Cantonal Hospital Luzern; Centre for Laboratory Medicine, Cantonal Hospital Schaffhausen; Centre for Laboratory Medicine Dr. Risch, Schaan; Central Institute, Hôpitaux Valaisans (ICHV), Sitten; Centre of Laboratory Medicine St. Gallen; Institute for Medical Microbiology, University Hospital Zürich; Laboratory for Infectious Diseases, University Children’s Hospital Zürich.
We also thank the steering committee of ANRESIS. Lastly, we appreciate Paolo Mombelli for his editorial support.
Financial support. The ANRESIS database is funded by the Federal Office of Public Health, the Conference of Cantonal Health Ministers, and the University of Bern, Switzerland.
Potential conflicts of interest. All authors report no conflicts of interest relevant to this article.
SUPPLEMENTARY MATERIAL
To view supplementary material for this article, please visit http://dx.doi.org/10.1017/ice.2016.137