I. INTRODUCTION
Tin-doped indium oxide is a prototypical transparent conducting oxide (TCO) with important applications as a window electrode in liquid crystal displays, electroluminescent displays, and many designs of solar cell.Reference Ginley, Hosono and Paine1, Reference Hosono2 Self evidently the band gap of a TCO is one of the most critical properties in determining applications in optoelectronic devices, but nonetheless the magnitude and nature of the band gap of In2O3 has aroused considerable controversy in recent years. It was established only in 2008 that In2O3 has a direct but dipole-forbidden band gap of around 2.9 eV, with a fully allowed optical onset just less than 1 eV higher in energy.Reference Walsh, Da Silva, Wei, Korber, Klein, Piper, DeMasi, Smith, Panaccione, Torelli, Payne, Bourlange and Egdell3 The relatively low value of the band gap coupled with a strongly dispersing conduction band gives rise to a charge neutrality level that lies above the conduction band minimum, which in turn ensures that In2O3 has a high intrinsic dopability. As a consequence, tin-doped indium oxide remains the TCO of choice in many areas of application in spite of large increases in the price of indium following the surge of sales in liquid crystal television and computer monitor screens in the last decade.
Renewed interest in the basic physical properties of In2O3 has prompted attempts to grow high quality In2O3 single crystal thin films by molecular beam epitaxy (MBE).Reference Bourlange, Payne, Egdell, Foord, Edwards, Jones, Schertel, Dobson and Hutchison4–Reference Morales, He, Vinnichenko, Delley and Diebold8 Indium oxide itself adopts the body-centered cubic bixbyite structure, which belongs to the space group  with a lattice parameter a = 10.117 Å. The structure may be regarded as a 2 × 2 × 2 superstructure of fluorite but with 25% of the oxygen sites unoccupied. These vacant oxygen sites are then ordered and this gives rise to doubling of the unit cell as compared with the parent fluorite. The close relationship between the structures of bixbyite and fluorite has encouraged the widespread use of the oxygen deficient fluorite Y-stabilized cubic zirconia (Zr1−xYxO2−x/2, also referred to as YSZ) as a substrate for epitaxial growth of indium oxide thin films. The lattice parameter of YSZ increases with Y doping level and is measured to be 5.1447 Å at the 17% doping level of the substrates used in the current work. The mismatch m between the 2as for YSZ and ae for In2O3 has a value of −0.017 where m is defined by:

The negative value indicates that the epilayer is under tensile stress.
The growth morphology of In2O3 on YSZ depends critically upon the orientation of the substrate. Continuous or near continuous thin films are obtained on (111) oriented substrates.Reference Morales, He, Vinnichenko, Delley and Diebold8, Reference Zhang, Payne, Palgrave, Lazarov, Chen, Wee, McConville, King, Veal, Panaccione, Lacovig and Egdell9 However on (001) substrates, square islands with edges aligned along <110> directions are obtained,Reference Bourlange, Payne, Palgrave, Foord, Egdell, Jacobs, Schertel, Hutchison and Dobson5, Reference Bourlange, Payne, Jacobs, Egdell, Foord, Schertel, Dobson and Hutchison10 while on (110) substrates rod-like growth is observed with the long axes of the rods lying along the  direction.Reference Zhang, Walsh, Catlow, Lazarov and Egdell11 For both In2O3 and YSZ, the surface energies for the low index terminations follow the sequence γ(001)>>γ(110)>γ(111).Reference Zhang, Walsh, Catlow, Lazarov and Egdell11–Reference Agoston and Albe13 The oriented islands and rods found on (001) and (110) surfaces, respectively, allow development of extended low energy {111} side facets.
In the current paper, reciprocal space mapping using synchrotron-based x-ray diffraction (XRD) is used to explore strain and strain relaxation in indium oxide films on YSZ(111). Recent interested in the influence of strain on indium oxide has been stimulated by the finding that epitaxial tensile strain may be used to tune the band gap of indium oxide thin films.Reference Walsh, Catlow, Zhang and Egdell14, Reference Zhang, Lazarov, Veal, Oropeza, McConville, Egdell and Walsh15 The XRD results obtained are discussed in relation to the morphologies of the samples revealed by atomic force microscopy (AFM).
II. EXPERIMENTAL
Indium oxide layers were grown on 1 × 1 cm (111) oriented Y-stabilized ZrO2 substrates with a nominal Y doping level of 17% (as defined by the formula Zr1−xYxO2−x/2 with x = 0.17) in an ultrahigh vacuum oxide MBE system (SVT, Eden Prairie, MN) with a base pressure of 5 × 10⁻¹⁰ mbar. This incorporated liquid nitrogen-cooled cryopanels, a hot lip indium effusion cell, and a radio frequency (RF) plasma oxygen atom source operated at 200 W RF power with an oxygen background pressure of 2 × 10⁻⁵ mbar. Substrates were held by gravity in a recessed Mo mounting plate and heated radiatively using a graphite filament. The sample temperature was measured by a chromel–alumel thermocouple mounted behind the cradle holding the sample mounting plate. Substrates were cleaned by exposure to the oxygen atom beam with a measured substrate temperature of 900 °C. Films were grown at a substrate temperatures of 700 °C in growth runs whose duration extended between 103 and 12 × 103 s. The nominal deposition rate was set at 0.01 nm/s using a quartz crystal monitor offset from the substrate position. However, the true growth rate on the substrate was 0.035 nm/s, as determined by analysis of cross-sectional transmission electron microscopy (TEM) images of samples with thicknesses of 70 and 210 nm. The thickness of the three samples studied thus varied between 35 and 420 nm.
θ–2θ XRD profiles were measured in-house with a PANalytical X’Pert Pro diffractometer (PANalytical, Almelo, Netherlands) incorporating a monochromated Cu–Kα source (λ = 1.5406 Å). AFM images were recorded in a Digital Instruments Multimode Scanning Probe Microscopy instrument with a Nanoscope IIIa controller operating in a contact mode as described in detail elsewhere.Reference Bourlange, Payne, Palgrave, Foord, Egdell, Jacobs, Schertel, Hutchison and Dobson5 Specimens for cross-sectional TEM were prepared by cutting and mechanical grinding down to 5–10 μm, followed by thinning to electron transparency by Ar ion beam milling using a Gatan 691 Precision Ion Polishing System. Cross-sectional TEM images were collected using a JEOL3000F microscope operating at 300 keV. Digital Micrograph image software was used to process the TEM images. Bragg filtering was applied to the TEM images to remove some of the background noise and contrast adjustment was applied uniformly across the images where necessary to enhance the display quality.
Reciprocal space mapping experiments on three samples with thicknesses of 35, 105, and 420 nm were conducted on the bending magnet beamline XMaS/BM28 at the European Synchrotron Radiation Facility (ESRF), Grenoble France using a photon energy of 12.398 keV, corresponding to a wave length λ = 1.0000 Å. The sample was mounted directly in air on a vertical scattering four-circle Huber diffractometer.Reference Brown, Bouchenoire, Bowyer, Kervin, Laundy, Longfield, Mannix, Paul, Stunault, Thompson, Cooper, Lucas and Stirling16 The scattered photons were detected with an avalanche photodiode with a linear response up to 2 × 10⁶ counts/s. Beyond this count rate automated attenuators were inserted into the beam.
III. RESULTS AND DISCUSSION
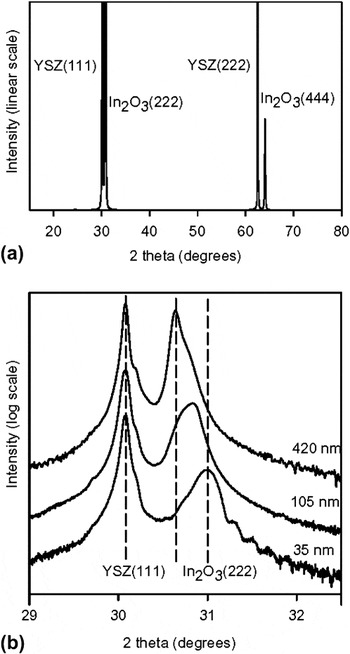
A θ–2θ diffraction profile for the 420-nm-thick film measured in-house using monochromated Cu–Kα radiation is shown in Fig. 1(a). (222) and (444) epilayer peaks are found at slightly higher angles than the substrate (111) and (222) reflections. The diffraction profile is indicative of epitaxial growth. Expansions of the substrate (111) and epilayer (222) reflections presented on a logarithmic scale for all three samples are shown in Fig. 1(b). The epilayer (222) reflection is seen to move to lower angle with increasing film thickness. The basis for this behavior will be discussed below.
θ–2θ XRD profiles of the three samples used in reciprocal space mapping experiments measured using monochromated Cu–Kα radiation. (a) Wide scan profile showing substrate (111) and (222) reflections and epilayer (222) and (444) reflections for sample with nominal thickness of 420 nm. (b) Narrow scan profile across the substrate (111) and the epilayer (222) reflections for samples with thicknesses of 35, 105, and 420 nm. The intensity scale is linear in (a) and logarithmic in (b).

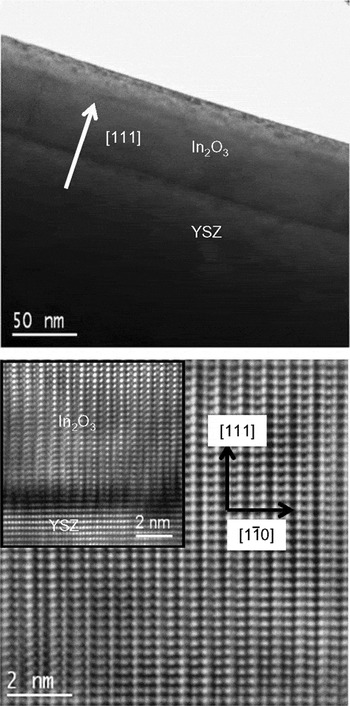
Epitaxial growth of the films is further confirmed by TEM. The upper panel of Fig. 2 shows a low-resolution cross-sectional TEM image of a sample with a thickness of 70 nm, intermediate between the thicknesses of two of the films used in the mapping experiments. The image reveals a sharp interface and a reasonably flat surface. The lower panel of Fig. 2 shows an atomically resolved image of the epilayer viewed down the  direction, with the interface region shown as an inset. These higher resolution images reveal an atomically abrupt interface and excellent crystal quality in the epilayer.
Cross-sectional TEM images of an In2O3(111) sample of thickness 70 nm. Upper panel: low-resolution image to show sample morphology. Lower panel: high-resolution image showing atomic-scale resolution. The inset shows the interface region. All images are viewed down the  direction.

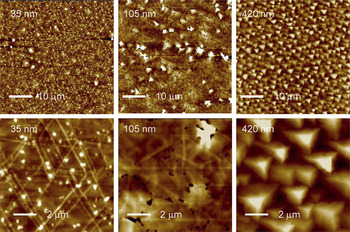
AFM images of the three samples studied in the present work are shown in Fig. 3. The 35-nm-thick film is continuous across the surface with a characteristic pattern of so-called crosshatch ridges running across the sample. These have a typical height of about 1.8 nm, giving rise to an overall root mean square (RMS) roughness of 1.4 nm. The axes of the ridges are preferentially aligned along <110> directions with a crosshatch angle of 60° where ridges intersect, reflecting the 3-fold rotational symmetry of the (111) surface. Crosshatch morphology has been observed in a number of other systems where the lattice mismatch is less than 2% (e.g., Si1−xGex/Si) and has been attributed to a pattern of dislocations localized at the interface.Reference Chen, Li, Peng, Liu, Liu, Huang, Zhou and Xue17–Reference Albrecht, Christiansen, Michler, Dorsch, Strunk, Hansson and Bauser19 The density and height of the crosshatch ridges increase with increasing coverage in the range of thicknesses up to about 100 nm, beyond which a dewetting process leads to the formation of pinholes. These are apparent in the AFM image of the sample with epilayer thickness of 105 nm shown in Fig. 3. The RMS surface roughness for this sample is 5.2 nm. With further increasing coverage the pinholes fill in and the surface of the film with thickness of 420 nm develops a morphology dominated by protruding triangular islands. This leads to a further increase in the RMS roughness to 11.0 nm.
AFM images of the three samples of In2O3(111) of different thickness used in the reciprocal space mapping experiments in the current study. The images in the upper row have dimensions of 50 × 50 μm and the images in the lower row have dimensions 10 × 10 μm. The RMS roughness for the three samples as derived from the 50 μm images are respectively 1.4, 5.2, and 11.0 nm, with vertical ranges of 30, 80, and 100 nm in the large area images.

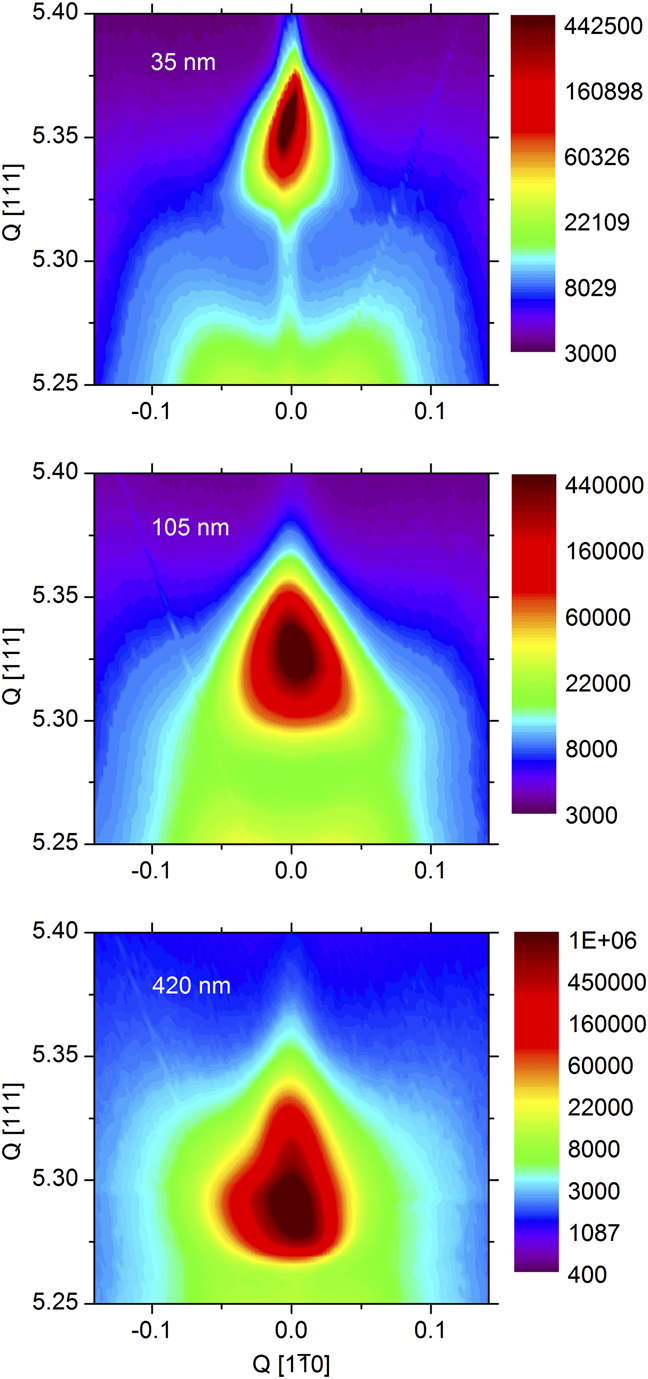
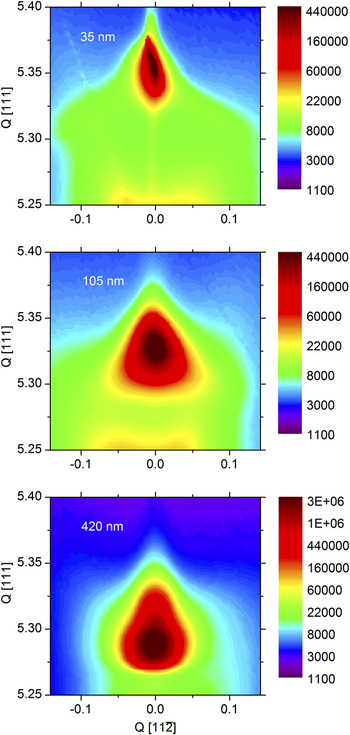
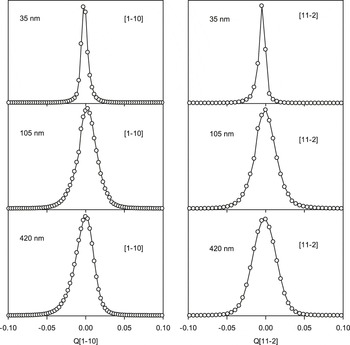
Reciprocal space maps taken around the epilayer (666) reflection for the three samples are shown in Fig. 4 and Fig. 5. In both cases, the longitudinal wave vector transfer is along the [111] direction, with the transverse wave vector transfer along the  direction in Fig. 4 and along the alternative high symmetry
 direction in Fig. 5. The scattered intensity is a maximum at zero transverse wave vector transfer. This situation contrasts with that found on (001) oriented substrates where the scattering intensity is displaced from zero due to tilting of the epilayer through a characteristic angle of about 0.7° long <110> directions.Reference Cowley, Bourlange, Hutchison, Zhang, Korsunsky and Egdell20 We may therefore infer that epilayers grown on (111) oriented substrates exhibit no tilt of this sort. Two important trends are apparent in both sets of maps.
(i) The position of maximum intensity in the maps moves to progressively lower Q[111] with increasing sample thickness, approaching the value of Q[111] = 5.284 substrate reciprocal lattice units characteristic of bulk In2O3. This is consistent with the shift in the epilayer peak position in θ–2θ scans evident in Fig. 1. The pronounced shift to higher Q[111] found for the thinnest film arises from epitaxial strain, which leads to an expansion in the in-plane lattice spacings and a corresponding contraction normal to the surface via the Poisson effect. Progressive strain relaxation with increasing film thickness allows the films to relax back toward the bulk lattice spacing.
(ii) The full width at half maximum height ΔQ for line profiles running through the position of maximum scattering intensity in a transverse direction increases with increasing film thickness, as shown in Fig. 6.
Reciprocal intensity space maps for the three samples studied taken around the epilayer (666) reflection. The horizontal axis gives transverse wave vector transfer along the  direction and the vertical axis longitudinal transfer along the [111] direction in reciprocal lattice units of the substrate.
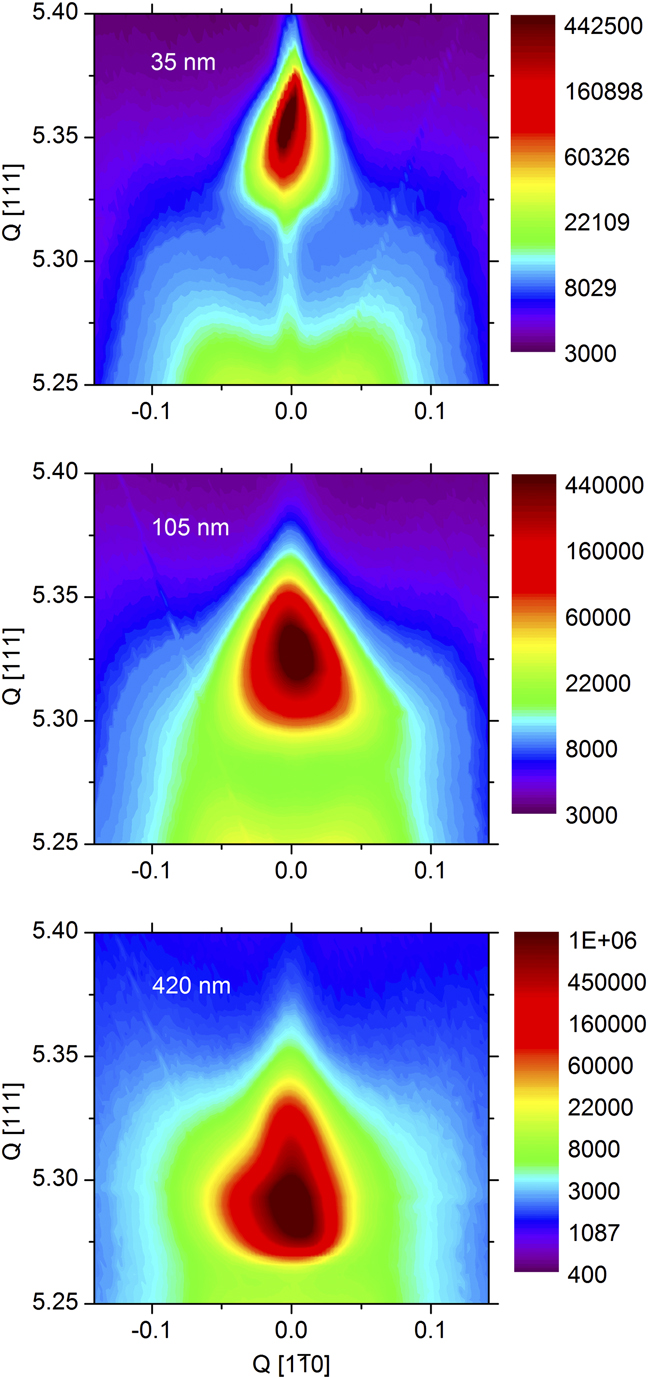
Reciprocal intensity space maps for the three samples studied taken around the epilayer (666) reflection. The horizontal axis gives transverse wave vector transfer along the  direction and the vertical axis longitudinal transfer along the [111] direction in reciprocal lattice units of the substrate.


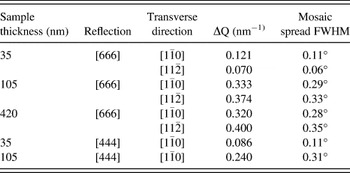
The half-widths in transverse scans through both [666] and [444] Bragg peaks (profiles not shown) derived from fitting profiles to a Voigt function are collected together in Table I. The data for the (444) Bragg peak is restricted to the  direction for the samples with thicknesses of 35 and 105 nm. It can be seen that the transverse half-width is bigger for the [666] reflection than for the [444] reflection and increases roughly in proportion to the longitudinal wave vector transfer. The widths can be interpreted in terms of a mosaic spread in the orientation of crystal planes. The mosaic spread half-width angles are therefore also given in the table. The values derived from transverse scans along the
 direction range between 0.1° for the 35-nm film to around 0.3° for the two thicker films. These values are all much greater than a value of 0.012° found for the Y–ZrO2 substrate (value likely to be instrument limited). Note that line broadening due to finite domain sizes would give rise to transverse half-widths independent of longitudinal wave vector transverse. The apparent increase in mosaic spread with increasing thickness of the epilayer is not surprising given the changes in film morphology evident in Fig. 3, which indicates increasing roughness in the films with increasing thickness. A linear dependence of the half-width of transverse scans on longitudinal wave vector transfer has been found earlier for GaSb on InAs.Reference Babkevich, Cowley, Mason, Sandiford and Stunault21 The mosaic spread measured for this system was also found to increase with increasing film thickness as in the present work.
Full width at half maximum height ΔQ and associated values of mosaic spread full width at half maximum (FWHM) for transverse scans through the epilayer [666] and [444] reflections.

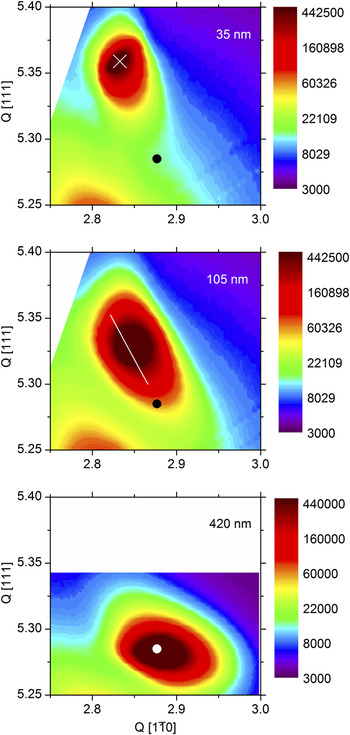
We turn finally to consideration of reciprocal space maps for a nonspecular Bragg peak. Figure 7 shows maps around the (1026) reflection. This involves adding  transverse wave vector transfer along the
 direction to [666] longitudinal wave vector transfer along the [111] direction. In each map, the coordinates for unstrained In2O3 (assuming the bulk lattice parameter a = 10.117 Å) are shown as a circular dot in the lower part of the figure. For the 35-nm-thick sample the maxima QI in the scattering from the epilayer are found at
 and QI[111] = 5.3950. These are strongly displaced from
 and Q0[111] = 5.2845 for bulk In2O3. In plane, the epilayer comes close to matching the substrate, for which
 . Thus, the mismatch of 1.7% between substrate and epilayer is almost completely eliminated by in-plane strain. At the same time, there is a large increase in Q[111] owing to the Poisson contraction normal to the surface. The globular shape of the contours indicates that there is little relaxation in the film. By contrast for the 420-nm film, there is almost complete relaxation and the coordinates for unstrained bulk In2O3 fall in the center of the contours which define scattering from the epilayer. For the intermediate 105-nm film, the reciprocal space map has an elongated ovoid shape: the principal axis slopes in a downward diagonal direction in the map as indicated by the superimposed line. This map suggests a partially relaxed film structure: close to the interface the film is under tensile strain to bring the lateral periodicity toward that of the substrate, but the strain is relaxed by moving away from the interface and
 moves up toward the value for bulk In2O3. In parallel with this variation, Q[111] decreases as Q
 increases owing to the Poisson effect, i.e., as tensile strain in the transverse direction is released the compensating compressive strain in the longitudinal direction also decreases. The diagonal line in the map for the 105-nm-thick sample links points of maximum intensity in transverse cuts through the map and extrapolates toward the reciprocal space coordinates for bulk In2O3.
Reciprocal space maps for the three samples studied in the current work taken around the epilayer (1026) reflection. The horizontal axis gives transverse wave vector transfer along the  direction and the vertical axis longitudinal transfer along the [111] direction in reciprocal lattice units of the substrate. The circular spots in the lower part of each figure mark the position of the (1026) reflection for unstrained In2O3, while the cross for the sample with thickness of 35 nm identifies the position of maximum intensity in the map. The white line in the map for the sample with a thickness of 105 nm was derived from a linear least squares fit to a plot of QI[111]−1 versus QI
 , where the subscript I signifies the coordinates of maximum scattering in successive transverse scans used to build up the map.

The Poisson ratio is defined by the equation

where  and
 are the strains normal and parallel to the surface;
 and
 are the corresponding separations between atomic planes in the strained layer; and
 and
 are the values for the unstrained system. We may write this relationship in terms of the reciprocal space coordinates for the (1026) reflection of bulk In2O3 and for the position of maximum intensity in the map for the epilayer

where
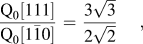
and the reciprocal lattice coordinates are expressed in terms of reciprocal lattice vectors of the substrate. This procedure gives v = 0.31 ± 0.02. As has been discussed elsewhere,Reference Zhang, Regoutz, Palgrave, Payne, Egdell, Walsh, Collins, Wermeille and Cowley22 this value is higher than found for (001) oriented films where v = 0.27 ± 0.04.
It is interesting to compare the experimental value for the Poisson ratio with the value derived from atomistic simulations. Even for a cubic system, the Poisson ratio depends on the crystallographic direction. For the [111] direction in a cubic crystalReference Segmuller23

where

The elastic constants computed by Walsh et al.Reference Walsh, Catlow, Sokol and Woodley24 are as follows: C 11 = 297.75 GPa, C 12 = 141.78 GPa, and C 44 = 76.42 GPa. The derived value for C 0 as defined above is only −3.13 GPa. This gives ν[111] = 0.33. The calculated value of ν[111] is therefore very close to that of 0.31 found experimentally.
The present data may be compared with previous experimental work. Neerinck and VinkReference Neerinck and Vink25 determined ν = 0.35 from XRD measurements on polycrystalline In2O3, a value higher than found here. For structurally related Y-doped ZrO2 Ingel et al. measured C 11, C 12, and C 44 for single crystal samples as a function of Y doping level using an acoustic wave pulse overlap techniqueReference Ingel and Lewis26 and found that ν decreased from around 0.32 to around 0.30 as the Y2O3 fraction in (Y2O3)x(ZrO2)1−x doping level increased from 7% to 17%. Selcuk and Atkinson inferred similar values by extrapolating data from measurements on polycrystalline samples of different densities back to zero porosity.Reference Selcuk and Atkinson27
IV. CONCLUSIONS
Reciprocal space XRD mapping has been used in conjunction with AFM to probe strain and strain relaxation in thin films of In2O3 grown on cubic Y-doped ZrO2(111). Films with a thickness of 35 nm are highly strained and match the substrate laterally, with an out-of-plane contraction in lattice spacing due to the Poisson effect. They display a characteristic crosshatch morphology in AFM with low roughness. Strain is released and pinholes begin to appear in the films as the film thickness increases. The thickest films studied (420 nm thickness) are completely relaxed but much rougher. The widths of transverse scans through the (444) and (666) specular Bragg peak increases with increasing film thickness and also increases with longitudinal wave vector transfer. The widths are interpreted in terms of a mosaic spread in the orientation of crystal planes within the epilayer. The spread increases with increasing film thickness, as has been found earlier for GaSb on InAs.Reference Cowley, Bourlange, Hutchison, Zhang, Korsunsky and Egdell20 Despite this observation, it has been found in earlier work that the mobility of carriers in indium oxide thin films increases with increasing film thickness.Reference Zhang, Lazarov, Veal, Oropeza, McConville, Egdell and Walsh15 Taken together with the present x-ray results, these findings seem to imply that scattering mosaic spread in epilayer orientation does not in itself limit carrier mobility.
ACKNOWLEDGMENTS
K.H.L.Z. would like to thank the Oxford Clarendon Fund for financial support. The Oxford MBE project was initially supported by EPSRC Grant GR/S94148. This work was performed on the EPSRC-funded XMaS beamline at the ESRF, directed by M.J. Cooper, C.A. Lucas, and T.P.A Hase. We are grateful to S.D. Brown, O. Bikondoa, L. Bouchenoire, and P. Thompson for their invaluable assistance and to S. Beaufoy and J. Kervin for additional support.