


Introduction
Local subglacial conditions exert a major control on the dynamics of entire ice masses through vertical, longitudinal and lateral stress coupling. Spatial and temporal variations in basal drag, i.e. the distribution of sticky and slippery spots and their changes over time, control ice mass dynamics at timescales ranging from hours (Reference Jansson and HookeJansson and Hooke, 1989; Reference Bindschadler, King, Alley, Anandakrishnan and PadmanBindschadler and others, 2003; Reference Sugiyama and GudmundssonSugiyama and Gudmundsson, 2003) to decades (Reference KambKamb and others, 1985; Reference Shabtaie and BentleyShabtaie and Bentley, 1987; Reference Fowler, Murray and NgFowler and others, 2001). Most studies of glacier dynamics have been undertaken on temperate or largely temperate polythermal glaciers where subglacial hydrology controls basal drag, through its effects on water storage and pressure, promoting sliding and sediment deformation (Reference MeierMeier and others, 1994; Reference Raymond, Benedict, Harrison, Echelmeyer and SturmRaymond and others, 1995; Reference Fischer and ClarkeFischer and Clarke, 2001). Force-balance analysis on such glaciers has identified regions where motion is locally forced by changes in basal drag, and those where movement is non-locally forced through longitudinal or lateral stress coupling (Reference Hooke, Calla, Holmlund, Nilsson and StroevenHooke and others, 1989; Reference Van der Veen and WhillansVan der Veen and Whillans, 1993; Reference Iken and TrufferIken and Truffer, 1997; Reference Mair, Nienow, Willis and SharpMair and others, 2001).
Far fewer studies of glacier dynamics have been undertaken on largely cold polythermal glaciers. Here, the distribution of warm and cold basal ice is likely to affect basal drag both directly, through its control on basal ice deformation and regelation, and indirectly, through its control on subglacial hydrology, and therefore sliding and sediment deformation. A few studies on such glaciers have reported higher surface velocities in summer than winter, suggesting supraglacial meltwater penetrates to the bed and influences sliding or sediment deformation (Reference IkenIken, 1974; Reference AndreasenAndreasen, 1985; Reference BlatterBlatter, 1987; Reference Blatter and KappenbergerBlatter and Kappenberger, 1988; Reference Blatter and HutterBlatter and Hutter, 1991; Reference Rabus and EchelmeyerRabus and Echelmeyer, 1997). Crevasse distribution may determine whether surface water reaches the bed or not; the crevassed Erikbreen, Svalbard, has seasonal velocity variations, whereas the similar-sized uncrevassed Hannabreen, Svalbard, does not (Reference Sollid, Etzelmüller, Vatne and ØdegårdSollid and others, 1994).
Even fewer studies have observed velocity variations on shorter timescales during the summer, associated with daily or weekly variations in ablation (Reference IkenIken, 1974; Reference Rabus and EchelmeyerRabus and Echelmeyer, 1997; Reference Copland, Sharp and NienowCopland and others, 2003; Reference Rippin, Willis, Arnold, Hodson and BrinkhausRippin and others, 2005). Prior to our work on midre Lovénbreen there had been no force-balance studies on mainly cold polythermal valley glaciers, although investigations on McCall Glacier, Alaska, USA, showed how the small mass-balance gradient produced longitudinal strain rates that were approximately an order of magnitude less than those on temperate glaciers (Reference Rabus and EchelmeyerRabus and Echelmeyer, 1997). This suggests that longitudinal coupling lengths may be smaller on polythermal glaciers, so that local variations in basal drag may exert less influence on overall glacier flow.
Understanding the role of basal thermal regime and hydrology in the dynamics of polythermal glaciers is particularly important for three main reasons. First, both may be involved in the surge mechanism of polythermal glaciers (Reference Jiskoot, Murray and BoyleJiskoot and others, 2000; Reference MurrayMurray and others, 2000). Second, regional temperature increases associated with global climate change may be particularly marked in the Arctic (Reference Stouffer, Manabe and BryanStouffer and others, 1989; Reference Fleming, Dowdeswell and OerlemansFleming and others, 1997), having the potential to alter the thermal regime and hydrology of many polythermal glaciers (Reference Blatter and HutterBlatter and Hutter, 1991). The glacier dynamic response to such changes will have important implications for runoff and sediment delivery to Arctic streams and estuaries (Reference HodgkinsHodgkins, 1997). Third, polythermal glaciers are better analogues than temperate glaciers for present and former ice sheets, so their behaviour is best understood through the study of polythermal glaciers rather than temperate glaciers (Reference SugdenSugden, 1977; Reference PaynePayne and others, 2000).
The overall aim of this paper is to contribute to a better understanding of the role of both thermal regime and hydrology in the spatial and temporal distribution of basal drag and therefore the dynamics of a polythermal glacier. Specific objectives are to:
Monitor the position of surface markers across the tongue of a polythermal glacier over 1 year.
Use these measurements to calculate patterns of surface horizontal velocity and strain rate and the components of the force balance across the tongue over annual and seasonal timescales.
Use these calculations to investigate how the distribution of forces acts to drive and resist glacier flow, and whether this changes throughout a year.
Relate these observations to the distribution of warm and cold ice and to the location of major subglacial drainage axes.
Field Site
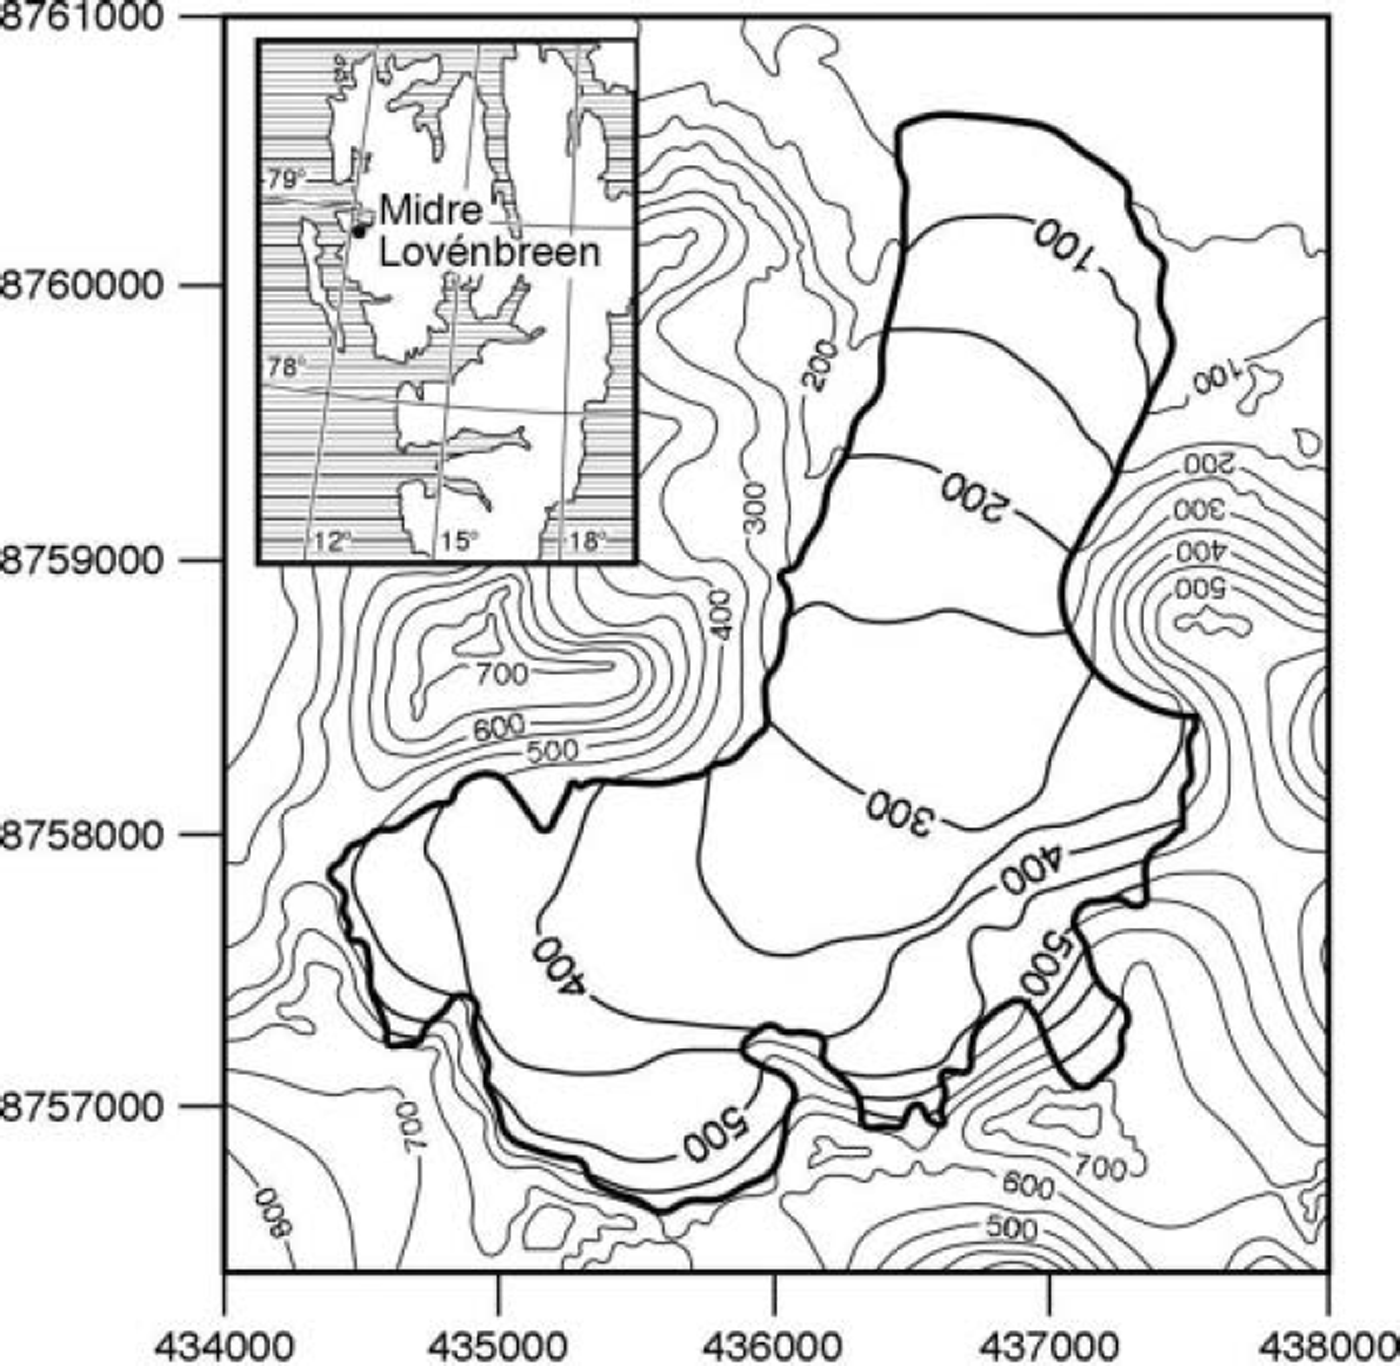
Midre Lovénbreen (78.53˚ N, 12.04˚E) is a small valley glacier in northwest Spitsbergen, Svalbard (Fig. 1). The glacier is ∼6 km long, with an area of ∼5.5 km2, a maximum thickness of ∼180m and an elevation range from ∼50 to ∼650ma.s.l. (Reference BjörnssonBjörnsson and others, 1996; Reference RippinRippin and others, 2003). The glacier has receded almost 1 km since the Neoglacial Maximum in ∼1890 (Reference Glasser and HambreyGlasser and Hambrey, 2001). Apart from 1981/82, the glacier has had a negative mass balance every year since 1967 (Reference Hagen and LiestølHagen and Liestøl, 1990; Reference Lefauconnier, Hagen, Örbæk, Melvold and IsakssonLefauconnier and others, 1999). The glacier may have switched from surge-type to non-surge type as it shrank during the 20th century, although there is no consensus on this (Reference HambreyHambrey and others, 2005).
Midre Lovénbreen (based on 1979 Norsk Polarinstitutt 1 :20 000 map, Brøggerbreane, Vestre og Midre Lovénbreane; derived from data collected in 1977; contours in metres).
Midre Lovénbreen is polythermal, with a warm-based core and cold-based ice around its snout and margins (Reference BjörnssonBjörnsson and others, 1996; Reference RippinRippin and others, 2003). It has cold ice at its surface, although the winter cold wave is eliminated in the summer in the accumulation basins (Reference BjörnssonBjörnsson and others, 1996). The glacier is relatively crevasse-free, except in the upper parts where subglacial topography is steep. Surface water may reach the warm-based core of the glacier via these crevasses but also via a large incised supraglacial stream which disappears beneath the glacier surface ∼1000m from the snout. During the winter, water drains slowly beneath the glacier and frozen forefield and forms a large icing in the central proglacial region (Reference LiestølLiestøl, 1988). During the spring, the subglacial drainage system usually develops at water pressures that are greater than atmospheric but less than ice overburden, and hydraulic potential gradients route subglacial water towards the east (Reference RippinRippin and others, 2003). In spring and early summer, surface-derived water is stored subglacially beneath the warm-based core. In mid-summer, it forces its way through the cold-based margin and emerges as a pressurized proglacial upwelling (Reference Hodson and FergusonHodson and Ferguson, 1999).
Methods
Glacier surface motion was determined from repeated surveys of a network of 17 survey markers distributed across the glacier tongue (Fig. 2a). The network was positioned to cover longitudinal variations in basal thermal regime (Fig. 2b), and lateral variations in the likely morphology of the subglacial drainage system (Fig. 2c). Figure 2c was derived as follows. Further details are given in Reference RippinRippin and others (2003). First, 20 × 20m gridded values of surface and bedrock elevation were used to calculate the subglacial hydraulic potential assuming subglacial water pressure equals half ice overburden pressure. Second, the upstream area across the hydraulic potential surface was mapped, where area is used as a surrogate for the water discharge through each gridcell. Each gridcell is assigned a ‘weight’ defined as its own area plus that of all upstream cells which contribute water to it, and each gridcell passes a proportion of its weight to any adjacent cell with a lower hydraulic potential. Thus, the total area of the glacier bed contributing water to each gridcell is calculated. Figure 2c acts as a guide to the morphology and hydraulic efficiency of subglacial drainage pathways, because these, at least in part, are determined by the discharge of water flowing through them. Thus, areas of the bed with high values are more likely to contain a hydraulically efficient channel system, whereas a hydraulically inefficient distributed system is likely to dominate areas with low values.
(a) Location of surface markers, strain triangles, centres of strain triangles and force-balance blocks. Each force-balance block is constructed from four adjacent strain triangles. The force-balance network consists of ten blocks, five down the eastern tongue and five down the western tongue. (b) Temperate ice thickness (m) constructed from unpublished data collected by J. Moore in May 1998. (c) Subglacial drainage system structure. Units are logarithms of upstream area (m2) across subglacial hydraulic potential surface assuming subglacial water pressure is half ice overburden pressure (after Reference RippinRippin and others, 2003).
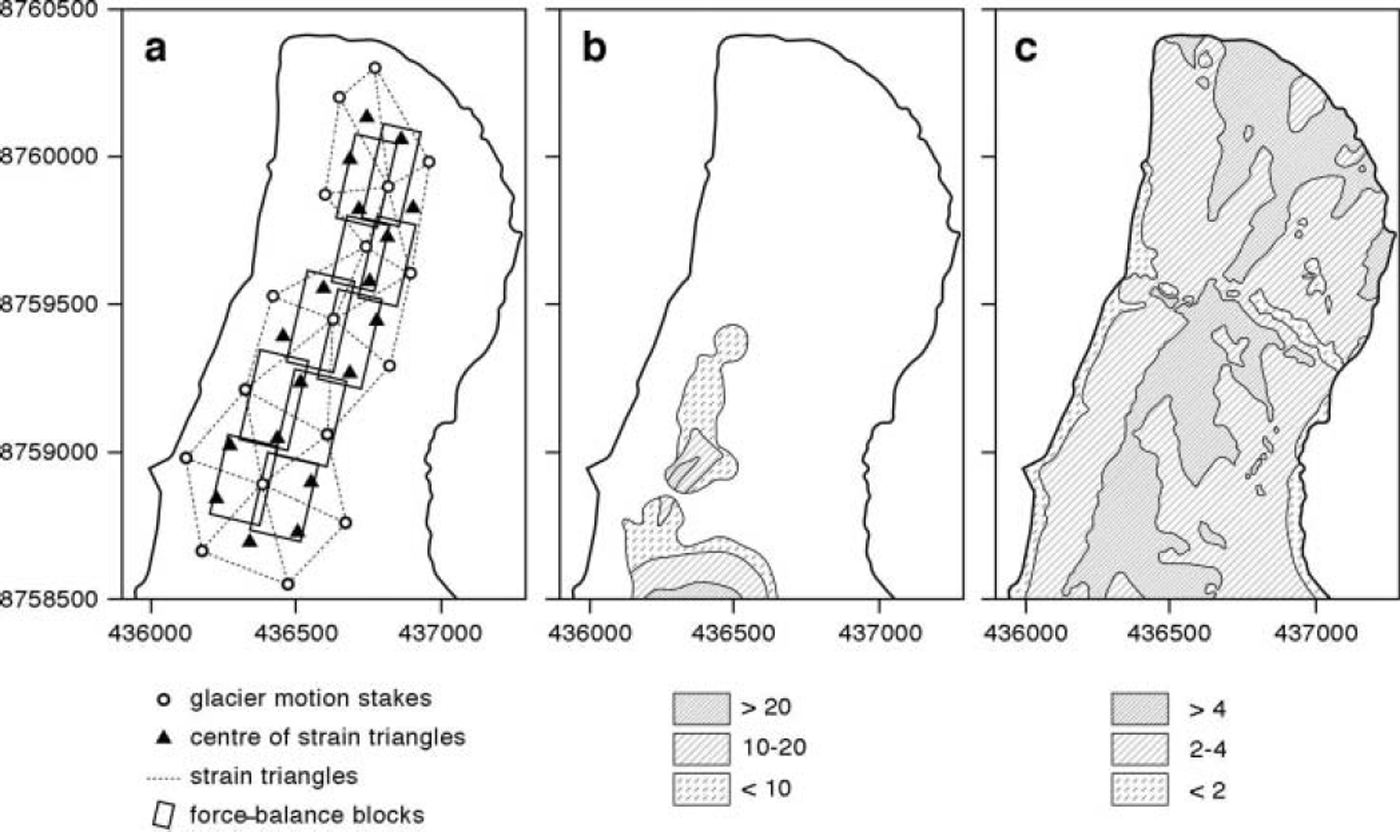
To investigate patterns of surface velocity, strain rate and the components of the force balance, the stake network was devised to form a series of 18 strain triangles and 10 theoretical force-balance blocks (Fig. 2a). Block dimensions were greater than one ice thickness, a requirement of the force-balance technique (Reference Van der Veen and WhillansVan der Veen and Whillans, 1989; Reference Mair, Nienow, Willis and SharpMair and others, 2001). Survey markers consisted of prisms at the centre of boards mounted on top of 2.2 m wooden or 3.0 m steel stakes, which were hand-drilled into the glacier. Surveys were conducted with a Geodimeter 410 total station from two survey stations on the west side of the valley, with reference to two fixed markers on the east side. Surveys were fixed into the Universal Transverse Mercator coordinate system using global positioning system measurements at all stations and fixed markers.
As two survey stations were used, and as a survey from each station involved measurements to the two fixed markers both before and after measurements to the glacier markers, a large number of redundant data were collected. This enabled us to calculate and minimize systematic, random and gross errors using the least-squares adjustment program GAP developed by J. Chandler and J.S. Clark at City University, London (Reference LaneLane, 1994). Further details of the error analysis are given in Reference Rippin, Willis, Arnold, Hodson and BrinkhausRippin and others (2005). Reference RippinRippin (2002) provides a full description. Surveys were conducted throughout the 1998 and 1999 summers as described by Reference Rippin, Willis, Arnold, Hodson and BrinkhausRippin and others (2005). In this paper, we use surveys done at the beginning and end of our summer field seasons on 14 July (day 195) and 7 August (day 219) 1998 and on 5 July (day 186) and 9 August (day 221) 1999. We therefore define four time periods:
Autumn/winter/spring 1998/99
7 August 1998 to 5 July 1999
Summer 1998
14 July–7 August 1998
Summer 1999
5 July–9 August 1999
Annual 1998/99
7 August 1998 to 9 August 1999
For each of the 17 markers, x and y velocities were calculated for each time period by dividing the change in x and y position by the time period between successive surveys. The xy velocities and their vector orientations were then calculated from the x and y data. The x and y velocity errors were calculated from the root-mean-square (rms) position errors, and the xy velocity errors were calculated from the rms x and y velocity errors.
For each of the 18 strain triangles, the magnitudes and angles of the two principal strains were calculated for each time period from the relative displacement of the three corners of each triangle. These were then used to calculate the longitudinal and transverse strain rates, with respect to the mean glacier flow direction. The shear strain rate in the xy plane was also calculated. The vertical strain rate was calculated from the longitudinal and transverse strain rates. All strain-rate errors were assumed to arise from the velocity uncertainties and were calculated using a Monte Carlo approach.
For each of the ten force-balance blocks, the balance of forces was calculated for each time period using the approach of Reference Van der Veen and WhillansVan der Veen and Whillans (1989). Here, the driving force is opposed by resistive forces, which are split into longitudinal drag on the up- and down-glacier sides of the block, lateral shear drag along the sides of the block and basal drag at the bottom. The driving force is calculated from the average surface slope and ice thickness of the block. Longitudinal and lateral shear forces are calculated from measured surface strain rates within the triangles straddling the sides of the block, and basal drag is calculated as the residual. All force-balance errors were assumed to arise from strain-rate errors and were determined using a Monte Carlo procedure.
A key parameter in the calculation of the force balance is the stiffness parameters, B (B = A –1/n , where A is the multiplier and n is the exponent in Glen’s flow law). On temperate glaciers, ice temperature is 0°C throughout, B is held constant, and strain rates are assumed to be constant with depth (Reference Hooke, Calla, Holmlund, Nilsson and StroevenHooke and others, 1989; Reference Iken and TrufferIken and Truffer, 1997; Reference Mair, Nienow, Willis and SharpMair and others, 2001). On the polythermal midre Lovénbreen these assumptions are less valid. However, the precise distribution of ice temperature is unknown and the variations in other factors that affect B (grain-size, impurities, ice density, ice fabric) are also unknown. Thus, we use a constant value for B of 6.32 × 10⁷Pas1 / 3 (2.0bara1/3), equivalent to an ice temperature of ∼–1.5°C. Sensitivity tests showed that although the magnitudes of the force-balance components are sensitive to the precise value of B used, their direction (positive or negative) and patterns, both between blocks and between different time periods, are not sensitive (Reference RippinRippin, 2002). In the results and discussion section below, we refer only to patterns, not magnitudes, of the force-balance components.
Reference Mair, Nienow, Willis and SharpMair and others (2001) and Reference Rippin, Willis, Arnold, Hodson and BrinkhausRippin and others (2005) provide further details of the velocity, strain-rate and force-balance calculations, together with their error estimates. Full details are given in Reference MairMair (1997) and Reference RippinRippin (2002).
Results and Discussion
Surface xy velocities
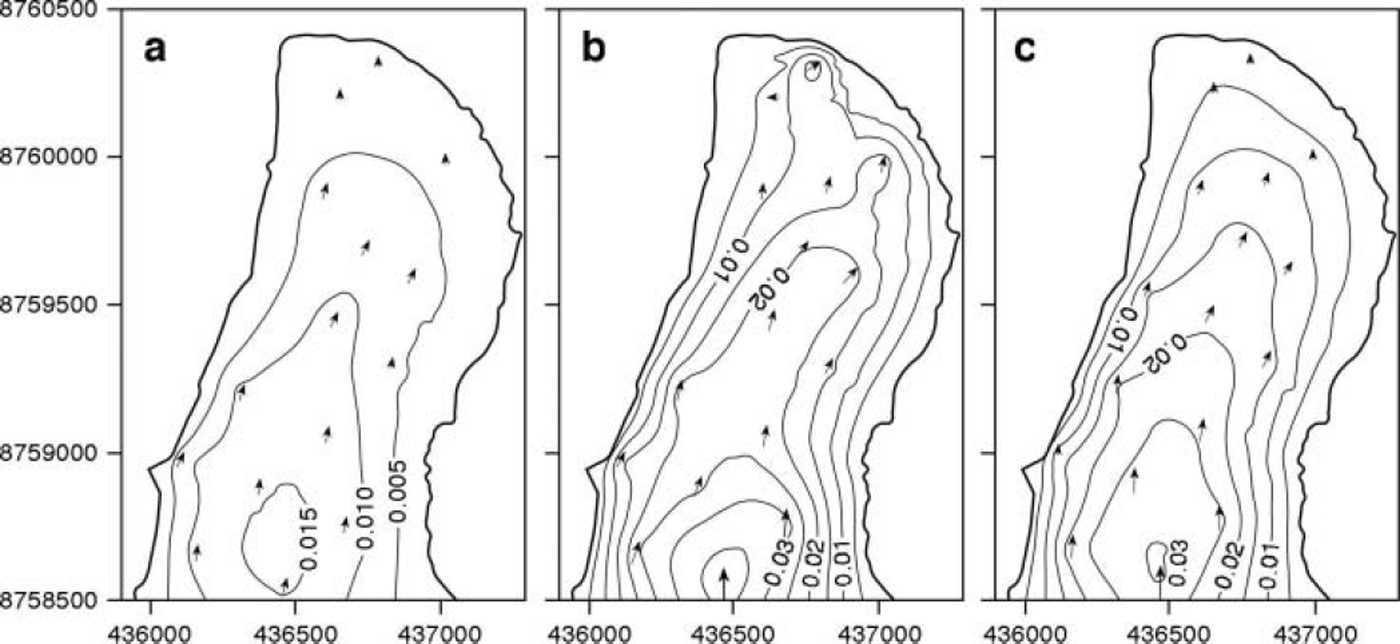
Figure 3 shows patterns of xy surface velocities for the three seasonal periods. The magnitude and pattern of velocities for the annual period (not shown) are very similar to the autumn/winter/spring period (hereafter A/W/S 98/99) (Fig. 3a). Over all three seasons, velocities were fastest along the centre line and slower towards the margins, and were higher in the upper tongue and slower towards the snout. The errors increased with distance down-glacier and were up to 2% on the upper tongue, 3% on the lower tongue and 7% at the snout. Azimuths of flow were similar between seasons. In the summers of 1998 (hereafter S98) and 1999 (hereafter S99), velocities ranged from ∼0.03md–1 in the upper tongue to <0.005 m d–1 near the snout (Fig. 3b and c). The major difference between the two summers was that velocities towards the centre of the lower tongue and snout regions were slightly higher in 1998 than in 1999. In the A/ W/S 98/99 period, velocities were everywhere lower, reaching ∼0.015md–1 on the upper tongue, but only ∼0.002md–1 near the snout (Fig. 3a). Over the annual period (not shown), centre-line velocities ranged from ∼0.02md–1 in the upper tongue, ∼0.01 md−1 in the lower tongue and ∼0.005 m d–1 near the snout. These equate to ∼7.3 and 3.7 m a−1 in the upper and lower tongue respectively and are similar to previous measurements (7.3 ma−1 (Reference LiestølLiestøl, 1988); 4.4 m a−1 (Reference BjörnssonBjörnsson and others, 1996)).
Mean xy surface velocities (md–1) for (a) autumn/winter/spring 1998/99; (b) summer 1998; and (c) summer 1999. Arrows indicate stake positions and show xy velocity azimuth; their size is proportional to the measured xy velocity magnitude. A linear kriging interpolation scheme was used to derive velocity contours. Contours are marked every 0.005 md–1. The boundary is derived from a surface digital elevation model based on 1995 air photos (after Reference RippinRippin and others, 2003). Velocities are set to zero at the boundary.
Surface strain rates
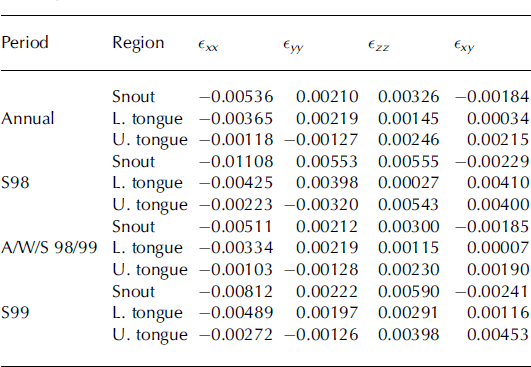
Average surface strain rates are shown in Table 1. For all time periods, the following observations can be made:
1. The greatest strain rates were longitudinal; they were compressive everywhere and generally increased towards the snout.
2. Vertical strain rates were everywhere extensive, highest near the snout, lower in the upper tongue and lowest in the middle tongue.
3. Lateral strain rates were compressive in the upper tongue and extensive in the lower tongue and snout.
4. For most time periods, shear strain rates were greatest in the upper tongue, less near the snout and least in the middle tongue. The exception was S98, when shear strain rates were unusually high in the middle tongue.
5. For the annual, A/W/S 98/99 and S99 periods, errors for all strain-rate components were typically <6%. For the S98 period, errors were larger and were up to 30% for some of the strain-rate components on both the snout and upper tongue.
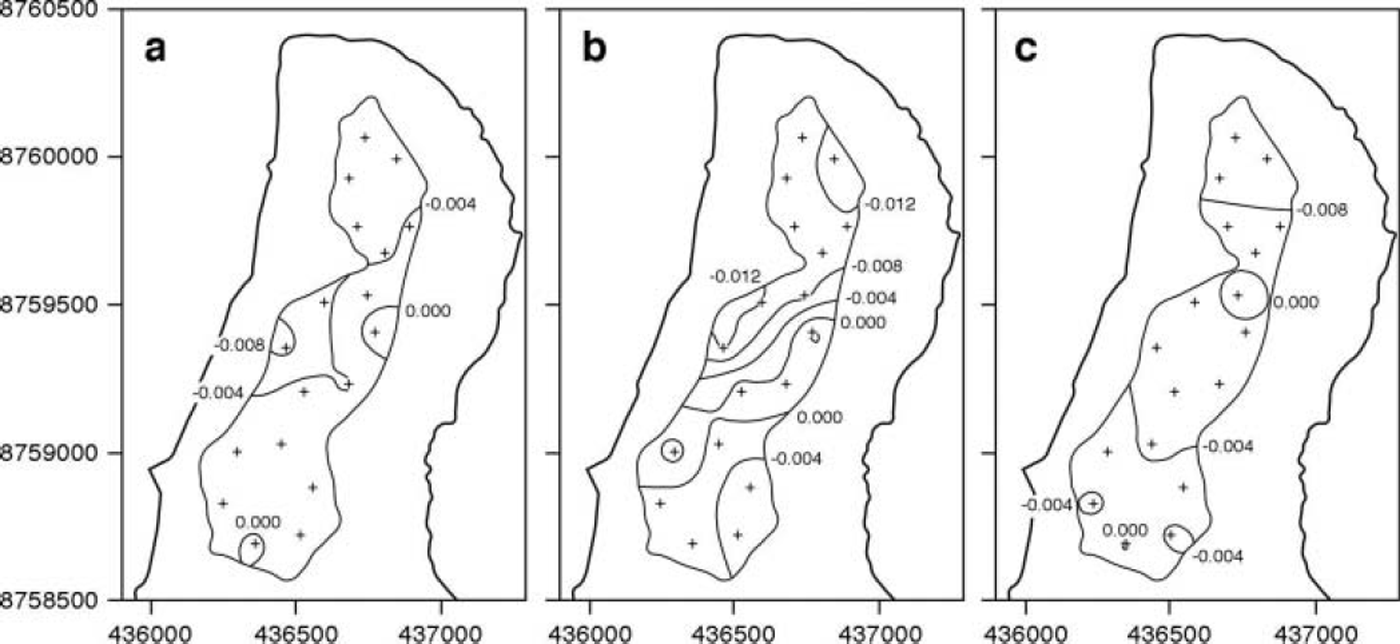
The patterns of longitudinal strain rates for the three seasonal periods are shown in Figure 4. The magnitude and pattern of strain rates for the annual period (not shown) are very similar to the A/W/S 98/99 period (Fig. 4a). For the A/W/S 98/99 period, longitudinal compression occurred across the whole tongue, except in two small isolated areas in the upper tongue and the central-east tongue, where small amounts of longitudinal extension occurred. Longitudinal compression increased slightly towards the snout, but was generally fairly uniform across the tongue. The S99 pattern was similar to the A/W/S 98/99 pattern, although magnitudes were everywhere higher, especially towards the snout (Fig. 4c). S98 patterns were somewhat different to those of S99, magnitudes were slightly higher overall, and there was a narrow area of extension across the upper central glacier and a corresponding area of slightly greater compression across the lower glacier (Fig. 4b).
Mean surface longitudinal strain rates (∊ xx rt) (d–1)for (a) autumn/winter/spring 1998/99; (b) summer 1998; and (c) summer 1999. Strain rates are calculated for the centre of each strain triangle (marked with crosses and numbered), and then interpolated across the region covered by the stake network. Positive (negative) values indicate extension (compression).
Mean strain rates (d–1) (longitudinal strain rate (∊ xx ), transverse strain rate (∊ yy ), vertical strain rate (∊zz) and shear strain rate (∊ xy )) for the annual period and the three seasonal periods
Force-balance components
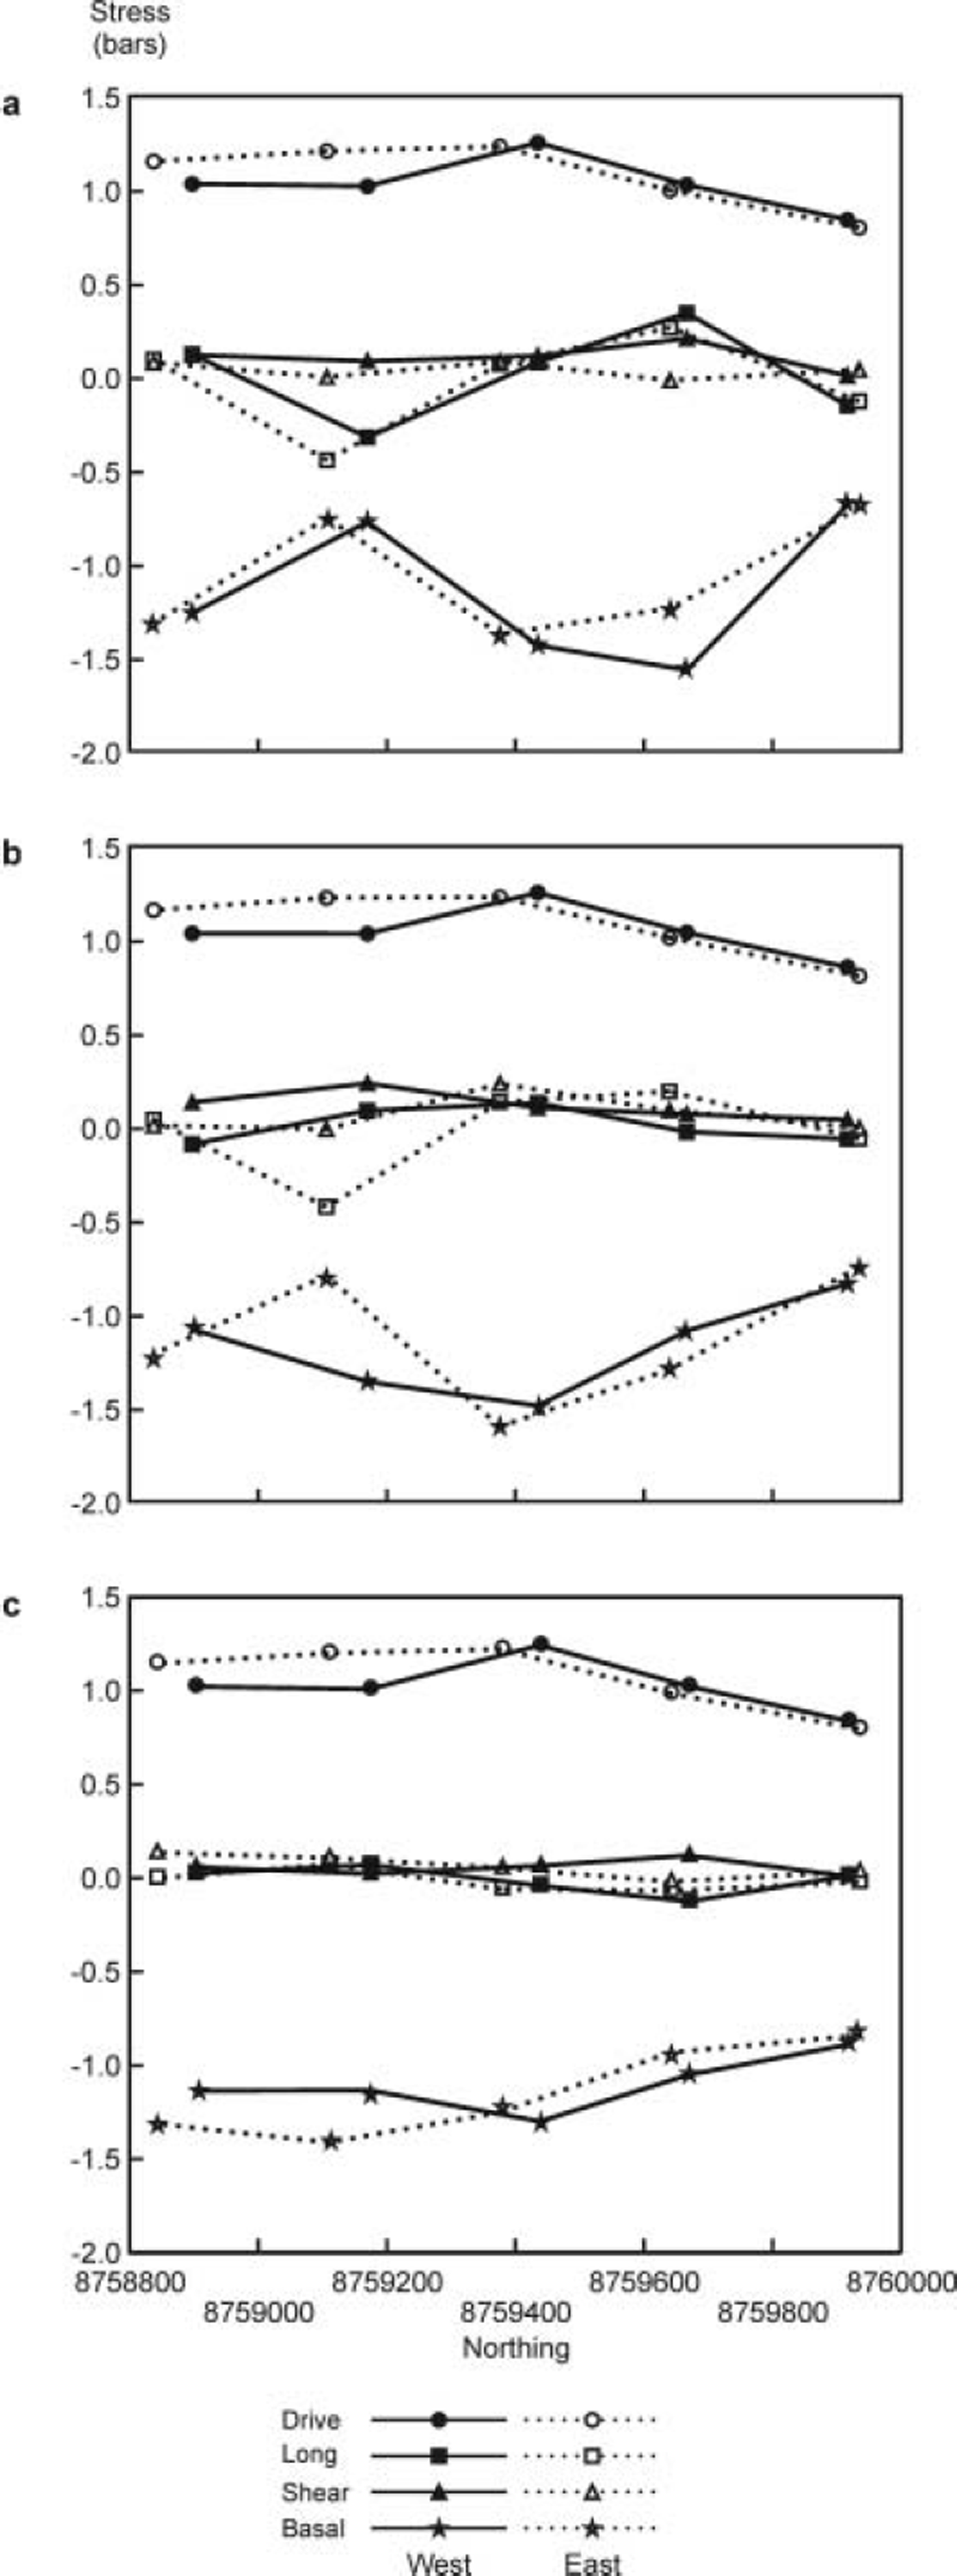
The force-balance components averaged over the three seasons are shown in Figure 5. The magnitude and pattern of force-balance components for the annual period (not shown) are very similar to the A/W/S 98/99 period (Fig. 5a). In all seasons, the local driving force was the dominant force moving the glacier forward. Driving forces increased slightly from the upper tongue to the middle tongue and then decreased across the lower tongue. Longitudinal and shear forces were generally small, but there were relatively high resistive longitudinal forces in the upper-middle tongue in the A/W/S 98/99 and S98 seasons. Basal drag was always the dominant force resisting flow, becoming more negative as driving force increased. The errors are generally small for most forces over most of the glacier for most time periods. Longitudinal and shear forces were, on average, ∼ 1 0% for the annual and A/W/S 98/99 periods, ∼5% for S99 and ∼ 3 0% for S98. Basal drag errors were lower: typically <1% for the annual, A/W/S 98/99 and S99 periods and ∼5% for the S98 period. It is useful to express the basal drag as a fraction of the driving force (τb/τd) (Reference Mair, Nienow, Willis and SharpMair and others, 2001). If τb/τd = 1 , the driving force is resisted solely by local basal drag. If τ b /τd < 1 , some resistance to flow comes from nonlocal sources, i.e. longitudinal and shear forces, and the bed may be thought of as a ’slippery spot’. If τ b /τ d > 1, flow is driven by forces in addition to the driving force (i.e. b resists more than just the driving force), and the bed may be thought of as a ’sticky spot’. The patterns of τb/τd for the three seasonal periods are shown in Figure 6. The τb/τd errors were always low, typically ∼1% for all periods, except for S98 when it was ∼5%. The magnitude and pattern of τb/τd for the annual period (not shown) are virtually identical to the A/W/S 98/99 period (Fig. 6a).
Average force-balance components for (a) autumn/winter/ spring 1998/99; (b) summer 1998; and (c) summer 1999. Closed symbols and solid lines represent western blocks; open symbols and dashed lines represent eastern blocks. x axis shows down-glacier coordinates of force-balance block centres, so the glacier terminus is to the right. See Figure 2a for block locations.
Patterns of the basal-drag to driving-stress ratio (τb/τd). Data for each force-balance block are represented by a + at a point in the centre of each block, but are interpolated and contoured over the whole stake network. Data are shown for (a) autumn/winter/spring 1998/ 99; (b) summer 1998; and (c) summer 1999.
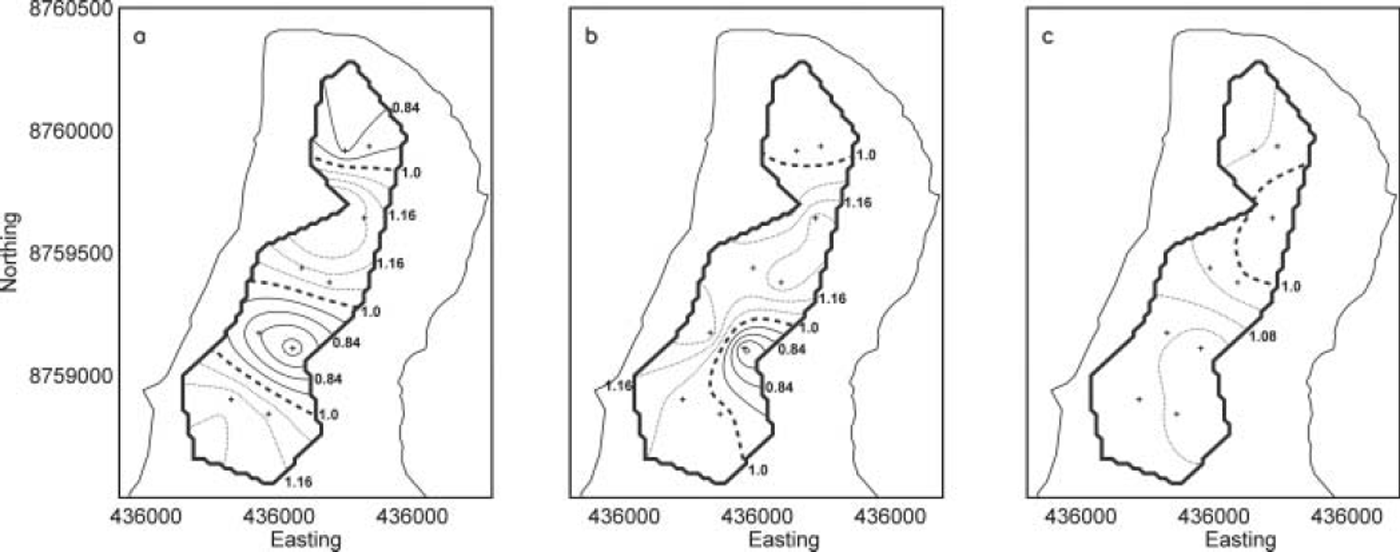
In A/W/S 98/99 and S98, patterns of basal drag are very similar (Fig. 6a and b). The dominant feature is a slippery spot in the upper-middle tongue, restricted to the eastern side of the stake network in S98 but extending across to the western side in A/W/S 98/99. This is associated with the high longitudinal forces acting up-glacier resisting some of the driving forces (Fig. 5b). Immediately down-glacier is a sticky spot in the middle-lower tongue, again particularly marked on the eastern side in S98 but more uniformly distributed across-glacier in A/W/S 98/99. Finally, there is a slight slippery spot across the lower tongue. By contrast, in S99 basal drag was everywhere fairly close to the driving stress and was more uniformly distributed across the glacier compared to the earlier time periods. There is a suggestion of a slight slippery spot in the middle-lower tongue towards the eastern side of the stake network, with slightly sticky regions elsewhere.
Controls on patterns of surface velocity, strain and force balance
Here, we attempt to explain the spatial patterns of surface velocity, surface strain and basal drag and their changes between seasons (Figs 3, 4 and 6). In terms of surface velocities and strain rates, the biggest seasonal differences were between A/W/S 98/99 and S98 (Figs 3a and b and 4a and b). Velocities were greater in S98 by ∼100% on the upper and middle tongue, but by ∼900% on the lower tongue. The higher velocities in S98 were associated with the creation of a zone of longitudinal extension, which ran diagonally across the upper to middle glacier from southwest to northeast (Fig. 4a and b). This produced the zone of longitudinal compression down-glacier across the middle to lower glacier that was higher than that in the A/W/S 98/99 period (Fig. 4a and b). This tentatively suggests that the higher S98 velocities in the upper to middle glacier were locally forced, involving rapid sliding/bed deformation, whereas those in the middle to lower glacier were non-locally forced, involving increases in ice deformation rates.
This is corroborated to some extent by the patterns of basal drag, which suggest that in S98 a slippery spot existed beneath the upper-middle tongue towards the eastern side of the stake network, in the central part of the glacier (Fig. 6b). This slippery spot is just down-glacier from the boundary between warm-based ice in the upper glacier and cold-based ice in the lower glacier (Fig. 2b) and overlies the area where subglacial hydraulic potentials route basal water from up-glacier (Fig. 2c). We envisage that subglacial water ponds in this region, subglacial water pressures are often high and fluctuating and basal drag is correspondingly low. Apart from short periods during early summer, water stored in this region in the summer is able to escape relatively quickly through the cold-based lower glacier to emerge at the snout in the form of a pressurized upwelling (Reference Rippin, Willis, Arnold, Hodson and BrinkhausRippin and others, 2005). We envisage that for most of the S98 summer, water was confined to a relatively narrow subglacial drainage axis as it flowed in a relatively channelized drainage system at relatively low pressures beneath the mid- to lower tongue; this region therefore acted as a sticky spot (Figs 2c and 6b). As subglacial hydraulic potentials caused water to spread laterally beneath the snout region, the drainage system became relatively distributed, water pressures were relatively high and this region acted as a slippery zone (Figs 2c and 6b).
During the subsequent A/W/S 98/99 period, surface water inputs would have stopped, subglacial discharges declined, the relatively efficient channelized drainage system beneath the cold-based middle to lower tongue closed down, and water stored at the thermal dam would have expanded laterally across the glacier towards the margins. This may explain why the slippery zone in the upper to middle glacier grew during the A/W/S 98/99 period (Fig. 6a).
The patterns of surface velocity, strain rates and basal drag were rather different in S99 compared with the previous time periods (Fig. 6c). The upper-middle tongue slippery spot had disappeared in S99 and was now a slight sticky spot. Conversely, the large sticky region in the middle-lower tongue was now a slippery spot, but confined to the eastern part of the stake network, and the slippery zone across the lower tongue was now a sticky area. Summer velocity increases were less marked in S99 compared with S98 (8090% on the upper-middle tongue; 250% on the snout) (Fig. 3). The S99 longitudinal strain-rate pattern was very similar to the A/W/S 98/99 pattern and did not show the zones of high compression and extension observed the previous summer (Fig. 4). All this suggests that if water ponded at the thermal dam, water pressures and water-pressure fluctuations were lower than they were in S98, so basal drag was not reduced to the same extent.
We have independent evidence that subglacial water pressures were higher in early summer 1998 than in early summer 1999 (Reference RippinRippin and others, 2003). We envisage that high early-summer water pressures at the thermal dam promote rapid basal motion beneath the middle to lower tongue, perhaps by hydraulic jacking, which establishes a relatively channelized drainage system in this region in which water pressures are subsequently relatively low. Conversely, if early-summer water pressures at the thermal dam are low, the drainage system that develops down-glacier is more distributed and water pressures remain relatively high. The evidence that early-summer water pressures may have been higher in S98 than S99 is fourfold. First, snow continued to accumulate until mid-May in 1998, giving maximum snow depths of nearly 4mw.e. In 1999, maximum snow depths of ∼2-3 m w.e. were reached in late April to early May. Second, sustained melting did not begin until early June in 1998, but in 1999 it started in early to mid-May. Third, rainstorms were infrequent during May and June 1998 but were more common in 1999. Finally, the rate of change of melting was particularly marked during early July 1998, and was much greater than that occurring at any time in 1999. This suggests that in 1999 moderate melting and/or rainfall in late spring slowly delivered water to the bed; this explains the high basal drag in the upper-middle tongue. Further down-glacier, subglacial drainage pathways were gradually enlarged, allowing water to flow in a distributed drainage system at relatively high pressures during the rest of the summer; this may explain the slight slippery spot in the middle-lower tongue. In 1998, rapid melting in early summer rapidly delivered water to the bed; this explains the low basal drag in the upper-middle tongue. Down-glacier, subglacial drainage pathways enlarged quickly, perhaps involving hydraulic jacking, causing a more channelized drainage system to develop in which water pressures were relatively low for the rest of the summer; this would explain the sticky spot in the middle-lower tongue. This explanation for the differences between 1998 and 1999 is also supported by the observation that subglacially routed water first emerged to the western snout in 1998 but to the eastern snout in 1999, scenarios predicted from theoretical modelling of subglacial hydraulic potentials assuming water pressures are at ice overburden and half ice overburden respectively (Reference RippinRippin and others, 2003, fig. 9d and e). This may also explain why the lower tongue was a slippery spot in S98 (as water was routed to the west) and why the mid-low eastern tongue was a slippery spot in S99 (as water was routed to the east).
Conclusions
Polythermal midre Lovénbreen moves faster in the summer than in the autumn/winter/spring period. Over most of the tongue, surface velocity azimuths and patterns are similar between seasons, but velocity magnitudes are typically ∼100% greater in the summer. Over most of the tongue, longitudinal compression (increasing towards the snout), transverse extension and vertical extension dominate the surface strain field in all seasons. Basal drag is the main stress resisting the driving stress, and longitudinal and transverse stresses are much smaller. These findings refer to the part of the tongue that we monitored. We recognize that horizontal shear strain rates and lateral stresses may have been more important close to the glacier margins. Velocity magnitudes were slightly greater in summer 1998 than in summer 1999, and patterns of surface strain and basal drag were different between the summers, suggesting the velocity increases were caused by different mechanisms. In 1998, surface water was channelled to the bed more rapidly, creating high subglacial water pressures and a slippery spot in the upper-middle tongue. In 1999, basal drag was more uniform, no large slippery spots were created and subglacial water-pressure increases must have been less.
Acknowledgements
The work was done while D.R. was in receipt of UK Natural Environment Research Council (NERC) studentship GT04/97/ 57/FS. Additional financial support came from St John’s College, Dudley Stamp Memorial Fund, Philip Lake Fund, B.B. Roberts Fund, Tennant Fund, Worts Travelling Scholars Fund, and the Gordon Manley Prize (all Cambridge, UK). We thank N. Cox and A. Hodson for logistical help and advice in the field, E. Blyth, M. Holdaway, R. Jenkins, A. Morris and N. Rippin for fieldwork assistance, S. Lane for help with the program GAP, and D. Mair for use of, and help with adapting, his original strain-rate and force-balance programs. Radar data collected by J. Moore were used to produce the temperate ice-thickness map in Figure 2b. The useful reviews of V. Pohjola and N. Reeh helped improve the paper.



