
I. INTRODUCTION
Access to clean water is, along with energy and food, one of the most important challenges that our society will face in the near and long term future. The degradation of many organic pollutants in water can be accomplished either by biological, physical, or chemical means. The biological oxidation of pollutants is considered economically favorable, but many toxic compounds cannot be degraded by this method. Reference Ranade and Bhandari1 Physical methods such as filtration by membranes or adsorption are also widely used. Reference Mixa and Staudt2,Reference Hameed and Rahman3 However, in most cases these methods do not destroy the pollutants but only transfer them from one phase to another. Finally, chemical methods for water treatment offer a flexible and safe alternative to remove a wide variety of pollutants. Reference Daghrir, Drogui and Robert4 In particular, photocatalytic treatments are able to remove toxic organic compounds, including ecologically hazardous cyanides and other residual compounds, even at low concentrations, making this approach very suitable for the last stages of water purification. Reference Pulkka, Martikainen, Bhatnagar and Sillanpaa5 In addition, sunlight which is used to drive the chemical reaction has the potential to reduce the associated costs and make the process even more energy efficient.
In photocatalytic (PC) water treatment, the first step is the absorption of a photon in a photocatalyst or semiconductor, creating an electron–hole pair inside the material. Both charge carriers are then separated and migrate to the catalyst/water interface. Once the charge carrier arrives to the surface, the holes are trapped by H2O or OH− already adsorbed on the surface, which will produce reactive ˙OH radicals. Reference Lazar, Varghese and Nair6 Due to the excellent oxidation ability of hydroxyl radicals, they will then react with the organic molecules. In some cases, the oxidation can be continued so that hydroxyl radicals mineralize organic pollutants to the final, less harmful products. Reference Pasternak and Paz7 If the bond of the organic molecules with the surface is strong enough, they could even oxidize directly by the holes instead of the ˙OH radicals. Reference Kesselman, Weres, Lewis and Hoffmann8 However, PC faces the problem of rapid charge recombination and poor oxidation kinetics, since they are separated within the same particle or electrode, which leads to low quantum efficiency. Reference Xiaoli, Huixiang and Dahui9
Compared to PC, in photoelectrocatalysis (PEC), photogenerated charges, once generated, they are separated to different electrode materials, where they perform the catalytic process. For example, electrons migrate toward the cathode and perform a reduction reaction, while holes remain at the surface of the anode and perform an oxidation reaction. This enhances the charge carrier separation mechanism and minimizes the recombination of electron–hole pairs, thus enhancing the degradation efficiency of the chosen pollutant. Reference Liao, Lin, Zhang, Pan, Cao and Li10–Reference Selcuk, Sene and Anderson12 In this method, the photoactivity strongly depends on the material properties and configuration of the electrode, as well as the presence of an applied potential. Reference Bennani, El-Kalliny, Appel and Rietveld13,Reference Liu and Chen14
PC and PEC treatment of organic compounds has been widely developed since the first experiments by Carey et al. in 1976. Reference Carey, Lawrence and Tosine15 A wide variety of semiconductors have been studied for this purpose, such as TiO2, ZnO, or WO3. Reference Wen, Li, Liu, Fang, Xie and Xu16–Reference Smith, Ingram and Zhao20 Although these semiconductors can be used for water purification, they can only be excited under illumination of highly energetic light because of their large band gap energies. Therefore, UV light (λ ≤ 400 nm) is commonly used in PC and PEC oxidation processes. Instead of using only UV light, utilizing the entire solar spectrum is more attractive, as it increases the amount of energy that can be converted. Using sunlight to drive the photo-oxidation of organic compounds in water makes the energy balance of this process much more favorable. Solar utilization in PEC technologies may thus improve the process effectiveness without substantially increasing the costs of the water treatment.
Working toward this goal, much effort has been made to improve the optical absorption of catalysts for their photocatalytic activity, with metal, non-metal, or self-doping. Reference Hameed and Rahman3,Reference Xiaoli, Huixiang and Dahui9,Reference Fakhouri, Smith, Pulpytel, Zolfaghati, Mortaheb, Meshikini, Jafari and Arefi-Khonsari21–Reference Smith, Fakhouri, Pulpytel and Arefi-Khansari23
A simpler approach is to consider other photocatalysts based on metal oxides that are active under visible light. BiVO4, which has previously been used for solar water splitting, is a suitable candidate due to its favorable optical and electronic properties. Reference Li, He, Peña and Berlinguette24,Reference Li, Yu, Low, Fang, Xiao and Chen25 It has also been used for photocatalytic degradation of contaminants in a spindle-like structure modified by polyaniline (PANI/BiVO4), as a nanostructured electrode, and in a heterostructure as a photocatalyst for dye degradation. Reference Abdi, Han, Smets, Zeman, Dam and Krol26–Reference Hou, Yang, Li, Tan and Yuan28 The advantage of BiVO4 over TiO2 is its lower band gap energy (2.4 eV versus 3.2 eV, respectively), allowing more absorption of the solar spectrum. In addition, BiVO4 thin films are relatively easy to manufacture and handle, since they can be simply deposited by spray pyrolysis. Reference Abdi, Firet and Krol29 Furthermore, BiVO4 can be combined with light trapping structures such as surface texturing, already widely applied in solar cells, which are used to enhance the light absorption on thin films, reducing the need of thick absorber films. Reference Yang, Van Swaaij, Tan, Isabella and Zeman30,Reference Han, Abdi, Krol, Liu, Huang, Lewerenz, Dam, Zeman and Smets31
In this paper, we propose BiVO4 as a photoelectrode for the oxidation of phenol in water. Phenol has been chosen as a representative organic contaminant due to its toxicity at high concentrations, potential harm at low concentrations, and its easy detection using a UV/Vis spectrophotometer. Reference Grabowska and Reszczynska32
Due to the novelty associated with BiVO4 in the water treatment field, this study focuses on characterizing the BiVO4 film properties to explain the suitability of the material for PEC water treatment using solar illumination. The performance as a photoanode for water treatment is associated with the optical, electrical, and catalytic properties of BiVO4. Absorption spectrophotometry characterizes the optical properties of the semiconductor. The electrical properties, which affect the charge separation process, were determined by EIS, dark conductivity, and cyclic voltammetry measurements. Atomic force microscopy (AFM) was used to characterize the surface morphology of the photoelectrodes, which is also an important feature affecting the chemical activity. Furthermore, since the internal structure of the atoms can affect all of these properties, x-ray diffraction (XRD) measurements were conducted to determine the crystal phase composition of the films. Finally, the suitability of the films for water treatment was tested by determining the incident photon to current efficiency (IPCE) and the efficiency of this photocatalyst for phenol oxidation. The photoactive characteristics of BiVO4 were compared with TiO2, one of the most widely used semiconductors for photocatalytic water treatment. Reference Grabowska and Reszczynska32,Reference Wu, Ling, Liu and Huang33 In addition, a gradient doping of BiVO4 with tungsten (W) was studied to improve the charge separation in the material. This improvement can potentially promote the photocatalytic activity and degradation efficiency, as already shown for the case of solar water splitting. Reference Abdi, Han, Smets, Zeman, Dam and Krol26,Reference Abdi, Firet and Krol29
II. MATERIALS AND METHODS
A. Fabrication of the BiVO4/FTO and TiO2/Ti composite electrodes
1. BiVO4 fabrication
The BiVO4 thin films were synthesized via spray pyrolysis. The substrate was commercial Asahi UV-type (textured glass with an FTO coating), and it was cleaned using a sequence of acetone and isopropanol solutions. Prior to BiVO4 deposition, a thin layer of 5 nm SnO2 was deposited to avoid recombination in the FTO/semiconductor interface. For the BiVO4 thin film spraying, a precursor solution was needed. The precursor solution was made by mixing a 19.4 g/L Bi(NO3)3·5H2O (98% Alfa Aesar) solution in acetic acid (AcAc) (98% Sigma Aldrich) with a 1.7 g/L V(AcAc)2 (99% Alfa Aesar) solution in absolute ethanol (Sigma Aldrich) in equimolar quantities. This solution was then pumped through a nozzle and sprayed onto the substrate, which was 20 cm away from the nozzle and kept at a temperature of 450 °C. Each spray cycle consisted of 5 s of spraying at a rate of 0.2 mL/s followed by a 55 s idle to allow the solvents to evaporate off the substrate, leaving behind BiVO4. After deposition, the samples were annealed in a furnace with air. The temperature was raised to 450 °C at 5 °C/min and then maintained for two h. By modifying the spray time, different thicknesses were deposited (200, 250, 300, and 350 nm). The contacts were deposited as a 300 nm stripe of aluminum on the TCO by an electron beam physical vapor deposition (EBPVD). To fabricate tungsten (W)-doped BiVO4 with gradient doping from 1% W in contact with the TCO to 0% W at the surface, the precursor solution was made with a 1% W content, and then V containing solution without W was added in steps. When depositing 1% W-doped BiVO4, W(C2H5O)6 was added to the VO(AcAc)2 solution prior to the mixing with the Bi(NO3)3 solution.
2. TiO2 fabrication
TiO2 film electrodes were manufactured and prepared by Magneto special anodes B.V. (Schiedam, The Netherlands) according to the paint-thermal decomposition method. Reference Grabowska and Reszczynska32 Electrodes coated with TiO2 film were prepared by applying a layer of a solution containing an organic, solvent-based titanium oxide precursor on a flat titanium substrate. After air drying for a several hours, the support with paint was transferred to an air-circulating oven for its first heat treatment at temperatures between 400 °C and 600 °C for two hours. This heat treatment decomposed and oxidized the salt, giving an oxide layer. Up to six layers of paint were applied first, followed by drying and heat treatment for all the applied layers. Reference Beer34 The TiO2 film electrodes were further modified by an annealing process, to gain the optimal ratio of anatase to rutile crystals in the TiO2 structure. Reference Bennani, El-Kalliny, Appel and Rietveld13 The annealing treatment of the TiO2 film was carried out in a furnace (NeyTech Vulcan Benchtop Muffle Furnace 3–550, Cole-Parmer, Schiedam, The Netherlands), according to the procedures already used in a previous study. Reference Bennani, El-Kalliny, Appel and Rietveld13 The TiO2 film was annealed for five hours at ambient pressure at 650 °C, and the temperature was ramped up at 8 °C/min from room temperature. The final thickness of the TiO2 was 2.04 μm and anatase to rutile ratio (A/R) was 82/18. Reference Bennani, El-Kalliny, Appel and Rietveld13
B. Material characterization
1. X-ray diffraction (XRD)
For the BiVO4 and TiO2 films, quantification of the phase proportions was carried out by XRD (Bruker D8 Advanced diffractometer Bragg–Brentano with graphite monochromator and Vantec position sensitive detector; Bruker Corporation, Leiderdorp, The Netherlands). Reference Datye, Riegel, Bolton, Huang and Prairie35 The analyses for the TiO2 film were done using the method described by Spurr and Myers, which utilizes the ratio of the rutile (110) peak at 27.355 Θ2 to the anatase (101) peak at 25.176 Θ2. The x-ray film diffraction patterns were obtained using the Bruker D8 Discover with Eulerian cradle (Bruker Corporation), goniometer radius 300 mm. Reference Li, Li, Fan and Sun36 The BiVO4 measurements were coupled Θ–Θ2 scan 10–110° with step size 0.034° Θ2.
2. Absorbance spectrophotometry
The optical properties were determined by measuring the reflectance, transmittance, and absorbance using the spectrophotometer PerkinElmer Lambda 950 UV/VIS (PerkinElmer, Waltham, Massachusetts). The optical band gap of the material was determined using a Tauc plot. Reference Tauc, Grigorovici and Vancu37 In this method, (αhν)2 is displayed against hν, in which α is the absorption coefficient, h is Planck's constant, and ν is the frequency. Such plot shows a distinct linear regime that corresponds to the onset of the absorption. By extrapolating this linear trend to the abscissa, the energy of the optical band gap is determined.
3. Atomic force microscopy (AFM)
Surface roughness was measured by AFM (NTMDT Ntegra, Moscow, Russia). Commercially available tips (Digital Instruments standard tips) were used and the surface was imaged in tapping mode. The BiVO4 films deposited on textured glass were investigated. The roughness of the film surface was quantified by means of a statistical data analysis of AFM images. The most used parameters in characterizing the surface topography are the average roughness (R a) and the root mean square roughness (RMS). The RMS roughness takes the mean squared absolute values of the surface roughness profile, making it more sensitive to peaks and valleys than the average roughness. RMS is particularly used to study temporal changes in the creation of a new surface as well as spatial differences when studying the surface feature using different scales. Reference Saranya, Pandiarajan, Jeyakumuran and Prithivikumuran38
C. Photoelectrochemical measurements and experiments
1. Incident photon-to-current conversion efficiency (IPCE)
To estimate the maximum possible conversion efficiency and gain more insight about the limiting factors in the photoelectrodes, IPCE was measured. The IPCE represents the fraction of incident photons that is converted to electrons (that are used to drive catalysis for PEC) and can be measured in the external circuit as a function of wave length. An incident light beam from a Newport 6902,150 Watt Xe gas discharge lamp was modified to a single wave length by a Oriel Cornerstone 130 monochromator (Oriel Instruments, Stratford, Connecticut) and a Keithley 236 source. The measurement was done for a wave length range from 300 nm to 600 nm with a step size of 6 nm. The photocurrent was measured with respect to the wave length of the incident light. The potential applied during this measurement is 1 V versus Ag/AgCl. The photoelectrochemical cell used for the IPCE measurements consisted of a fused silica window through which the incident light entered. The working solution was contained in the central chamber into which the platinum counter electrode (CE) and the Ag/AgCl reference electrode were immersed via separate ports. A calibrated photodiode measured the intensity of the incident light. An EG&G potentiostat controlled the potential of the photocathode and measured the current. From the obtained photocurrent the IPCE was calculated.
2. Phenol degradation experiments
Photoelectrochemical experiments for phenol degradation were carried out in a set-up consisting of a cylindrical quartz glass reactor with an effective vessel volume of 300 mL, an external solar light source Atlas solar simulator (SUNTEST XXL+, Atlas Material Testing Technology LLC, Deerlijk, Belgium), consisting of day filter, three Xenon lamps irradiating solar light (UV300–400) with intensity of 60 W/m2 in the wave length region between 300 and 400 nm, and a three-electrode configuration. Reference Liang and Zhu11 The figure of the experimental setup can be found in the previous work. Reference Liang and Zhu11 The initial volume of the working solution was 250 mL phenol (≥99%, Sigma Aldrich) with initial concentration of 20 mg/L. Demineralized water (RiOs 5 Reverse Osmosis System, RiOs Essential, Amsterdam, The Netherlands) was used throughout the experiments for dilution. To eliminate the influence of solution resistance, 14.2 g/L Na2SO4 was chosen as the supporting electrolyte because it is an inert electrolyte which does not produce any reactive species during the photo(electro)lysis, except under special conditions where it may generate persulfate. Reference Liu, Cao, Liu, Wang, Zhang, Li and Tough39,Reference Qin, Li, Tian, Wu and Cui40 It is possible that the presence of the inorganic ions in the reaction medium can modify the oxidation rate of the organic compounds as function of their nature and concentration. Reference Segneanu, Orbeci, Lazau, Sfirloaga, Vlazan, Bandas and Grozescu41 Inorganic anions can scavenge the OH radicals to form the corresponding anion radicals. Additionally, as function of the nature of the inorganic anions, at higher concentrations of 0.1 mol/L, the inhibition order of oxidation rate is the following: H2PO4 − > Cl− > HCO3 − > CO3 2− > SO4 2−. Reference Zhu42,Reference Zhu, Nanny and Buttler43 However, X. Zhu found that OH scavenging by Cl−, SO4 2− or HPO4 2− or direct oxidation of organics did not influence the reaction rate. Reference Zhu42 The 2 mL samples were collected from the reaction solution at regular time intervals (every 1 h), added to a cuvette and measured with a UV/Vis spectrophotometer to determine the absorption/residual concentration of phenol. The phenol concentration was monitored with a Hach Lange DR 5000 spectrophotometer (Hach, Düsseldorf, Germany) by using Hach Lange cuvette tests (LCK 345 with a measuring range of 0.05–5.00, 5–50 and 20–200 mg/L1, diazotized 4-nitroaniline method).
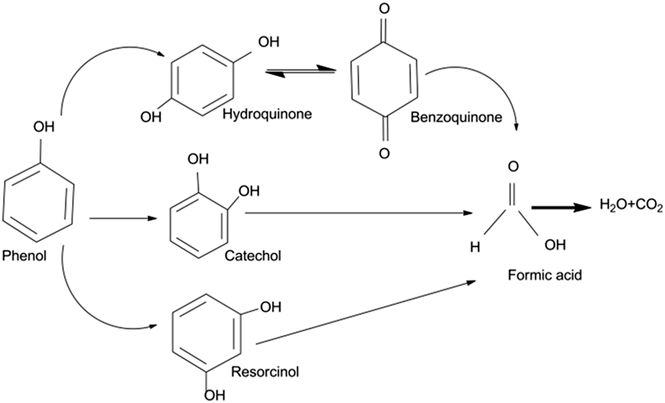
The photo(electro)catalytic degradation pathway for phenol under visible light irradiation in the presence of BiVO4 is presented in Fig. 1, showing the complete mineralization process of phenol. Hydroxyl radicals produced on the photocatalyst surface react with phenol to produce hydroquinone. In addition phenol can also react with hydroxyl radicals to form resorcinol and catechol. Reference Grabowska, Reszczyńska and Zaleska44 Hydroquinone can react with OH− to form benzoquinone. Upon extended photo-oxidation, the benzene ring can open due to continuous oxidation, leading to the formation of aliphatic compounds, like formic acid, and ultimately mineralizing to form carbon dioxide (CO2) and water upon complete oxidation. Reference Grabowska, Reszczyńska and Zaleska44
Photo(electro)catalytic degradation pathways of phenol under visible light irradiation in the presence of BiVO4.

The photoanodes used in this experiment had an active surface area of 16 cm2. At the start of each experiment, the TiO2/Ti and BiVO4 electrodes were kept in the stirred phenol solution in the dark for one hour for adsorption to reach equilibrium. A graphite plate was used as a cathode and placed at a distance of 1 cm from the anode. The pH of the solution was kept constant at 7.2 and was measured before the experiment, using a Sentix 81 pH meter (Sentix, Weilheim, Germany).
The temperature was maintained at 25 ± 1 °C by recirculating cooling water in a water bath equipped with a cooler (FL300, Julabo, Seelbach, Germany). During the experiments, the reactor was closed using a UV permeable quartz lid to prevent phenol from evaporating. The electrode potential and working current were controlled with a potentiostat-galvanostat system (Autolab PGSTAT128N with a BOOSTER10A, Metrohm Autolab, Utrecht, The Netherlands). An Ag/AgCl [0.230 V versus standard hydrogen electrode (SHE)] electrode was used as the reference electrode. Nova software provided the electrochemistry routine software, which included chronoamperometry (CA), cyclic voltammetry (CV), and EIS. The phenol photodegradation experiments using BiVO4 were performed by applying different potentials, ranging from 0 to 1.2 V (versus Ag/AgCl, KCl saturated), to determine the optimum working point. The optimal potential for TiO2/Ti composite electrode of 1 V (versus Ag/AgCl, KCl saturated) was taken from previous studies. Reference Liang and Zhu11 Dark current and photocurrent were recorded, and the net current was then calculated by subtracting dark current from photocurrent to determine the photoactivity of the films.
3. Electrochemical impedance spectroscopy (EIS)
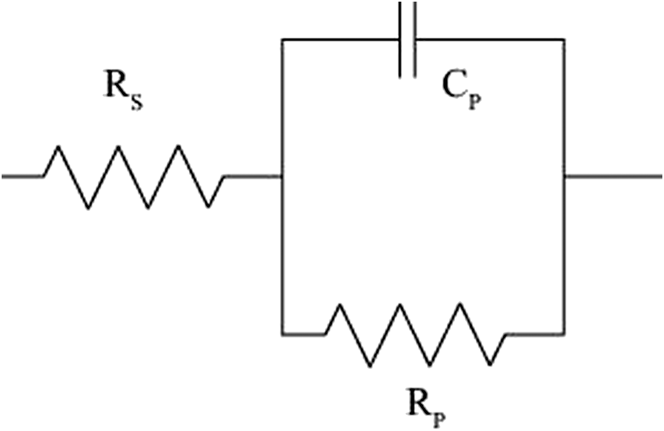
The photoelectrochemical performance is largely dependent on charge transfer and the level of recombination of the photocatalyst. Reference Balaji, Reddaiah, Reddy and Reddy45 EIS was used to analyze the charge carrier transfer and recombination processes at the photocatalyst/electrolyte interface. Reference Dumas, Basseguy and Bergel46 Impedance is represented as a complex number, where the reactance is the imaginary part and the resistance is the real part. The real part is plotted on the x-axis and the imaginary part is plotted on the y-axis. Reference Balaji, Reddaiah, Reddy and Reddy45 The EIS was conducted while maintaining a direct current voltage between the working electrode and the reference electrode. EIS was performed at a potential of 1 V versus Ag/AgCl, with a perturbation amplitude of 0.1 V and in the range of frequencies from 105 to 0.01 Hz. The values were measured in both dark and light periods. To interpret the EIS data, the electrochemical system was simplified to an equivalent electrical circuit model. This model uses a combination of resistance, capacitance and other electrical elements, which have a clear physical meaning, related with the response of the electrochemical system. Reference Grabowska, Reszczyńska and Zaleska44 In this work the characteristic equivalent circuit model presented in Fig. 2 was used. The simple circuit consists of a series resistor (R s) connected to a resistor (R p) and capacitor (C p) in parallel. This circuit model has been used to describe a similar EIS responses. Reference Park, Kim, Kim, Kim, Kim, Chang, Park and Chang47
The equivalent circuit model representing the EIS response of the films.

The impedance is expressed in a Nyquist plot. The left intersection with the x-axis is the solution resistance (R s, Ω) and the diameter of the semicircle is the charge-transfer resistance (R p, Ω).
The double-layer capacitance is equal to:
 $${C_{{\rm{dl}}}} = {1 \over {\omega \cdot {R_{{\rm{ct}}}}}}\quad ,$$
where ω = 2Пf is the angular frequency and f [Hz] is the frequency at the top of the semicircle. Reference Park, Kim, Kim, Kim, Kim, Chang, Park and Chang47
III. RESULTS AND DISCUSSION
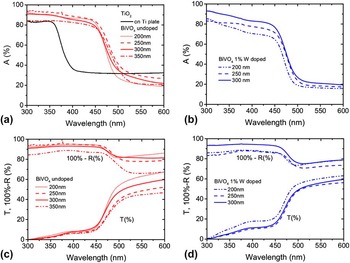
The performance of BiVO4 as a photoanode for water treatment depends partly on the optical properties of the material. The light absorption of the different photocatalysts studied is shown in Fig. 3, as well as the reflectance and transmittance of each sample. Using a Tauc plot, it was determined that the optical band gap of the undoped BiVO4 is 2.47 ± 0.02 eV, while TiO2 has a band gap of 3.30 eV. The band gap energy of the 1% W gradient doped samples (2.53 eV) was found to be slightly bigger than the one for undoped BiVO4 (2.47 eV). At longer wavelengths than those corresponding to the band gap (lower energies), the observed absorption is attributed to the substrate, namely FTO coated textured glass for BiVO4 and Ti plate for the TiO2/Ti composite. This would explain the much higher values in the case of the TiO2/Ti. Regarding the thickness of the BiVO4 films, it could be expected that the thicker the film, the higher the light absorption. However, in this case the highest light absorption was obtained with a 250 nm BiVO4 sample. The slightly lower absorption in the thicker 300 nm BiVO4 could be explained by the reflection and transmittance measurements [Fig. 3(b)]. The reflection of the 300 nm BiVO4 was higher with respect to the other two thicknesses, suggesting that at 300 nm the surface structure could have changed, as also can be seen for the 350 nm sample, leading to an increased reflectance and reduced light absorption. This effect was seen in all three samples made of undoped 300 nm BiVO4 film and not in the samples made at other thicknesses. However, the phenomenon of higher reflectance at certain thicknesses was not observed in the case of tungsten (W) doped BiVO4 samples [Fig. 3(a)], in which the light absorption follows the trend of the increasing thickness of the film.
Absorption of light on (a) both TiO2/Ti composite and undoped BiVO4 films, (b) and 1% W gradient doped BiVO4 films, and reflectance and transmittance of (c) undoped and (d) 1% W gradient doped BiVO4 at different wavelengths.

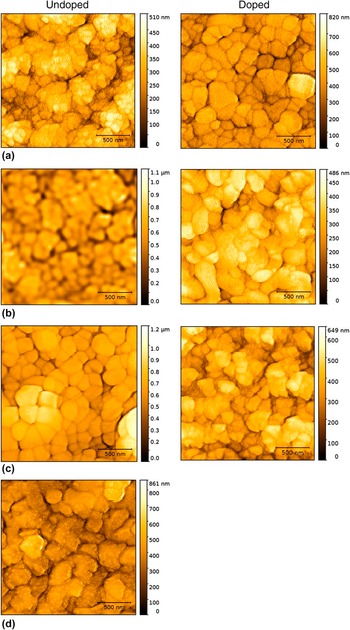
It is known from the photovoltaic field that the surface texture highly affects the optical properties of devices, especially of thin film devices. Reference Dumas, Basseguy and Bergel46,Reference Yang, Van Swaaij, Tan, Isabella and Zeman30 Therefore, to assess the role of the surface roughness on the optical properties seen in the absorption measurements, AFM measurements were performed. In addition to the optical effects, the semiconductor surface area is also important for the electrode activity, since the area in contact with the electrolyte should be increased to enhance the number of catalytically active sites. Thus, a higher surface area will generally translate into higher reaction rates. Figure 4 shows the AFM measurements of the different BiVO4 samples to determine how the surface characteristics change with thickness and doping. It can be seen that the surface roughness of undoped samples increases with thicknesses up to 300 nm and the decreases. These differences add to the hypothesis that varying surface texturing at different thicknesses affects the optical properties. The relatively flat roughness of the undoped 350 nm sample would correspond to the relatively high reflectance with respect to the other samples seen in Fig. 3(c).

AFM scans from the different thicknesses (a) 200 nm, (b) 250 nm, (c) 300 nm and (d) 350 nm for 1% gradient W doped and undoped BiVO4.

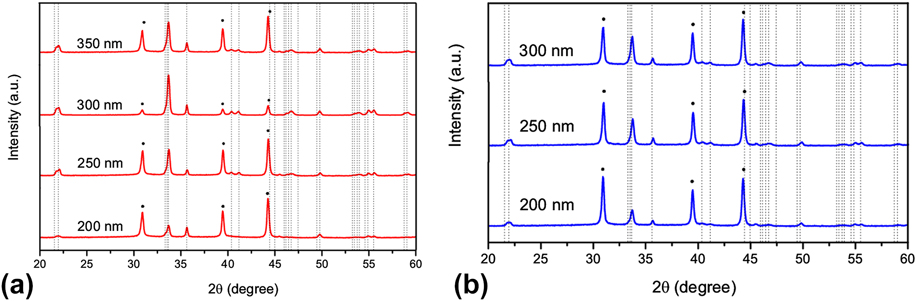
The reasons for this surface change might be related to the phases present in the film. To determine that, the crystal structure was studied. The crystal properties of the films were determined using XRD. The two possible structures for the synthesized BiVO4 are tetragonal crystals or monoclinic scheelite. Reference Yan, Li, Aberle and Venkataraj48 Monoclinic scheelite has more local distortion, which is claimed to result in a higher photocatalytic activity due to an increase in local polarization. Reference Tokunaga, Kato and Kudo49 Fig. 5 shows the XRD pattern of doped and undoped BiVO4 at different thicknesses, where the vertical lines represent the characteristic peaks of monoclinic scheelite and the dots represent the FTO peaks. Reference Abdi50 The interpretation of these samples suggests that the amount of monoclinic scheelite increased when the thickness of the sample increased up to 300 nm, being especially noticeable for the undoped samples. That could also explain the differences in reflection and transmission seen in Fig. 3(b). The crystal structure depends on the heating process during fabrication and subsequent annealing. Reference Mixa and Staudt2 This phenomenon may thus be caused by the fact that thicker samples have a longer deposition time, and therefore they are exposed to high temperatures for a longer time. Additionally, inhomogeneities in the annealing process due to the possible temperature profiles could have an effect on the crystal structure.
XRD pattern of samples of BiVO4 (a) undoped and (b) 1% W gradient doped on FTO. The dotted peaks represent the FTO peaks and the vertical lines represent the monoclinic scheelite peaks. The intensity of the XRD signal has been adapted to fit in the graph, but it must be noted that the signal of all the FTO peaks is approximately the same in all cases since the substrate is the same, and thus they must be taken as a reference.
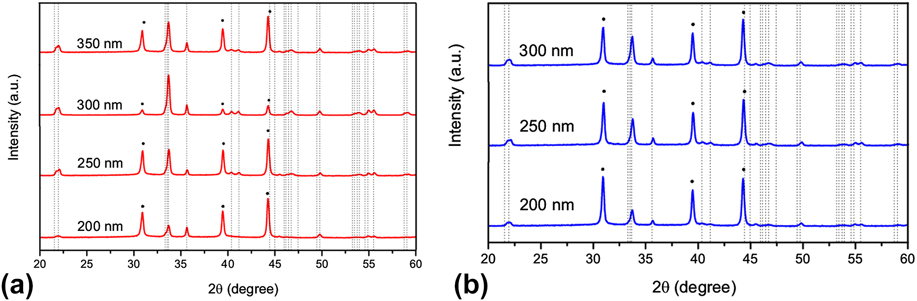
From these values, it can be seen what the 300 nm undoped BiVO4 presents a much higher monoclinic scheelite peak than the rest of the samples, suggesting that at 300 nm, a phase change occurred, showing a bigger amount of monoclinic scheelite in the film. Also, it is important to note that the 1% W gradient doped samples have a lower peak height than the undoped samples, suggesting that the W doping affected the crystal properties of the material. In addition, a slight increase of the peak intensity of the 1% W doped samples can be observed with increasing thicknesses.
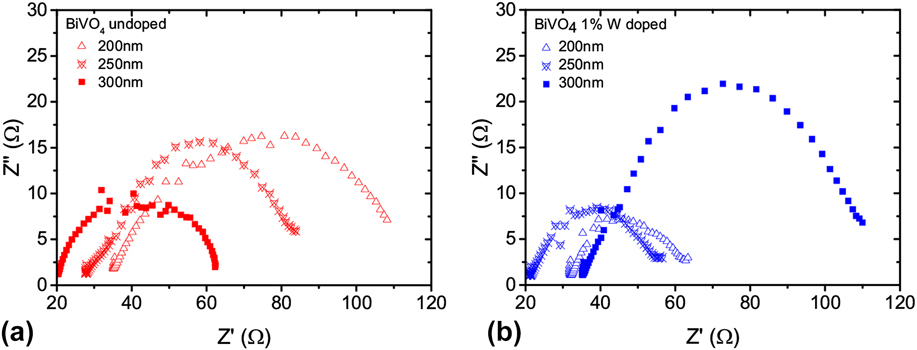
Since BiVO4 is being used as a photoelectrode, the PEC oxidation process involves not only the optical and surface properties, but also the electrical properties. Figure 6 shows the Nyquist plot of the undoped and doped BiVO4 thin films. The doped samples mostly showed a lower Z″ for lower thicknesses compared to the undoped samples, which is related to the improved charge carrier separation by the electric field created inside the film with doping. However, the resistance in the 300 nm doped samples is the highest among all the samples. That is associated with the increase of defects by doping and the reduction of the diffusion length of the charge carriers. Regarding the thickness dependence of undoped samples, the resistance to charge transport reduced with increasing thickness, especially in the case of 300 nm. This might be related to a higher conductivity of the monoclinic scheelite. However, for doped samples the resistance to charge transfer increased with increasing thickness. When introducing doping, more defects were created in the film, reducing the diffusion length of the charge carriers inside the material which thereby increases the Z′ impedance.
EIS measurements of (a) undoped BiVO4 and (b) 1% W gradient doped BiVO4 samples in phenol solution under solar light.
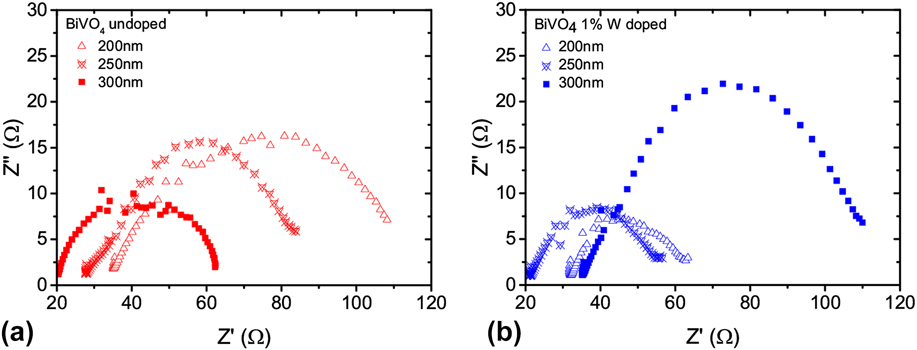
Another outcome from the EIS study is related to the solution resistance (R s). Despite the solution being the same in all cases, there is a shift in the origin of the curve [Figs. 6(a) and 6(b)] related to variations in R s. These changes are associated with variations in the surface because of structural changes in the material phase, as shown previously.
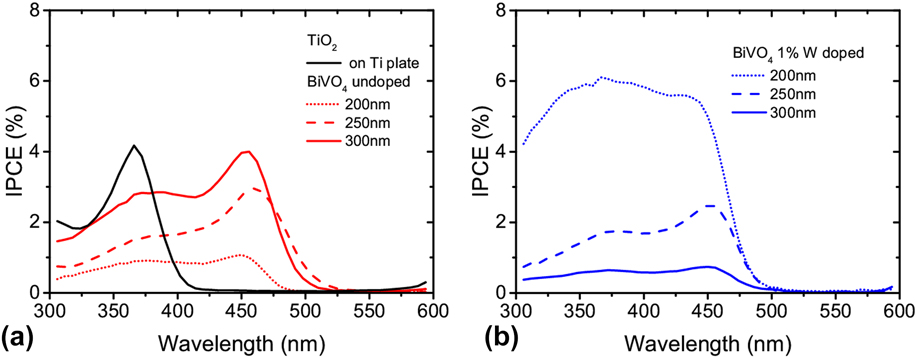
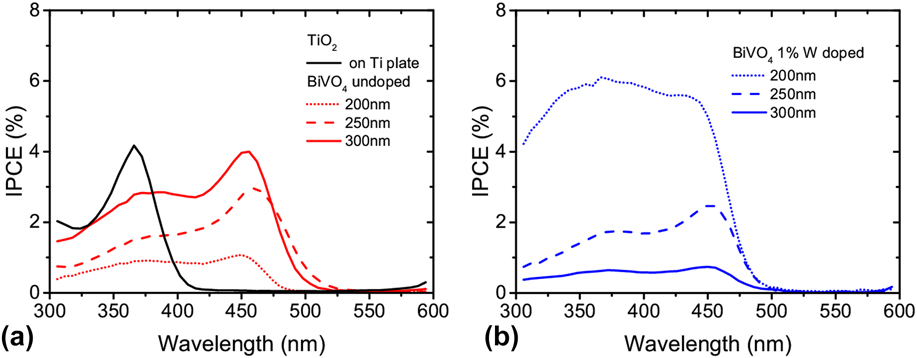
Finally, the photoresponse of BiVO4 is an important measure to determine how well the optical and electrical properties translate into the actual photoelectrochemical performance. Due to the electrical defect structure of the material, not all the energy of an absorbed photon was converted directly into current. The IPCE, shown in Fig. 7, gives more information about the actual conversion efficiency from photons into current that is used in the chemical reaction. Due to the band gap of each material, TiO2 produced a measurable current only at wavelengths lower than 400 nm, with a peak at a wave length between 350 and 370 nm [Fig. 7 (a)]. Undoped BiVO4 films showed a peak around 450 nm, due to its lower band gap energy compared to TiO2. Increasing the thickness of the undoped BiVO4 film increased the IPCE response due to the higher light absorption of the material. The doped samples showed a better IPCE response for the 200 nm, mainly due to the enhancement of the charge carrier separation. However, when the thickness is increased, the IPCE decreased. This could be the sign of electron transport loss occurring by enhanced electron generation at higher BiVO4 loading and doping. The mentioned phenomena reflect that there is an additional resistance between interconnected BiVO4 structures and doped elements which can be seen in Fig. 6(b) as an increase in impedance with increase of the thickness layer, suggesting a higher recombination of the charge carriers. Reference Son, Seo, Kim, Hong, Kim, Park, Prabakar and Kim51
IPCE measurements for (a) TiO2 and BiVO4 undoped and (b) BiVO4 1% W gradient doped electrodes using front illumination.
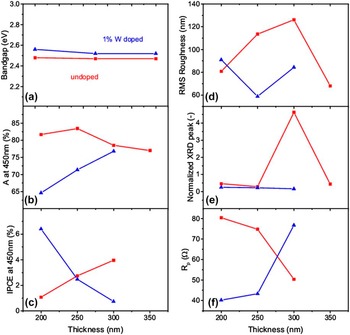
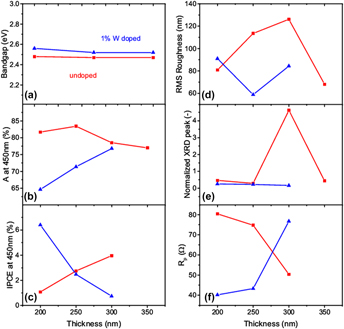
The optical, structural, and electrical properties have been summarized in Fig. 8. The absorption and IPCE values shown in this graph are taken at a wave length of 450 nm because, since it is slightly above the band gap energy, it can be used as a comparison of the absorption for the different samples. To compare the different XRD measurements, the monoclinic scheelite peak at 35.68 degrees has been normalized with the FTO peak at 30.92 degrees. These peaks have been chosen as representative of the amount of monoclinic scheelite in BiVO4 because of their unlikely interaction with other peaks.
Summary and comparison of the measured properties for both 1% W gradient doped (blue) and undoped BiVO4 samples (red). (a) Optical band gap, (b) absorption taken at a wave length of 450 nm, (c) IPCE taken at a wave length of 450 nm, (d) RMS roughness, (e) XRD monoclinic scheelite peak normalized with the FTO peak, and (f) R p electrical resistance calculated from EIS measurements.

It can be seen in Fig. 8(a) that the optical band gap does not significantly change with thickness or doping. The absorption at a wave length of 450 nm increased with thickness for the doped samples, but showed a maximum at 250 nm for the undoped samples. The peaks at 300 nm in the RMS roughness and XRD peak suggest that there was a change in the structure and surface morphology after 300 nm that translate in a reduction of absorption and increase in reflection. The IPCE measurements showed an increase with thickness for undoped samples and a decrease for 1% W gradient doped samples. These results are in agreement with the EIS measurements, which showed a decrease in electrical resistance in undoped samples with thickness, and an increase in 1% W gradient doped films. This suggests that the doping profile introduced more defects in the material, creating new recombination centers, without enhancing the charge carrier separation.
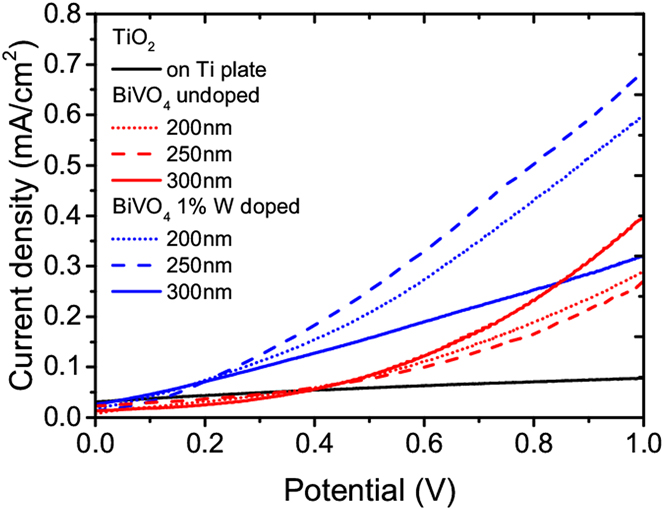
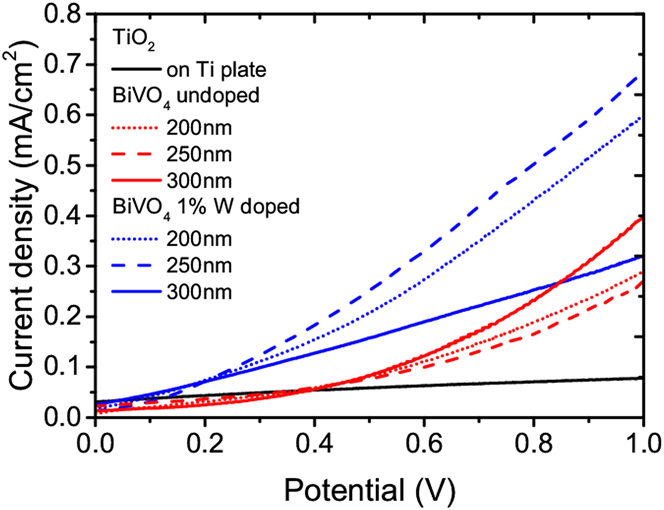
The current density versus potential (JV) plots of the photodegradation of phenol give more information on the optical, electrical, and catalytic properties of the photoelectrodes. Figure 9 shows that the BIVO4 doped samples had the best JV characteristic, i.e., they demonstrate the lowest onset potential and highest current densities, followed by the BiVO4 undoped samples and finally the TiO2 samples. For undoped samples, the current corresponds with the fraction of monoclinic scheelite in the film, having 200 and 250 nm similar currents while the 300 nm shows a higher current. For the doped samples, the currents are higher due to the superior charge separation strategies. The current density increased from 200 nm to 250 nm due to the enhanced light absorption, and decreased after 250 nm due to the higher recombination caused by the doping, as seen in the EIS measurements. In this case, the crystalline structure does not play a big role because the fraction of monoclinic scheelite in all 1% W gradient doped samples was similar, as shown by the XRD measurements.
JV characteristics for the doped, undoped BiVO4 and TiO2 samples.
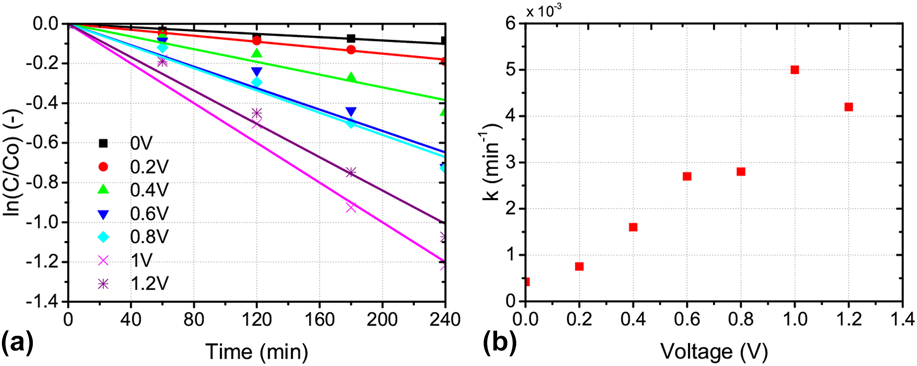
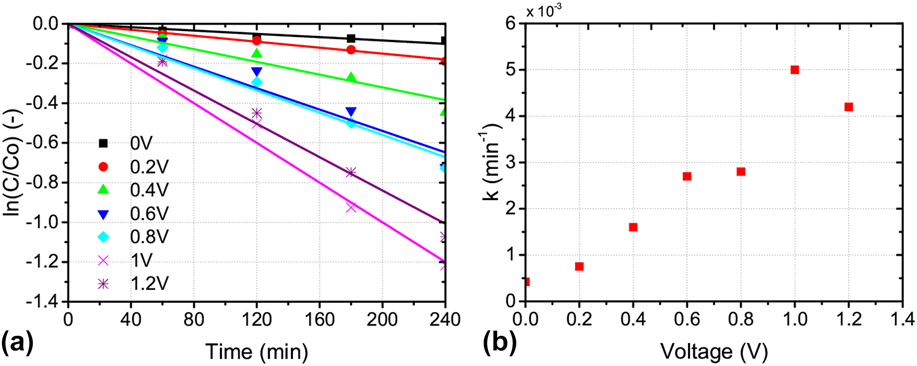
However, a higher current density does not automatically translate in an improvement of the phenol degradation characteristics, and the actual degradation achieved must be measured. To perform degradation experiments, the optimum applied voltage was determined by using the undoped 300 nm BiVO4 sample and by determining the highest kinetics of the phenol degradation reaction. Figure 10 shows the effect of the applied potential E on the first-order degradation rate constant k of phenol using the 300 nm BiVO4 electrode after solar irradiation for four hours. The experiments were conducted by applying electrical biases of 0, 0.2, 0.4, 0.6, 0.8, 1, and 1.2 V (versus Ag/AgCl, KCl saturated). The applied potential causes an increase in the charge carrier separation. The rate constants of the phenol degradation with different constant potentials, k, were calculated through the linear relationship between ln([C6H6O]/[C6H6O]o) and time. Figure 10(b) shows that when the applied bias potential was low (<1.0 V versus Ag/Ag/Cl), the degradation rate constant increased with the applied potential. A further increase in the applied potential beyond 1 V versus Ag/AgCl led to a decrease in the first-order degradation rate constant, possibly due to competing reactions such as water splitting. The data showed that at the potential of 1 V versus Ag/AgCl, the highest constant rate of phenol degradation was obtained. Therefore, this potential was used in further degradation experiments.
(a) Corresponding kinetics plots for first-order reaction of phenol degradation rate constant for the undoped 300 nm BiVO4 photoanode at different applied potential; (b) rate constant k achieved as a function of a potential.
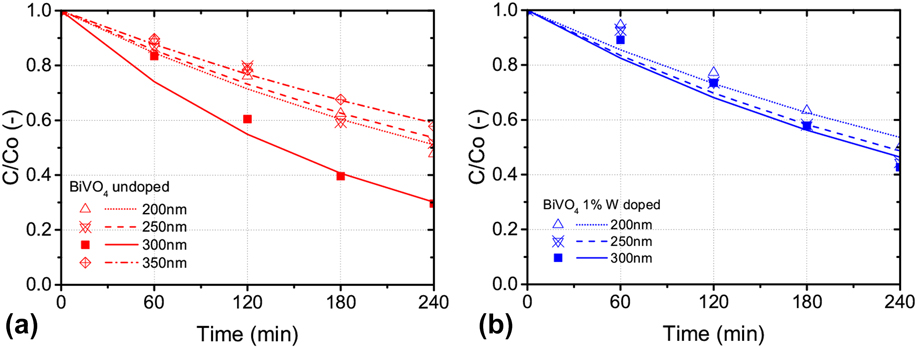
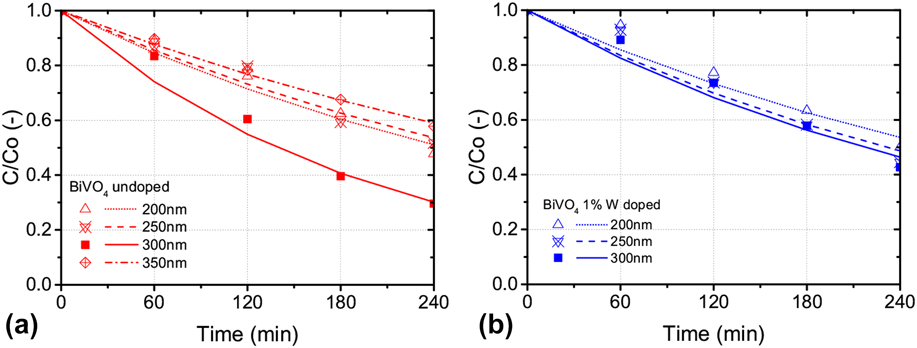
When the phenol degradation is measured at 1 V versus Ag/AgCl at different thicknesses, undoped samples [Fig. 11(a)] showed the maximum performance at 300 nm, after which the fraction of monoclinic scheelite decreased, affecting the phenol degradation. Increasing the thickness of the doped samples [Fig. 11(b)] improved the performance, which is in agreement with IPCE. However, the differences between 250 and 300 nm were small, suggesting that there is a saturation point after which a thicker film does not improve the phenol degradation any more. The main reason for this improvement with thickness is the enhanced light absorption and conversion efficiency. EIS measurements showed a higher resistance for the thicker films in the 1% W gradient doped case, which is not reflected in the phenol degradation characteristic, suggesting that the electrical properties are not the limiting factor in this case. The observed optimal thickness was 300 nm, both for doped and undoped samples, which balances the trade-off between good optical properties with good electrical properties. The results suggest that the monoclinic scheelite crystal structure could be the preferred one for degradation, since it shows better optical, electrical and catalytic properties both on the surface and in the bulk of the material. For the photodegradation experiments pure photobleaching was excluded as previous work on photoluminescence (PL) and use of terephthalic acid (TA) has shown the qualitative determination of ˙OH generated during the experiments at the surface of the catalyst. Reference Bennani, Appel and Rietveld52
PEC degradation of phenol by using BiVO4 photoelectrodes with according 1st order kinetics for (a) undoped BiVO4, (b) 1% W gradient doped BiVO4 at different thicknesses.
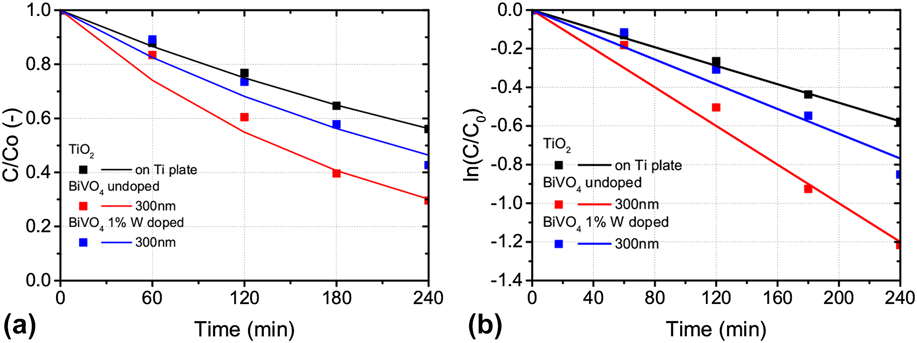
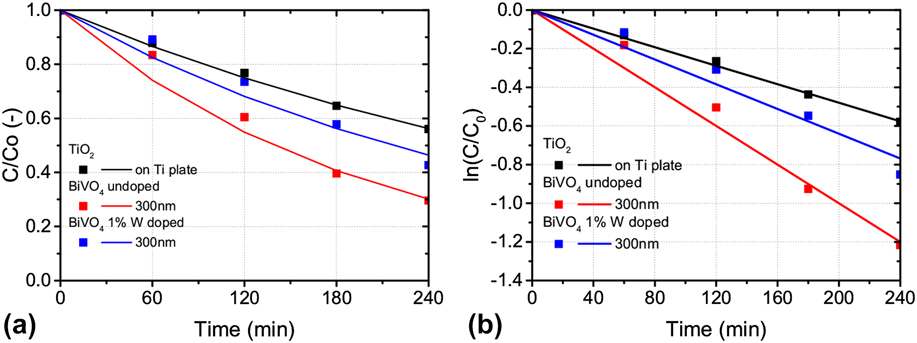
The suitability of BiVO4 as a photoanode for water treatment and the effect of doping in the material can be further determined by comparing the best thickness of 300 nm for both undoped and 1% W gradient doped BiVO4, and the performance of TiO2/Ti composite. When comparing BiVO4 and TiO2, Fig. 12 confirms that BiVO4 was more suited for phenol removal from the solution by using solar light. The optimal BiVO4, 300 nm of undoped film, was able to reduce the phenol concentration, having 30% of the initial concentration remaining after four hours, while the TiO2/Ti composite electrode was only able to reduce the concentration up to 56% of the original value during the same time span. The 1% W gradient doping appeared not to improve the performance compared to undoped BiVO4. The fitting for both 1% W gradient doped and undoped BiVO4 was obtained with a first order reaction, with R 2 values of 0.96 and 0.98, respectively. The reaction rate constants were 0.0032 min−1 for the 1% W gradient doped samples, 0.005 min−1 for the undoped samples, and 0.0024 min−1 for the Ti/TiO2 composite, confirming that the 300 nm undoped BiVO4 gives the best reaction rates. The lower performance for the gradient doped samples could be due to two effects: the additional defects introduced in the structure by W atoms, which may lead to recombination centers and therefore poor electrical properties; and the surface and structural effects, as seen by the AFM scans and XRD spectra, which lead to less favorable catalysis at lower monoclinic scheelite fractions.
Comparison of the (a) PEC degradation of phenol and (b) corresponding kinetics plots for first order reaction of phenol degradation rate constant for the 300 nm thick 1% W gradient doped and undoped BiVO4 with TiO2/Ti composite.
IV. CONCLUSIONS
BiVO4 has been proposed as a viable option for photocatalytic oxidation using solar light, as opposed to the commonly used TiO2. The material studies have shown that BiVO4, with a band gap of 2.5 eV, is a good absorber for solar light compared to TiO2. The BiVO4 thickness had an effect on the optical properties due to enhanced absorption, but also suggested a phase change between 250 and 300 nm thick films. This change in phase and surface structure was confirmed by AFM and XRD measurements. BiVO4 also showed a better phenol degradation performance compared to TiO2, confirming that the enhanced light absorption, surface properties and electrical properties translates in an increase in phenol degradation. Doping of the BiVO4 with tungsten; however, did not improve the phenol degradation performance, suggesting that charge carrier separation is not a limiting factor in this system. The best performance was achieved by an undoped BiVO4 film of 300 nm, reducing the phenol concentration in solution to 30.0% of the initial concentration in four hours.
ACKNOWLEDGMENTS
Ruud Hendrikx at the Department of Materials Science and Engineering of the Delft University of Technology is acknowledged for the x-ray analysis. Bartek Trzesniewski and Marco Valenti from the Materials for Energy Conversion and Storage (MECS) in TU Delft are acknowledged for the assistance in BiVO4 deposition and IPCE measurements.
This work is part of the research program of the Foundation for Fundamental Research on Matter (FOM), which is part of the Netherlands Organization for Scientific Research (NWO).