

The importance of diversity in political office is well documented: the presence of women and minority officials in political office is associated with political engagement and participation (Junn Reference Junn1997; Gay Reference Gay2002; Atkeson Reference Atkeson2003; Campbell and Wolbrecht Reference Campbell and Wolbrecht2006; Reingold and Harrell Reference Reingold and Harrell2010), richer political discourse (Cramer Walsh Reference Cramer Walsh and Simon Rosenthal2002), and enhanced legislative activity and political outcomes for women and minority constituencies (Saint-Germain Reference Saint-Germain1989; Phillips Reference Phillips1995; O’Regan Reference O’Regan2000; Reingold Reference Reingold2000, Reference Reingold2008; Celis Reference Celis2006; Wangnerud Reference Wangnerud2009). In the judicial context as well, diversity on the bench shapes perceptions of legitimacy among citizens (Scherer and Curry Reference Scherer and Curry2010), may alter judicial behavior and outcomes (O’Connor and Segal Reference Segal1990; Farhang and Wawro Reference Farhang and Wawro2004; Boyd, Epstein, and Martin Reference Boyd, Epstein and Martin2010), and normalizes the presence of women in positions of power (Kenney Reference Kenney2013).
Despite the importance of gender diversity in office, the use of gender as a selection criterion is controversial, particularly in the United States.Footnote 1 While many countries have turned to formal and informal gender quotas for office (Dahlerup Reference Dahlerup2008), gendered selection criteria in the United States remain contentious (Baldez Reference Baldez2006; Krook Reference Krook2006).Footnote 2 Opponents criticize quotas for dismantling merit selection and for favoring certain groups of people over others; they argue that descriptive characteristics should not be—and, presumably, absent these policies are not—salient selection criteria. This argument has been particularly forceful in the judicial context, where gender is viewed as inconsequential to one’s interpretation of the law: in the words of Minnesota Supreme Court Justice Jeanne Coyne, for example, “A wise old man and a wise old woman reach the same conclusion” (Margolick Reference Margolick1991).Footnote 3 It is possible, however, that descriptive characteristics are important features of the selection process even in the absence of quotas, especially if people are attentive to and there is pressure for diversification (see Goelzhauser Reference Goelzhauser2011, 776).
Indeed, studies indicate that gender is especially relevant for diversifying all-male courts (Bratton and Spill Reference Bratton and Spill2002), but anecdotal evidence suggests that gender matters for judicial selection on courts that have already diversified too. Specifically, there are many instances of women judges retiring and being replaced by other women judges. If gender is irrelevant in the selection process, we would only rarely observe women judges replacing women judges: given slow turnover and the historical dearth of women on state supreme courts, women replacing women by chance would be uncommon. In contrast, a pattern of women judges systematically replacing women judges would suggest a pattern of implicit reserved seats in which women replace women even though there is no formal rule requiring it. A pattern of women judges replacing women could, in turn, be net positive for gender diversity on the bench by ensuring minimum or status quo levels of diversity when a court might otherwise revert to being all male or less diverse. Or, a pattern of women replacing women could suppress diversity by limiting women judicial candidates to just one or a few seats.
In this project, I test whether women judges are more likely to fill vacancies made by women relative to vacancies made by men. Because broad structural forces such as the women’s movement have resulted in the diversification of many professions over time and are correlated with the gender of both departing and replacement judges in US states,Footnote 4 I adopt a matching design to ensure credible comparisons of judicial turnover over time and across all US states.
I find that when female judges retire, a much greater proportion of replacement judges are women relative to when a male judge retires, which means that gender is a relevant selection criterion for state supreme courts. To interpret this result, I compare rates of selection to the gender composition of lawyers over time. In the aggregate, women are selected to state supreme courts about as often as expected, given the composition of the candidate pool. This is not to say that women judges and judicial candidates do not face implicit or explicit biases that hinder the acquisition of prestigious judicial posts or burden their experiences once in office. Instead, the evidence from this analysis suggests that at the final selection stage, women are neither systematically excluded from state supreme court benches nor unfairly advantaged.Footnote 5 In the next sections, I briefly summarize the extant literature, describe the research design used to identify the pattern of women judges replacing women judges, and compare those results to patterns of diversification in the candidate pool.
Consequences and Correlates of Judicial Diversity
Scholars have debated and continue to debate the normative and empirical consequences of gender diversity in the judiciary. Some find that the presence of women on the bench alters judicial behavior and outcomes (O’Connor and Segal Reference Segal1990; Farhang and Wawro Reference Farhang and Wawro2004; Peresie Reference Peresie2005; Boyd et al. Reference Boyd, Epstein and Martin2010), while others insist that any gender differences in judging have been overstated (Kenney Reference Kenney2008; Dixon Reference Dixon2009). Others emphasize the importance of gender diversity on the bench absent any gender differences or changes in outcomes. Kenney (Reference Kenney2013, 9, 175) argues that the inclusion and continued presence of women on judicial benches is important in its own right because it “normalizes women’s authority and power” and demonstrates judicial legitimacy.
Scholars have also addressed the conditions under which women or minority judges are selected to the bench. Many focus on the relationship between selection procedure and diversity. Some find that the concentration of accountability on a unitary selector and the subsequent ability to claim credit for diverse selections is associated with greater diversity (Carbon, Houlden, and Berkson Reference Carbon, Houlden and Berkson1982; Bratton and Spill Reference Bratton and Spill2002; Williams and Thames Reference Williams and Thames2008; Valdini and Shortell Reference Valdini and Shortell2016). Others, however, find no or little effect of selection institutions on diversity (Alozie Reference Alozie1988, Reference Alozie1990; Hoekstra, Kittilson, and Bond Reference Hoekstra, Caul Kittilson, Andrews Bond, Escobar-Lemmon and Taylor-Robinson2014). Esterling and Andersen (Reference Esterling and Andersen1999) and Kenney and Windett (Reference Kenney and Windett2012) highlight the importance of variation within selection procedures, noting that the diversity of merit selection committees and the gender of governors are associated with increased efforts for diversification. Other explanations for variation in judicial diversity include the diffusion of norms across space and across institutions (Williams and Thames Reference Williams and Thames2008; Goelzhauser Reference Goelzhauser2011; Hoekstra et al. Reference Hoekstra, Caul Kittilson, Andrews Bond, Escobar-Lemmon and Taylor-Robinson2014), the selection of women to larger and less prestigious courts (Williams and Thames Reference Williams and Thames2008), the effect of legal cultures on the acceptance of women judges (Remiche Reference Remiche2015), and the role of civil law systems in promoting greater gender diversity than common law systems (Schultz and Shaw Reference Schultz, Shaw, Schultz and Shaw2013).
For the purpose of explaining the role of gender in judicial replacement, Bratton and Spill’s 2001 and 2002 studies represent an important point of departure. The authors consider how the existing gender diversity on state supreme courts affects prospects for the selection of women judges (Bratton and Spill Reference Bratton and Spill2002). They find that women are most likely to be appointed to an all-male court. Once a woman is on the bench, the probability that another woman is appointed declines. In the federal judiciary, they find that President Clinton was likely to appoint minority judges to replace minority judges (Bratton and Spill Reference Bratton and Spill2001). Although they could not replicate this pattern of replacement among Clinton appointees for women judges, anecdotal evidence from state supreme courts suggests that women judges often do replace women judges: when Martha Sosman left the Massachusetts court in 2007, her vacancy was filled by Justice Margot Borsford. When Justice Barbara Durham retired from the Washington Supreme Court in 1999, her vacancy was filled by Justice Bobbe Bridge. In California, when Justice Janice Brown was appointed to the Court of Appeals, she was replaced by Justice Carol Corrigan. There are many more examples, and these examples would be unexpected if gender were not a selection criterion. Only 243 of 1,261 judges selected between 1970 and 2016 were women. Given the historical rarity of women state supreme court judges, women should only replace women by chance very rarely.Footnote 6 This project is the first to address whether these anecdotal examples of women replacing women on state supreme court benches are systematic.
Pressure to Diversify and Patterns of Women Judges Replacing Women Judges
If gender is a relevant selection criterion and women judges are being selected to replace women judges, we should consider both the causes and effects: why might judicial selectors choose or promote women judges to replace women judges? Where state supreme court judges are elected, why might women choose to run to fill vacancies by women judges? And, has the pattern of women replacing women on the bench increased the presence of women judges, as traditional quotas aim to do, or have these patterns restricted the presence of women judges by limiting women to just one or a few seats?
There are at least two explanations for a gendered pattern of replacement on courts. For one, replacing women judges with women judges could be a tool for the continued exclusion or underrepresentation of women. From this perspective, gendered patterns of replacement create and perpetuate tokenism on the bench. By allowing but limiting the presence of women judges to one or a few specific seats, “tokenism is … symbolic equality” (Greene Reference Greene2013, 82) that outwardly demonstrates a commitment to equality without addressing the underlying social and political treatment of historically marginalized groups (Laws Reference Laws1975, 51). By limiting women judicial candidates to vacancies made by women, token seats exclude women from other vacancies and limit diversity on the bench.
Alternatively, patterns of women replacing women may promote diversity on the bench. Rather than limiting women to one or a few seats, gendered patterns of replacement may ensure diversity by promoting the selection of women when courts might otherwise revert back to all male or less diverse. This explanation for gendered replacement would be particularly beneficial for diversity when there are few women in the traditional candidate pools. The historical exclusion of women and minority individuals from higher education and posts that serve as informal qualifications for judicial office has limited and continues to limit the diversity of the candidate pool. In this setting of limited availability, patterns of gendered replacement might encourage judicial selectors to seek out those women judges who are qualified when they might otherwise select male judges.
For seats in which judges are elected, the same forces can be at play. If party officials and donors only seek out and support women candidates for judicial races to fill vacancies by women—or if they discourage women from running for vacancies made by men—they could depress the presence of women on the bench. In contrast, if party elites and donors actively seek out women to run for a vacancy made by a woman when another woman might not run otherwise, they would be promoting diversity on the bench.
From the outset, it is unclear whether gendered patterns of replacement have been beneficial for overall levels of diversity. Even if patterns of gendered replacement have been net positive for gender diversity on state supreme courts, the patterns may still have some pernicious outcomes for women (or minority) judges individually. For example, patterns of women replacing women are consistent with concepts of “tracking” in which “indirect” bias funnels women and minority officials into particular posts or types of posts (Reingold Reference Reingold2018). Women judges selected to replace women judges may also be subject to pressures of tokenism or to backlash for perceived gender-based favoritism. It is also important to note that the use of gender as a selection criterion can be explicit or implicit. Judicial selectors may actively and knowingly seek out women judges to replace women judges, but they may also do so unintentionally. Uncovering the internal motivations of judicial selectors and the experiences of individual women judges on the bench is beyond the scope of this project. Instead, I test whether patterns of gendered replacement are systematic and whether those patterns have suppressed overall gender diversity on the bench relative to a counterfactual in which gender is not a selection criterion.Footnote 7
Data and Matching
Assessing whether the gender of vacating judges and the gender of replacement judges are independent presents a few methodological challenges. First, the gender of the retiring judge is by no means the only explanation for the gender of the replacement judge, so we must isolate the effect of gender, all else equal. Second, more women have been able to accumulate the qualifications for office over time. As the feminist movement took hold and played out, citizens came to accept women on courts and—for some—expect women on courts.Footnote 8 These over-time pressures mean that women are more likely to be selected to a vacancy over time, regardless of the gender of the retiring judge. To accurately identify the effect of gender, we need to account for time trends. Finally, to determine the effect of the gender of the vacating judge, there must be vacating judges who are female. Assessing the effect of the gender of the vacating judge has only recently been possible as more women judges have been selected to and have left state supreme court benches, so we need to manage inconsistent data availability over time.
To address these methodological concerns, I do two things. First, I use nonparametric matching to generate a data set of treatment (a woman retires) and control (a man retires) cases that share theoretically and empirically important characteristics. This allows me to isolate the effect of the gender of retiring judges on the gender of replacement judges by comparing the outcome across the treatment and control groups.Footnote 9 I match on time, the number of women, court size, the number of vacancies, and selection institutions to ensure plausible comparisons across treatment and control units. Second, I use a Cochran-Mantel-Haenszel (CMH) test of proportions to determine whether the gender of the retiring judge is independent of the gender of the replacement judge. The CMH test is flexible to homogenous effects across time and other covariates and can accommodate differences in sample size across strata, which occur in the data because more women have vacated the bench in recent years. Before describing the results of the CMH test, I detail the data and the matching procedures used.
Data
The gender of judges retiring from and selected to state supreme courts comes from Kathleen Bratton’s State High Court and Justice Database.Footnote 10 The data set includes judges selected to all 50 state supreme courts between 1960 and 2010 and describes how justices were selected, when they were selected, when they retired or vacated the court, and their gender.Footnote 11 I updated the data set to include judges who retired or were selected between 2010 and 2016 with information from Ballotopedia.Footnote 12 I restrict the data to the years between 1970 and 2016 to avoid missing data in the early years.
The data are reshaped so that the unit of analysis is state-years for which a judge vacates. While it is most common for a court to have only one vacancy at a time, there are many courts and years with multiple vacancies (see table 1). Aggregating to state-year rather than treating each vacancy as the unit of analysis avoids an independence problem in cases with multiple vacancies: when two or more judges are replaced at the same time, the characteristics of one replacement judge might affect the probability that the other replacement judge holds certain characteristics as well. Furthermore, evidence from the legislative arena suggests that the selection of multiple candidates at once, such as on a party list, is associated with increased gender diversity (Paxton Reference Paxton1997; Kenworthy and Malami Reference Kenworthy and Malami1999; Salmond Reference Salmond2006). By aggregating to state-year and then matching on the number of vacancies, I avoid potential bias from the interdependence of vacancies, and I control for potential incentives to select women when there are multiple vacancies.
Frequencies: Treatment and Dependent Variable

Note.—The gender of retiring and replacement judges in the cleaned but unmatched data set. The majority of retiring and replacement judges are male. There are 109 “treated” units in which a woman judge vacates.
I link vacancies to replacements by time. If a vacancy and a replacement occur in the same year, those two judges are linked as a vacancy-replacement pair. Importantly, retirements and replacements do not always occur in the same calendar year. For example, a judge may retire in one year, but a replacement may not be selected until the next year. In these cases, when judges vacate or are selected in different years, I aggregate across two years to link the vacancy and replacement (see the appendix for a description of the coding rules for aggregating 2 years). After cleaning and aggregating the data, I am left with 671 units that correspond to state-year(s)-vacancy(s) observations.Footnote 13
The main independent variable (the treatment variable) is a dummy variable indicating whether the vacating judge is female, and the dependent variable is a dummy variable indicating the gender of the judge selected to fill the vacancy. In cases in which there is more than one vacancy and replacement, the dummy variable indicates whether any of the vacating or replacing judges are female.Footnote 14 Table 1 summarizes the frequency of the treatment and dependent variables for the 671 units prior to matching. There are 109 “treated” cases in which a woman vacates the bench. In the next section, I describe how I match those treated cases to control cases and then test for a relationship between the gender of the vacating judge and the gender of the replacement judge.
Matching
In order to better approximate an experimental study, I employ a matching design to minimize imbalance, which in turn reduces model dependence and bias (King and Zeng Reference King and Zeng2006; Iacus, King, and Porro Reference Iacus, King and Porro2011). Cases are matched based on characteristics that affect the probability that the replacement or retiring judge is female. I match treatment and control cases on (1) the number of women on the court, (2) the size of the court, (3) time, (4) the number of vacancies, and (5) the selection method.
Matching on the number of women on the court is important for two reasons. First, the greater the number of women on the bench, the greater the probability that any given vacancy is made by a woman. Second, as Bratton and Spill (Reference Bratton and Spill2002) show, the number of women on the bench is negatively associated with the probability that a woman is selected. Importantly, because it is only possible for a woman judge to retire from a bench on which there is at least one woman, all matched data have at least one woman on the bench.Footnote 15
The size of the court is an important matching variable for three reasons. First, court size affects the probability that there is a vacancy. All else equal, the more judges there are on a bench, the greater the opportunities for a vacancy. Second, the court size affects our interpretation of gender diversity. One additional woman has a greater effect on the gender composition of a five-person court than a nine-person court. Third, the extant literature suggests that women are more likely to be selected to larger courts (Cook Reference Cook1984; Williams and Thames Reference Williams and Thames2008).
Matching on time controls for the relationship between the presence of women on courts over time. More women have been selected to and have retired from state supreme courts in more recent years. In addition, matching on time controls for variation in pressure to diversify courts over time.
Matching on the number of vacancies is important for two reasons. First, the probability that a woman vacates or is selected increases as the number of vacancies increases. Second, if the incentives for selecting women candidates in the legislative context apply to the judicial context, women may be more likely to be selected when there are multiple vacancies (Paxton Reference Paxton1997; Kenworthy and Malami Reference Kenworthy and Malami1999; Salmond Reference Salmond2006).
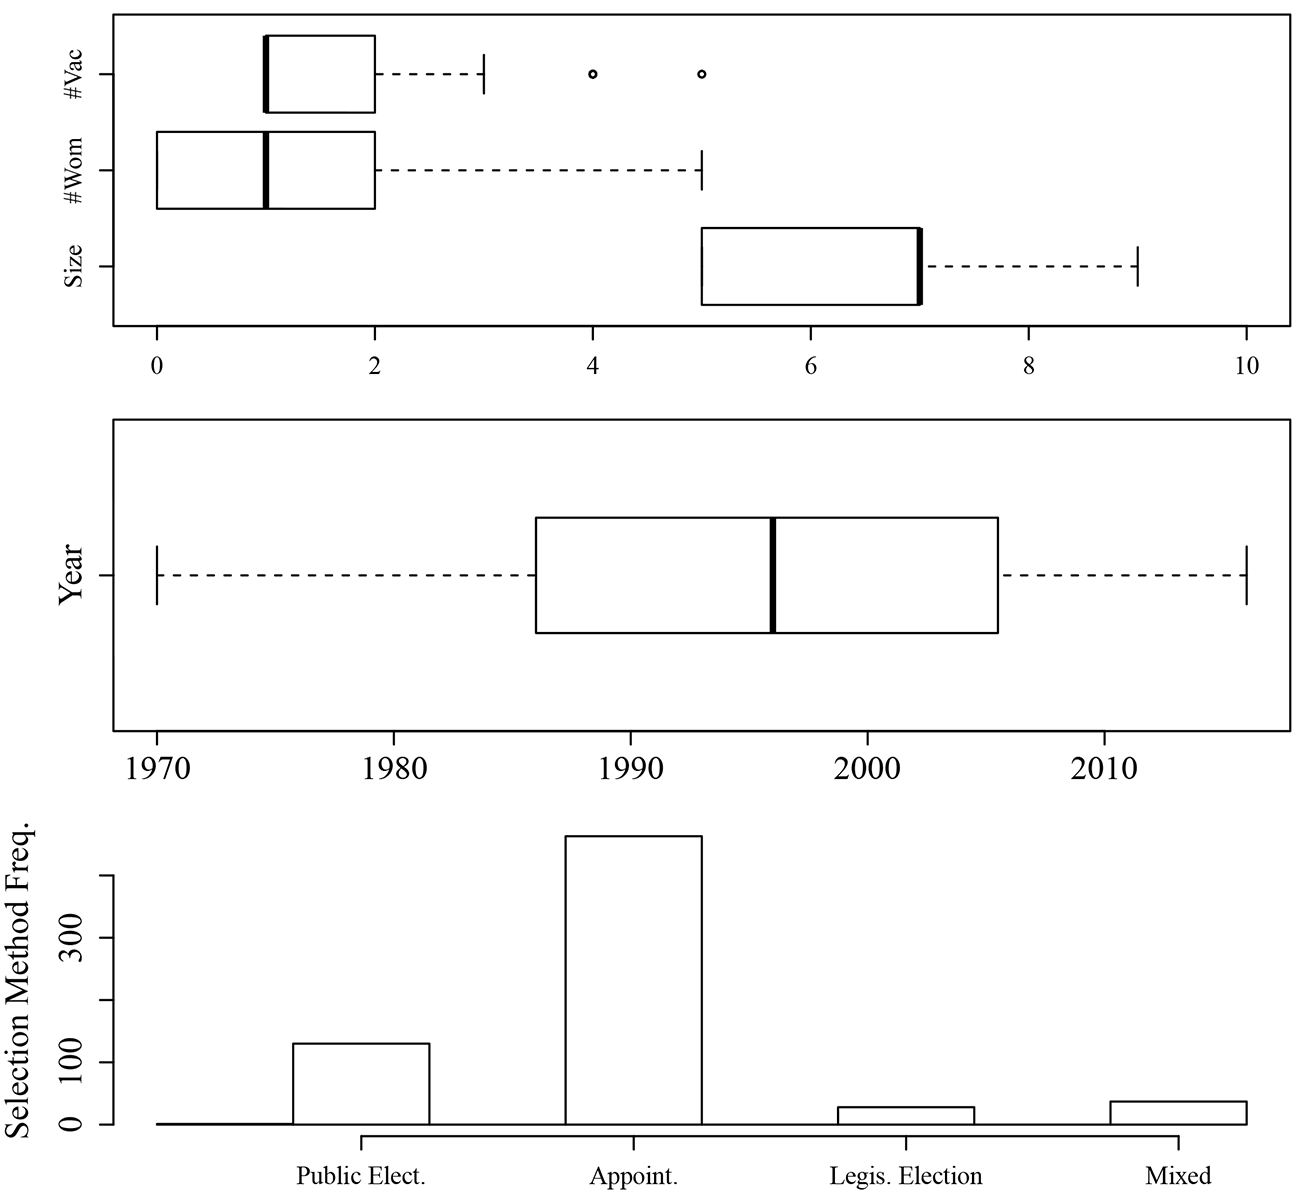
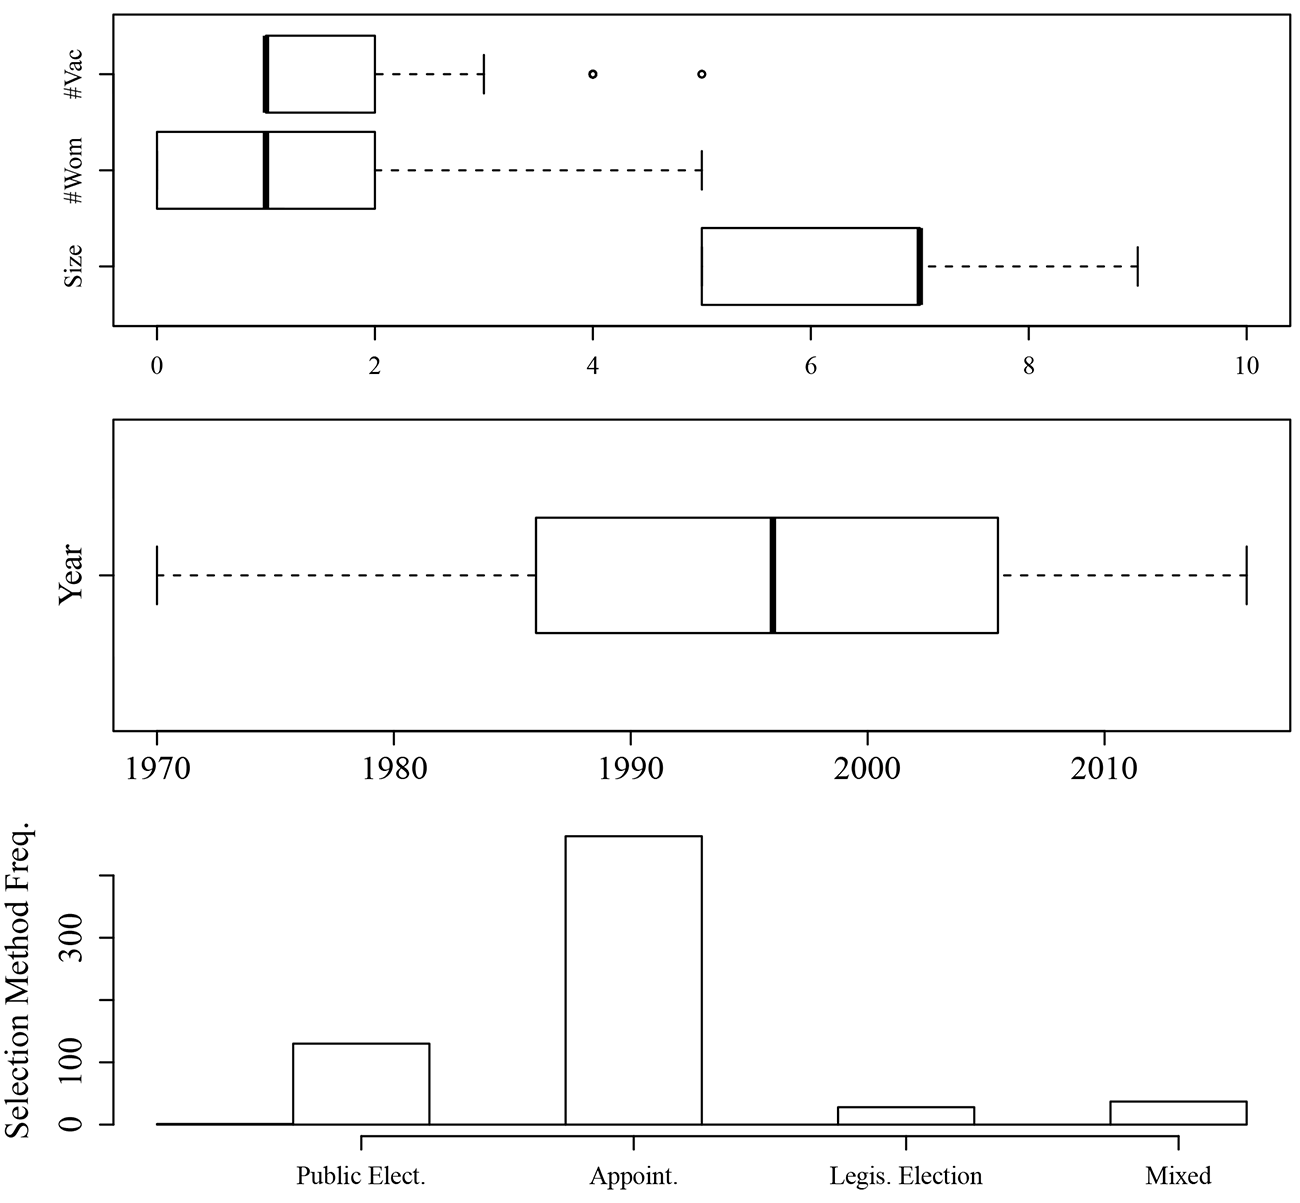
Finally, observations are matched on selection method. Selection methods are grouped into three categories: popular election (both partisan and nonpartisan), selection by elites (gubernatorial selection or merit selection), and legislative election.Footnote 16 While these groupings of selection procedures are broad and obscure variation within groupings, the categories capture important variation in opportunities for accountability over judicial selections and in the amount of coordination required to select judges. In popular election systems, accountability for the composition of the court is very diffuse, which means that any sanctions for perceived exclusion will be diluted, and claiming credit for diversifying (Valdini and Shortell Reference Valdini and Shortell2016) will be less lucrative. In addition, the coordination required to mobilize for the selection of a woman judge is high in the electoral context. In contrast, when only one or a few elites choose judges, accountability for a homogenous court is more easily attributed to those responsible, and fewer people must coordinate in order to intentionally select a woman judge. Matching on these broadly defined selection methods ensures that general patterns of accountability and coordination are held constant across treated and control groups without seriously restricting the ability to successfully match. Figure 1 summarizes the matching variables for the full, unmatched data set.
Data summary, unmatched data. Top, Distributions for the number of vacancies, the number of women on the court, and the court size for the full, unmatched data set. Middle, Distribution of observations across time. Bottom, Distribution of selection methods. For the selection methods, “Public Elect.” (public election) refers to both partisan and nonpartisan elections; “Appoint.” (appointment) refers to gubernatorial appointment and merit selection; “Legis. Election” (legislative election) refers to systems in which judges are elected by the legislature (South Carolina and Virginia); “Mixed” refers to years in which multiple judges were selected and the judges were selected in different ways.
Treatment and control cases are matched using Coarsened Exact Matching (CEM) procedures (Iacus et al. Reference Iacus, King and Porro2011) in the MatchIt package in R. Observations are exactly matched on the court size, the number of women on the bench, and the three-category selection method. For these variables, the difference between a value of 1 and 2, for example, is substantively different, so treated cases should only be matched to control cases that share the exact values for those variables.
For the year variable, cases should be matched within the same social and political context but need not be matched in the exact year. The difference between a vacancy in 1994, for example, and one in 1995 is not substantively meaningful. Moreover, vacancies on state supreme courts are relatively rare: only about half of the states in any given year have a vacancy on the court. Matching exactly on year seriously restricts the number of matched pairs. For these two reasons, the year variable bins are coarsened according to the CEM coarsening algorithm, which matches treatment cases to control cases within 5-year spans.
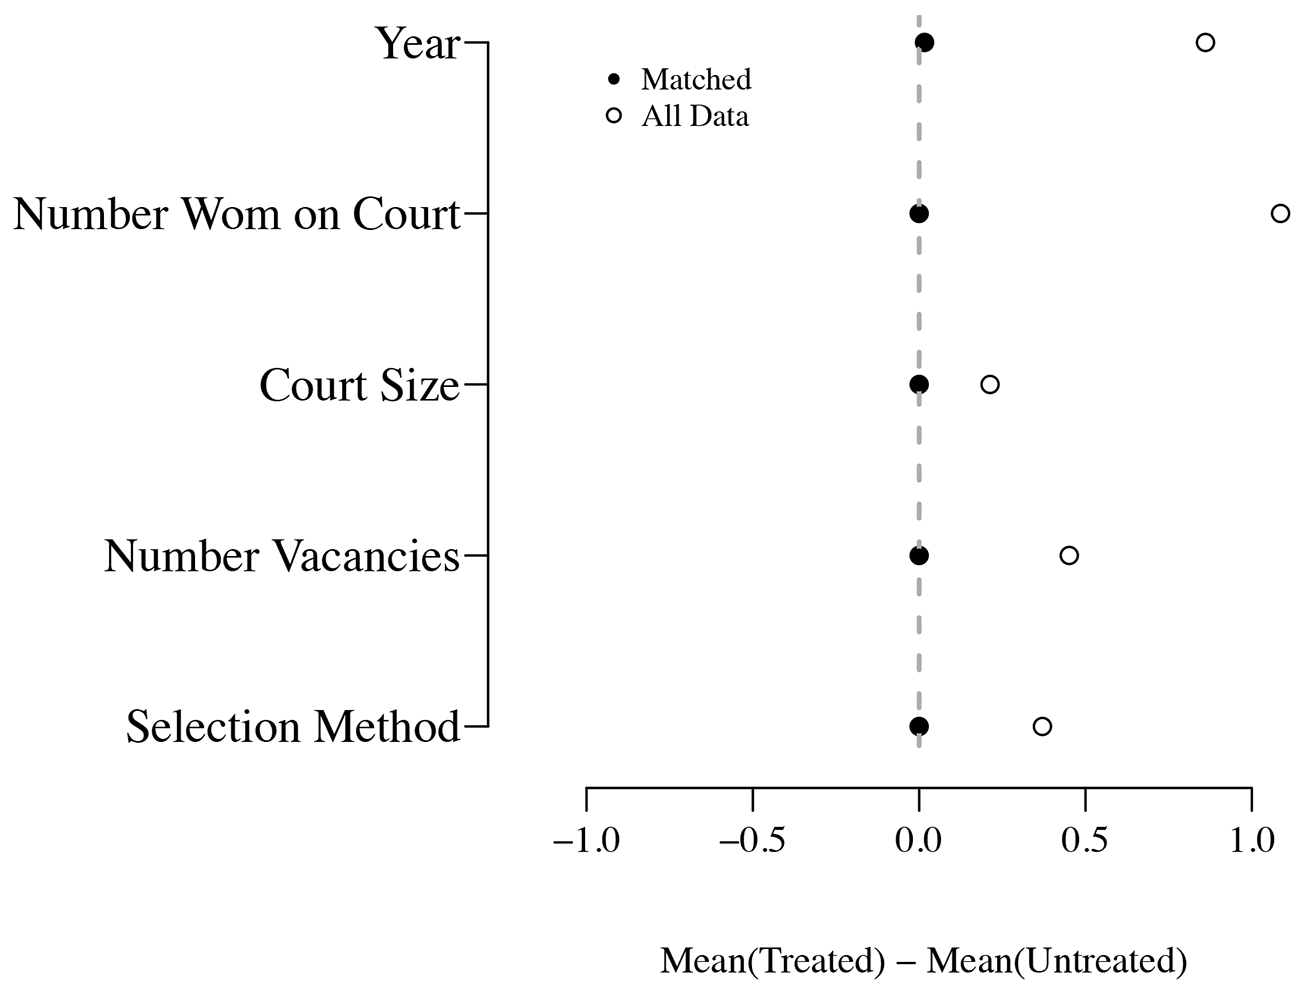
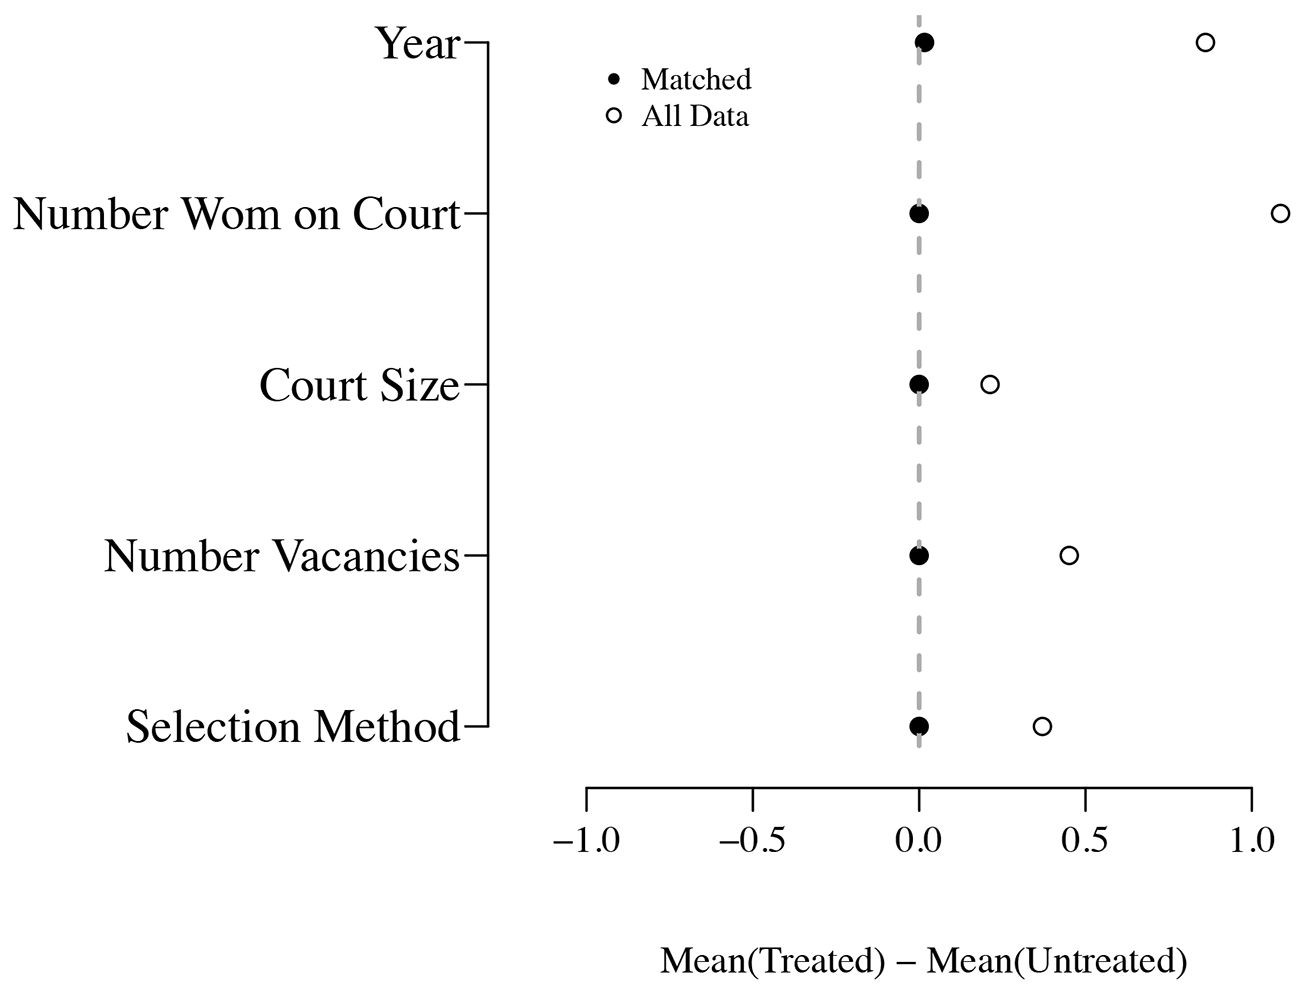
Figure 2 shows a balance plot that summarizes how treated units compare to control units, both for the full, unmatched data set (open circles) and for the matched data set (filled circles).Footnote 17 The farther from zero the standardized difference of means is, the greater the difference between treated and untreated observations. There are substantial differences across the treated and untreated groups in the unmatched data: treated units occur later (greater value for year); there are slight differences in the frequency of selection method; and treated units have more women on the bench, have more vacancies, and have a larger number of seats. If treatment and control units are matched appropriately, balance should improve, and the differences in means of the matched data should be closer to zero than the differences for the full data set. As the filled circles in figure 2 show, balance is greatly improved.
Balance plot of the standardized difference in means between the treated and untreated data for the full data set and for the matched data set. Because each treatment case can be matched to multiple control cases, standardized differences in means are weighted.
Results
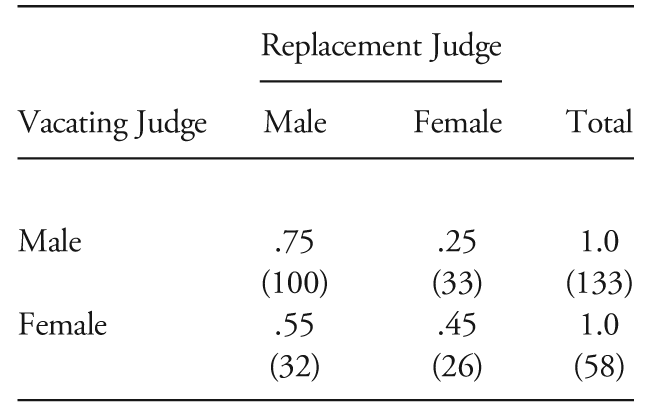
The CEM procedure classifies treated and control cases into strata; each stratum contains at least one treated unit and all the matched control units, of which there can be many. Table 2 is a contingency table for the treatment and outcome variables for the matched data across all strata. The rows correspond to the gender of the vacating judges, and the columns show the proportion and number of vacancies filled by male and female judges. In this matched data set, when a male judge retired, more than three-quarters of replacement judges were likewise men. Only 24.8% of vacancies made by male judges were filled by female judges. In contrast, when a woman judge retired, almost half (44.8%) of her replacements were also women.
Matched Data, Contingency Table
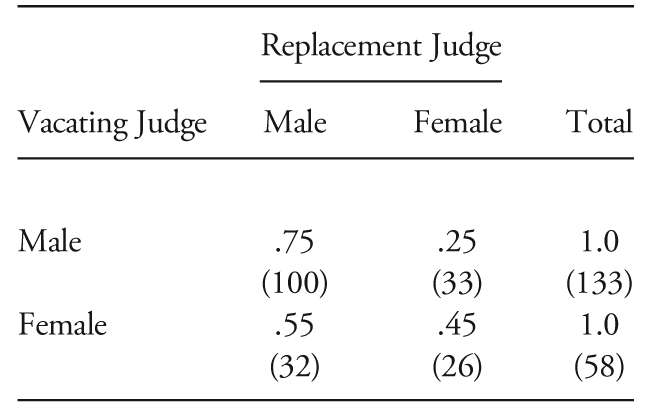
Note.—Vacancies made by men and women and how many of those vacancies were filled by men and women. Proportions and total number of cases (in parentheses) are reported. The Cochran-Mantel-Haenszel test generates a chi-squared statistic of 6.8 with a corresponding p-value of .009, which means that we can reject the null hypothesis that the gender of the replacement judges is independent of the gender of the vacating judge.
To determine whether the proportions of female judges selected as replacements are sufficiently different across male and female vacancies, I use a CMH test.Footnote 18 The null hypothesis of the CMH test is that there is no association between treatment and outcome variables. Under the null hypothesis, the proportion of women selected to fill a vacancy is independent of the gender of the vacating judge. For these data, the CMH test produces a chi-squared statistic of 6.8 with 1 degree of freedom.Footnote 19 The proportions of male and female judges selected to fill vacancies made by men and made by women are sufficiently different to reject the null hypothesis that the gender of the replacement judge is independent of the gender of the vacating judge (p = .009). This test indicates that the gender of the retiring judge does affect the gender of the judge selected to fill the vacancy. Vacancies made by women judges are filled by women judges at a greater rate than vacancies made by men, and vacancies made by men are filled by men at a greater rate than vacancies made by women.
While this analysis demonstrates that gender is relevant in the selection process, it does not distinguish between a positive or negative outcome for judicial diversity overall. In the next section, I compare patterns of judicial selection to the gender composition of lawyers to determine whether patterns of gendered replacement have suppressed or promoted the selection of women judges to state supreme courts.
Gender, Judicial Replacement, and Diversification
If the pattern of women judges replacing women judges requires judicial appointers or party elites to actively seek out women candidates when they otherwise would not, then the pattern may promote gender diversity. In contrast, if the pattern of women replacing women limits opportunities for women judges by restricting them to one or a few seats, then the pattern could suppress diversification. To investigate whether current patterns of selection promote or suppress the selection of women to state supreme courts, I compare the observed rates of selection to a counterfactual in which patterns of selection do not depend on the gender of vacating judges.Footnote 20 I use the gender composition of lawyers as a proxy for the candidate pool for state supreme court judges.Footnote 21 Then, I estimate the rate at which women would be selected to state supreme courts if gender were not a relevant selection criterion under existing and broadly defined standards of what it means to be qualified.
It is important to note that there is no agreed upon, ideal level of gender diversity on state supreme courts. In some contexts, such as the legislative context, standards of descriptive representation and diversity are compared to the composition of the population. The assumption, sometimes implicit, is that if political institutions are open and available to all, then the characteristics of the representatives should generally mirror the characteristics of the population. In the context of high courts, though, the vast majority of the electorate is not formally eligible for office under existing rules. At least 38 of the 50 states, for example, require state supreme court judges to be lawyers.Footnote 22 Requirements include practicing law for a certain number of years, being a member of the state bar, being a licensed attorney, or “being learned in the law.”
Given how many states require judges to be lawyers, I choose the gender composition of lawyers as a proxy for the candidate pool. This proxy is imperfect. First, using the composition of the legal profession as a proxy for the composition of the qualified candidate pool is generous. More women have been attending law school and becoming lawyers over time.Footnote 23 The gender balance among young lawyers is more equal than the gender balance of older lawyers, and it is the older, more experienced lawyers who are generally more qualified for prestigious judicial posts.
Second, using lawyers as the proxy for the candidate pool overlooks gender discrimination in informal qualifications.Footnote 24 To the extent that women are subject to pressures of the “leaky pipeline,” fewer female lawyers may possess the informal qualifications that increase a judge’s possibility of gaining a seat on the court (Cook Reference Cook1984; Epstein, Knight, and Martin Reference Epstein, Knight and Martin2003). In addition, gender differences in whether and how candidates perceive themselves as qualified shape decisions to run for office. Studies suggest that women may be less likely to view themselves as qualified (Fox and Lawless Reference Fox and Lawless2004; Lawless and Fox Reference Lawless and Fox2010), which in turn means that women who decide to pursue higher office may be more qualified than their male peers (Milyo and Schosberg Reference Milyo and Schosberg2000; Pearson and McGhee Reference Pearson and McGhee2013). Treating all members of the candidate pool as equally qualified discounts gender differences in the accumulation and perception of qualifications.
Despite these limitations, the composition of the legal profession should give us a plausible estimate of the proportion of qualified candidates who are women. If the pattern of women judges replacing women judges systematically suppresses diversity on the bench by limiting women to one or a few seats, there would be fewer women state supreme court judges than expected, given the candidate pool (all else equal). In contrast, if patterns of women replacing women promote women judges, we would see more women selected than expected.
Judicial Selection and the Candidate Pool
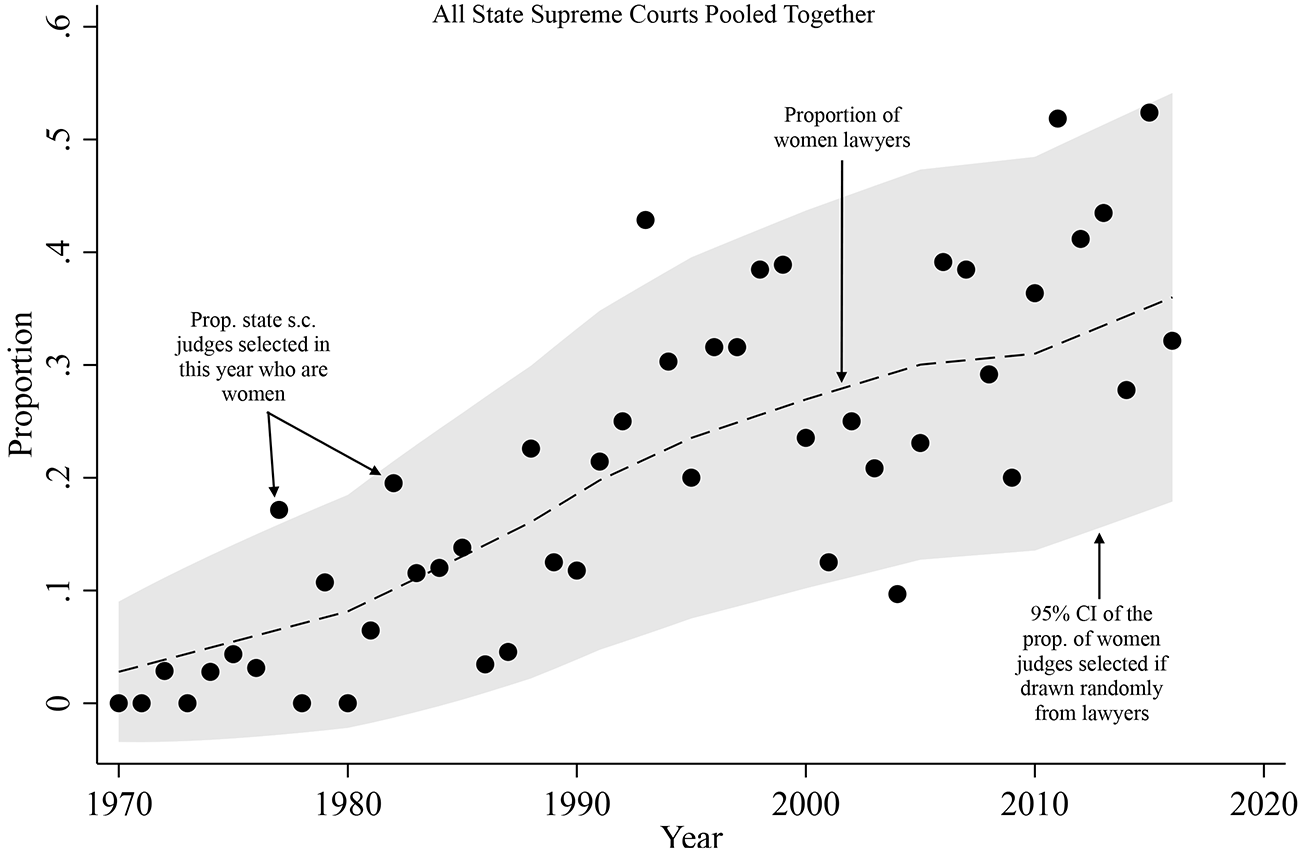
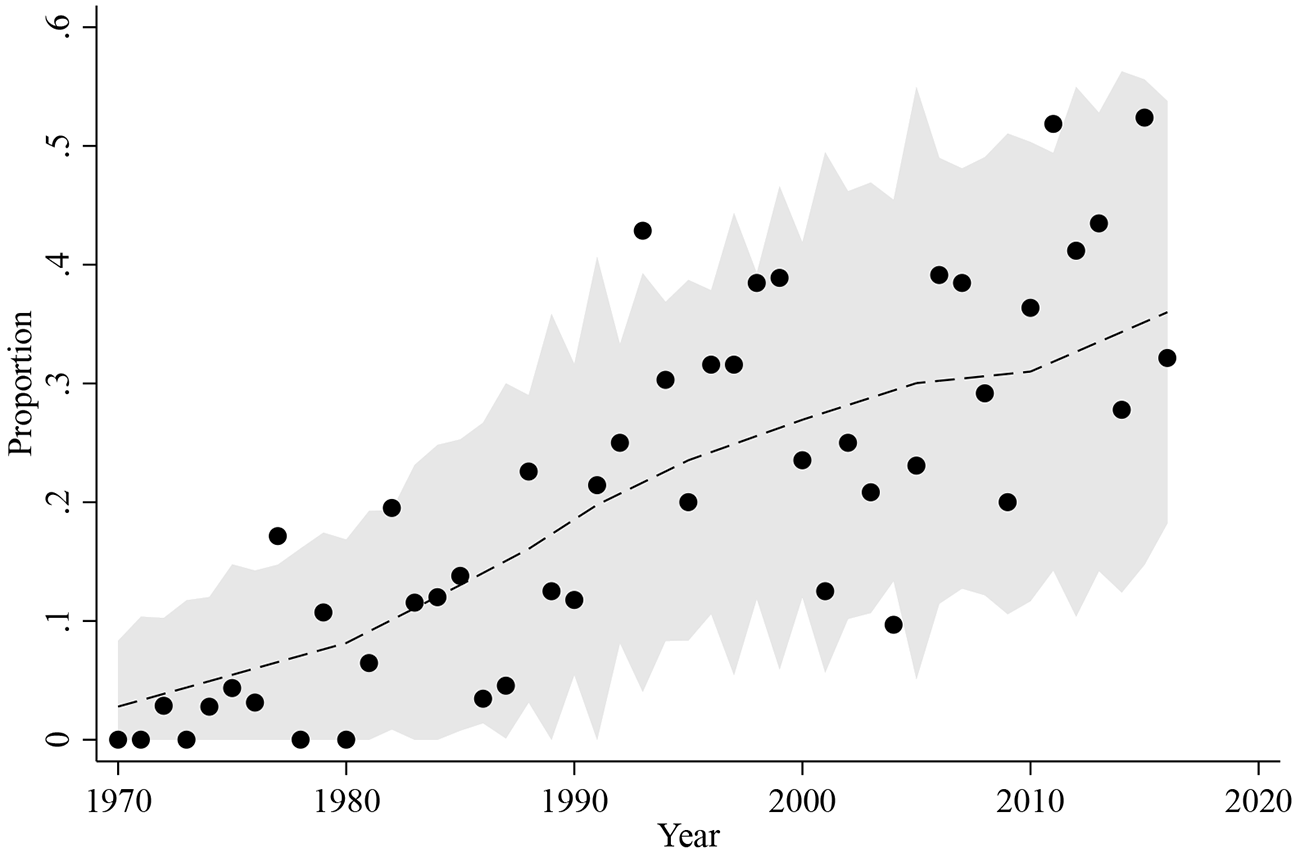
Figure 3 shows the average proportion of US lawyers who are women (the dashed line).Footnote 25 The gray shaded region shows the 95% confidence interval around the composition of the candidate pool.Footnote 26 The circles show the actual proportion of vacancies filled by women.
Average percentage of women in the legal profession (dashed line), the 95% confidence intervals around the proportion of women lawyers (shaded region), and the proportion of women actually selected to state supreme courts (circles) in each year. In all but four years, the proportion of women selected to state supreme courts is within the expected range, and three of the four out of range are above the range.
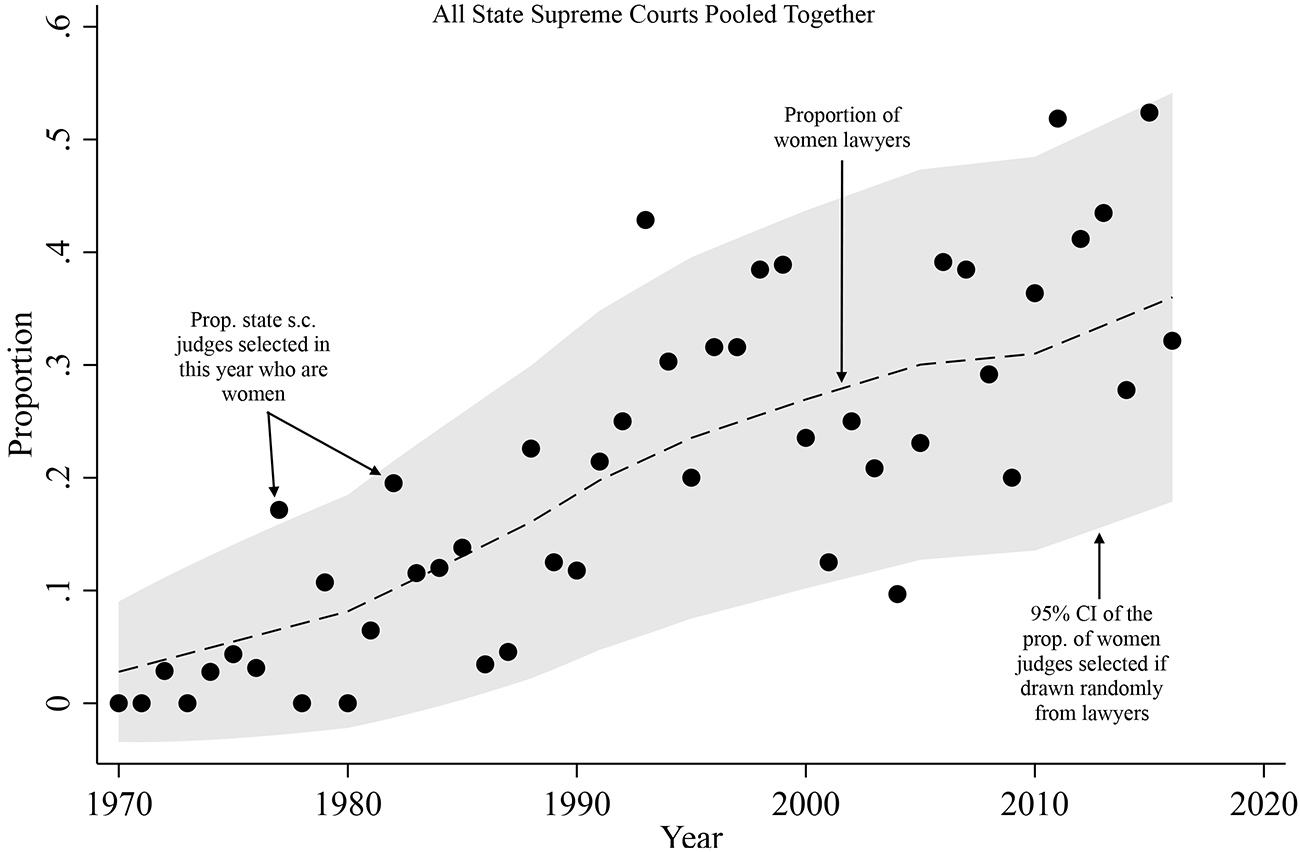
We can see that the proportion of women judges selected to state supreme courts almost always falls within the expected range, given the composition of the candidate pool. Of the 46 years in these data, 22 years see a greater proportion of women selected to state supreme courts than the proportion of women lawyers, and 25 years have fewer women judges selected than expected. There are only four observations that fall outside the bounds of the confidence intervals, and three of them fall above the upper bound. This plot shows that the selection of women judges to state supreme courts mirrors a pattern in which judges are randomly selected from the population of attorneys.
Overall Judicial Diversity and the Candidate Pool
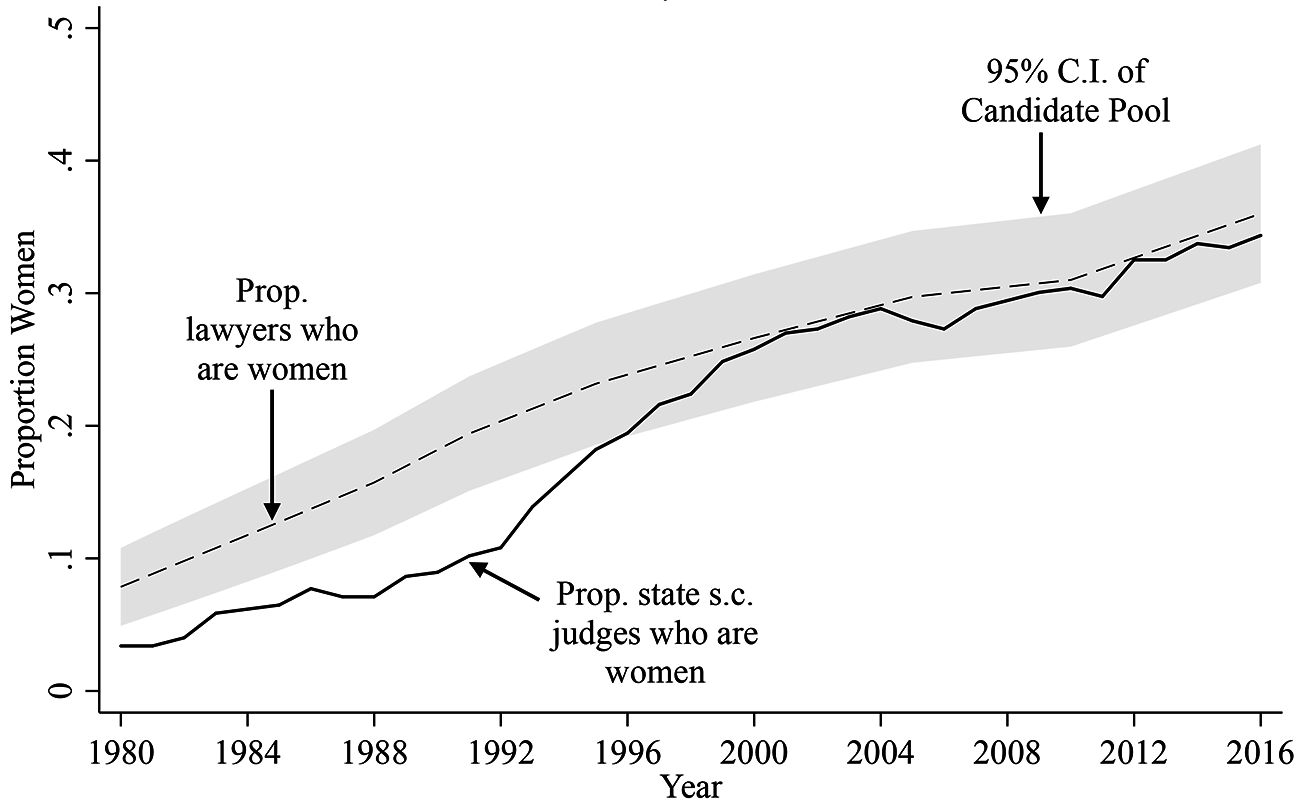
Comparing the proportion of judges selected to the composition of the qualified candidate pool is more generous than comparing the overall proportion of women judges on the bench to the candidate pool: low turnover on courts may depress the overall presence of women on a given bench, even if the proportion of vacancies filled by women does reflect the candidate pool. Figure 4 shows the national proportion of lawyers who are women (dashed line) and the national, aggregate proportion of state supreme court judges who are women (solid line). The gray shaded region shows the 95% confidence interval around the proportion of women lawyers, which represents variation from the candidate pool that might stem from randomness rather than bias or exclusion. Confirming Cook’s (Reference Cook1984) finding that the gender diversity of state supreme court judges lagged behind the candidate pool, the proportion of women judges was below the lower bound of the confidence interval around the pool prior to 1996. Although the proportion of women state supreme court lawyers has not yet been greater than the proportion of women lawyers, the proportion of women judges has been within the expected range for the last 20 years.
Proportion of women lawyers and total proportion of state supreme court judges on the bench who are women, 1980–2016. Data and the number of women selected in each year are more complete in early years than data on the overall composition of state supreme courts. To avoid missing data for the overall composition in early years, that analysis is restricted to 1980.
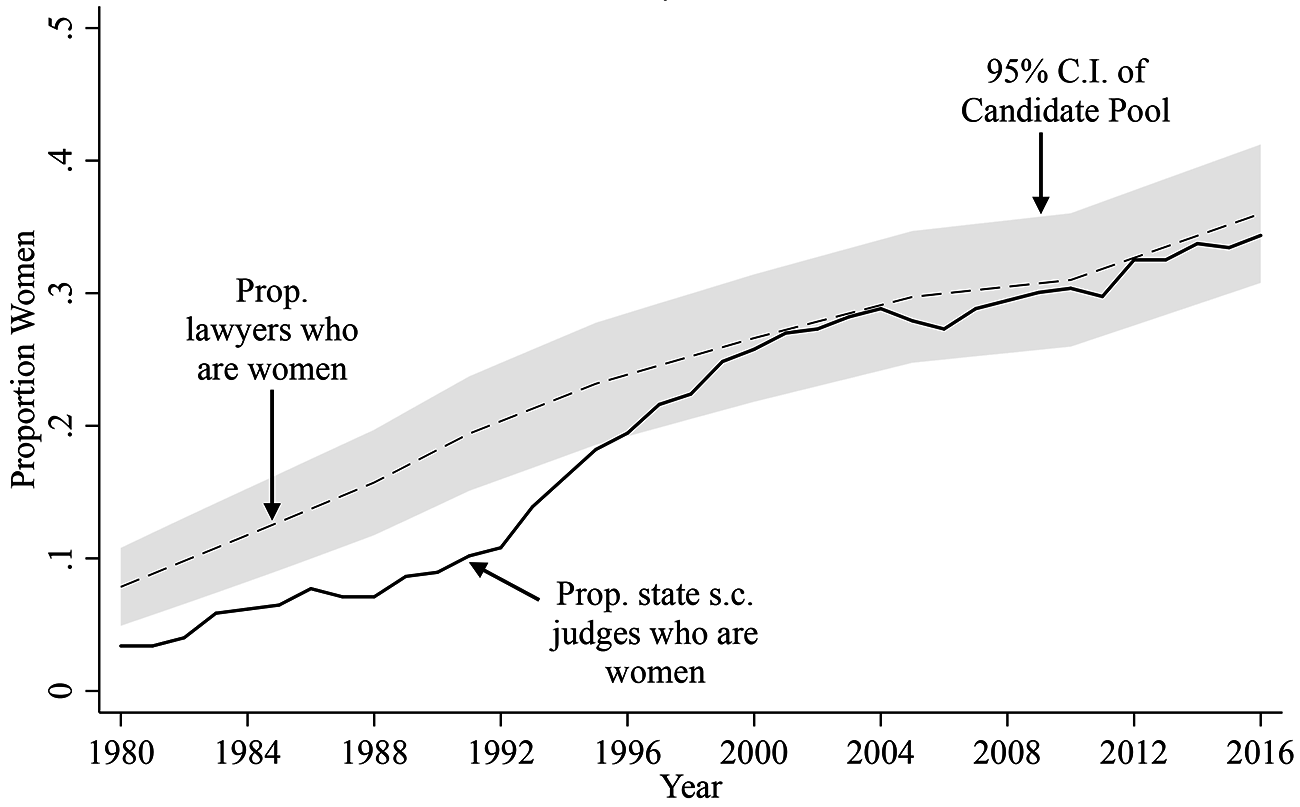
Using the gender composition of lawyers over the last 46 years as a proxy for the gender diversity of the candidate pool, we see that women judges have been selected to state supreme court benches as often as would be expected if gender were not a relevant criterion. While there was a lag in the overall gender diversity of state supreme courts, courts on average have been about as diverse as expected since 1996.
Gendered Turnover and Diversity
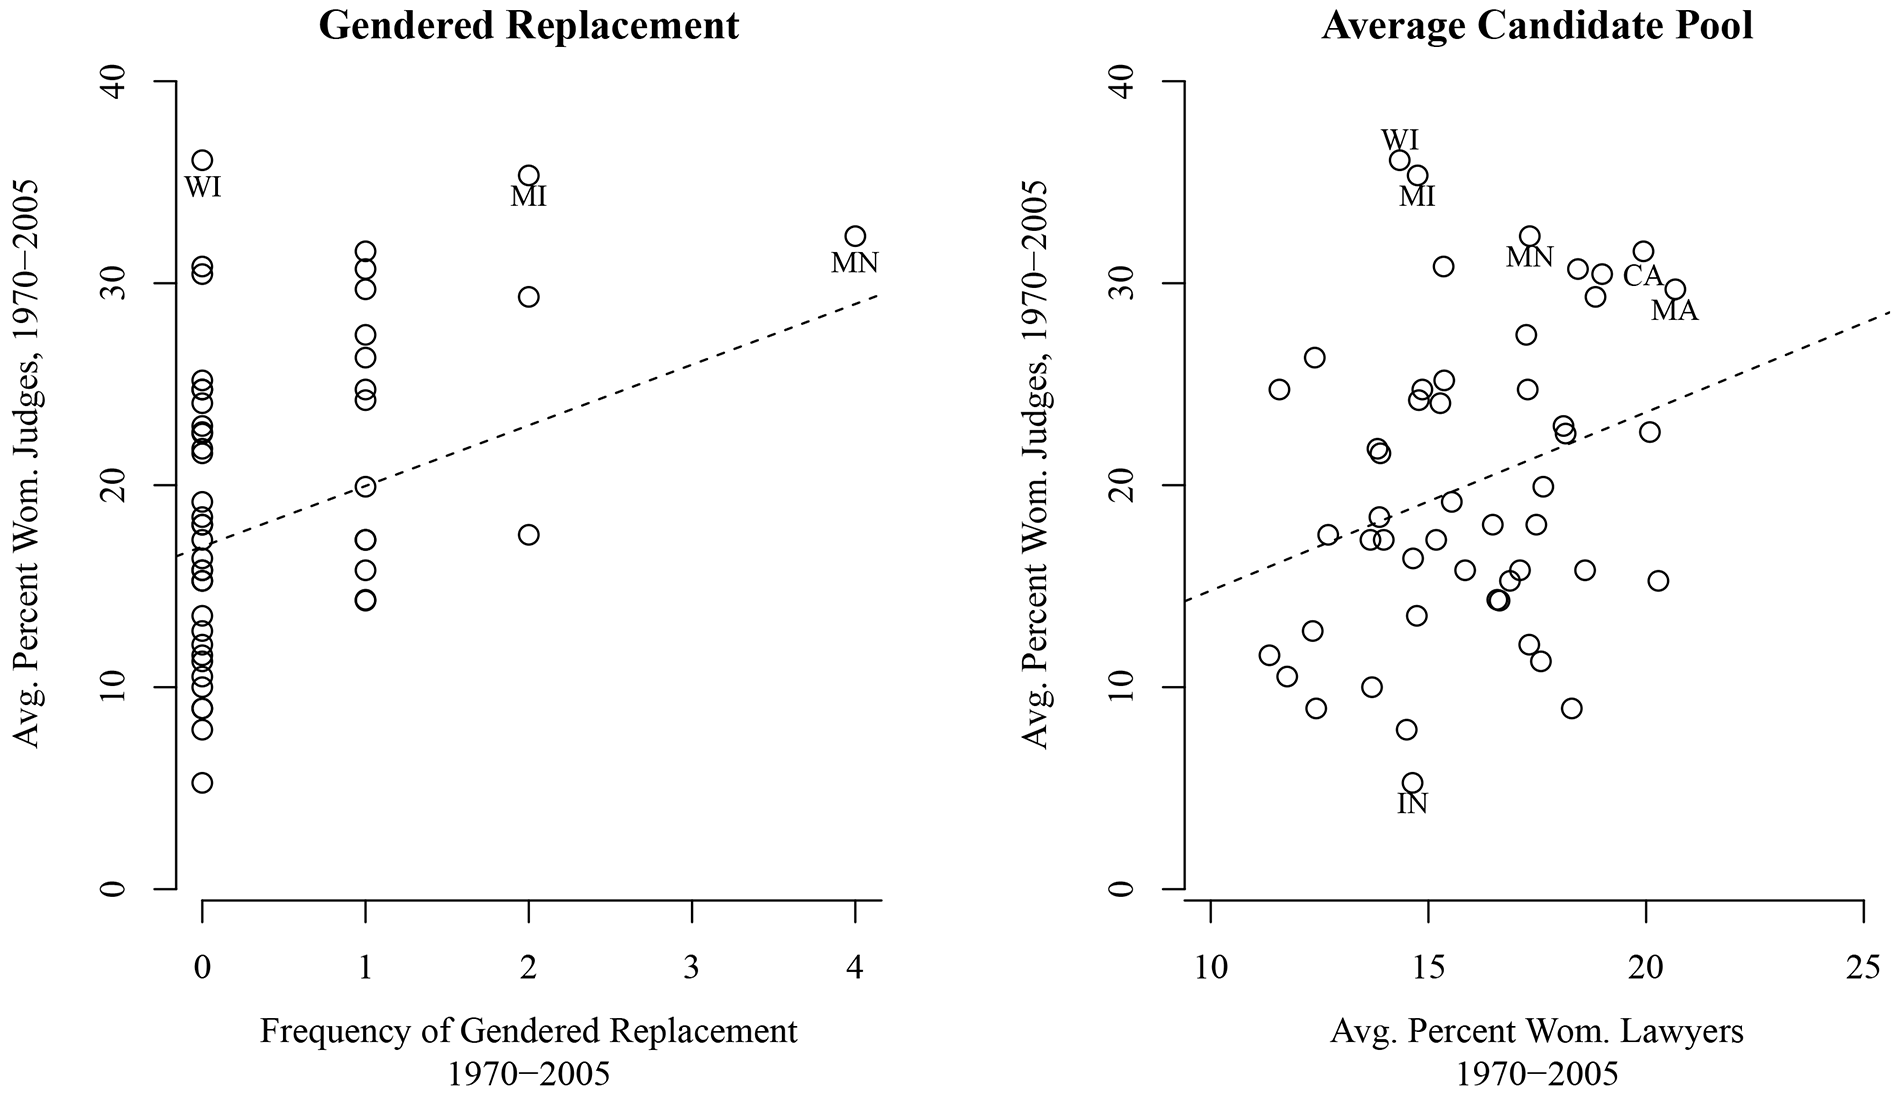
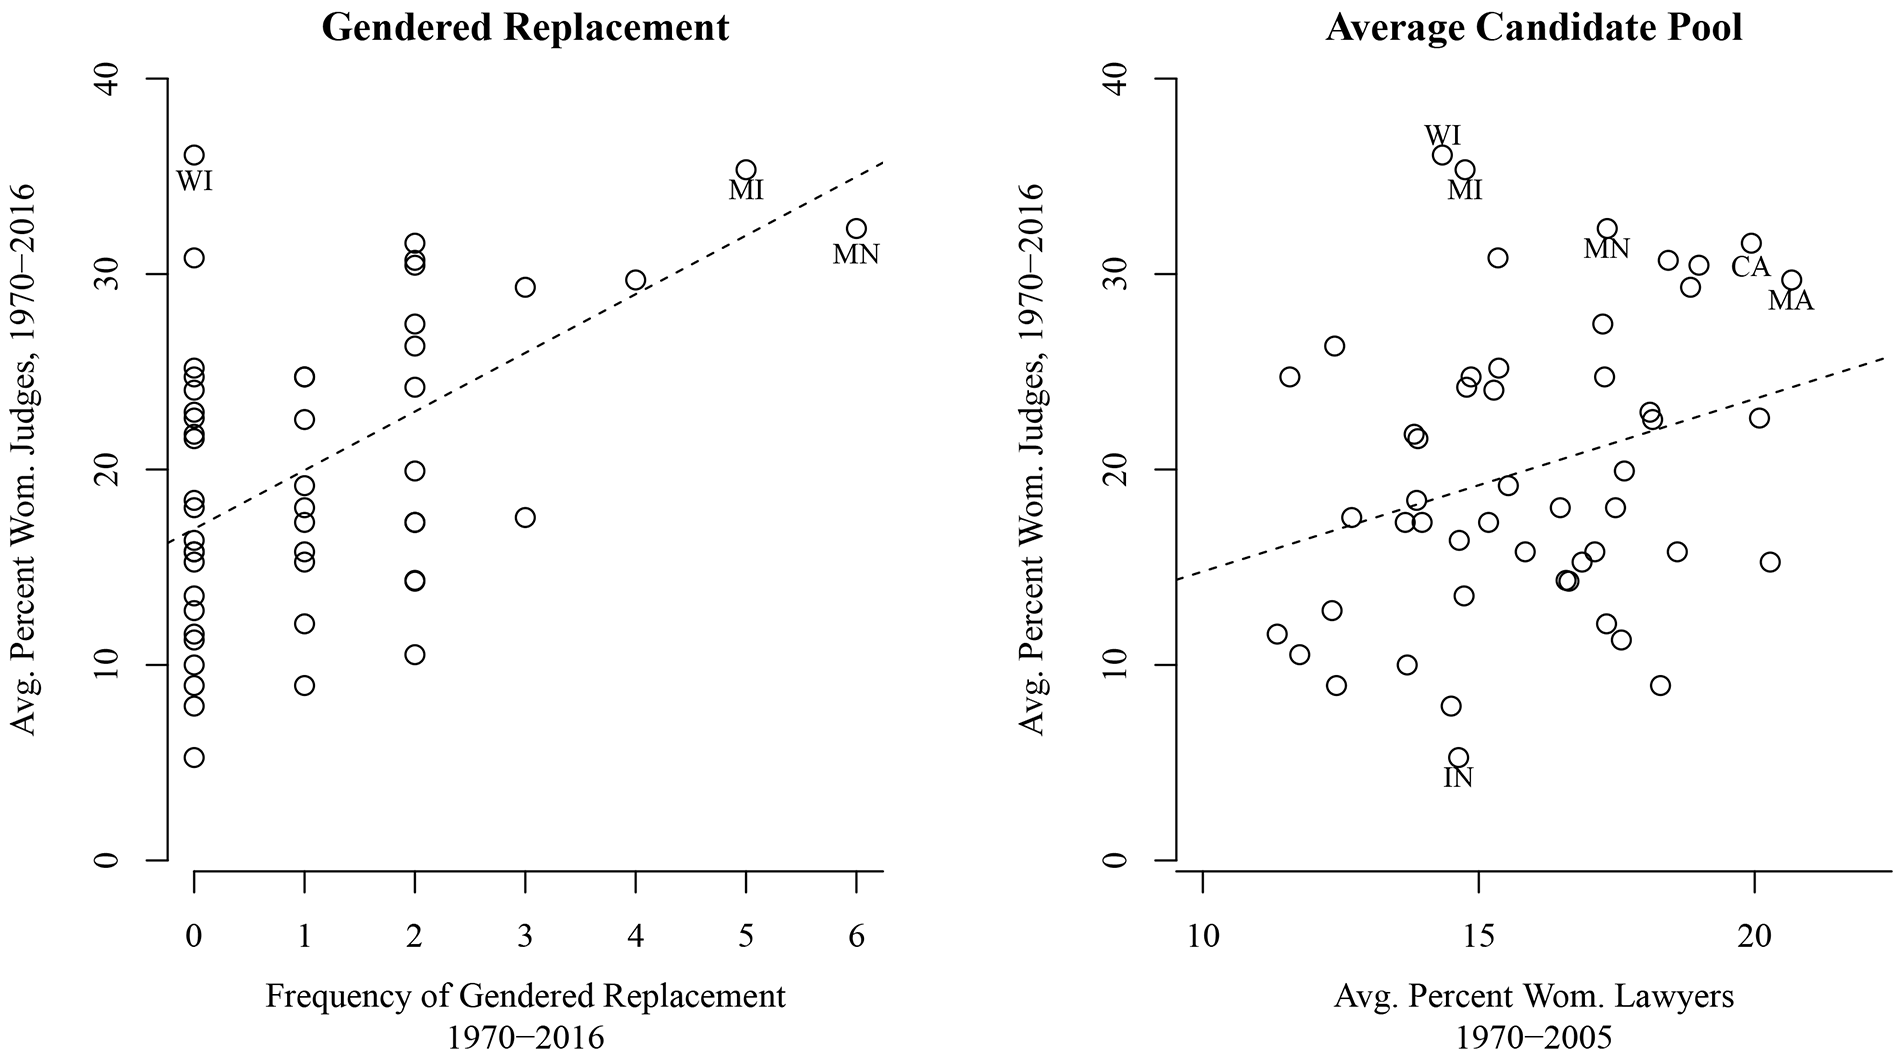
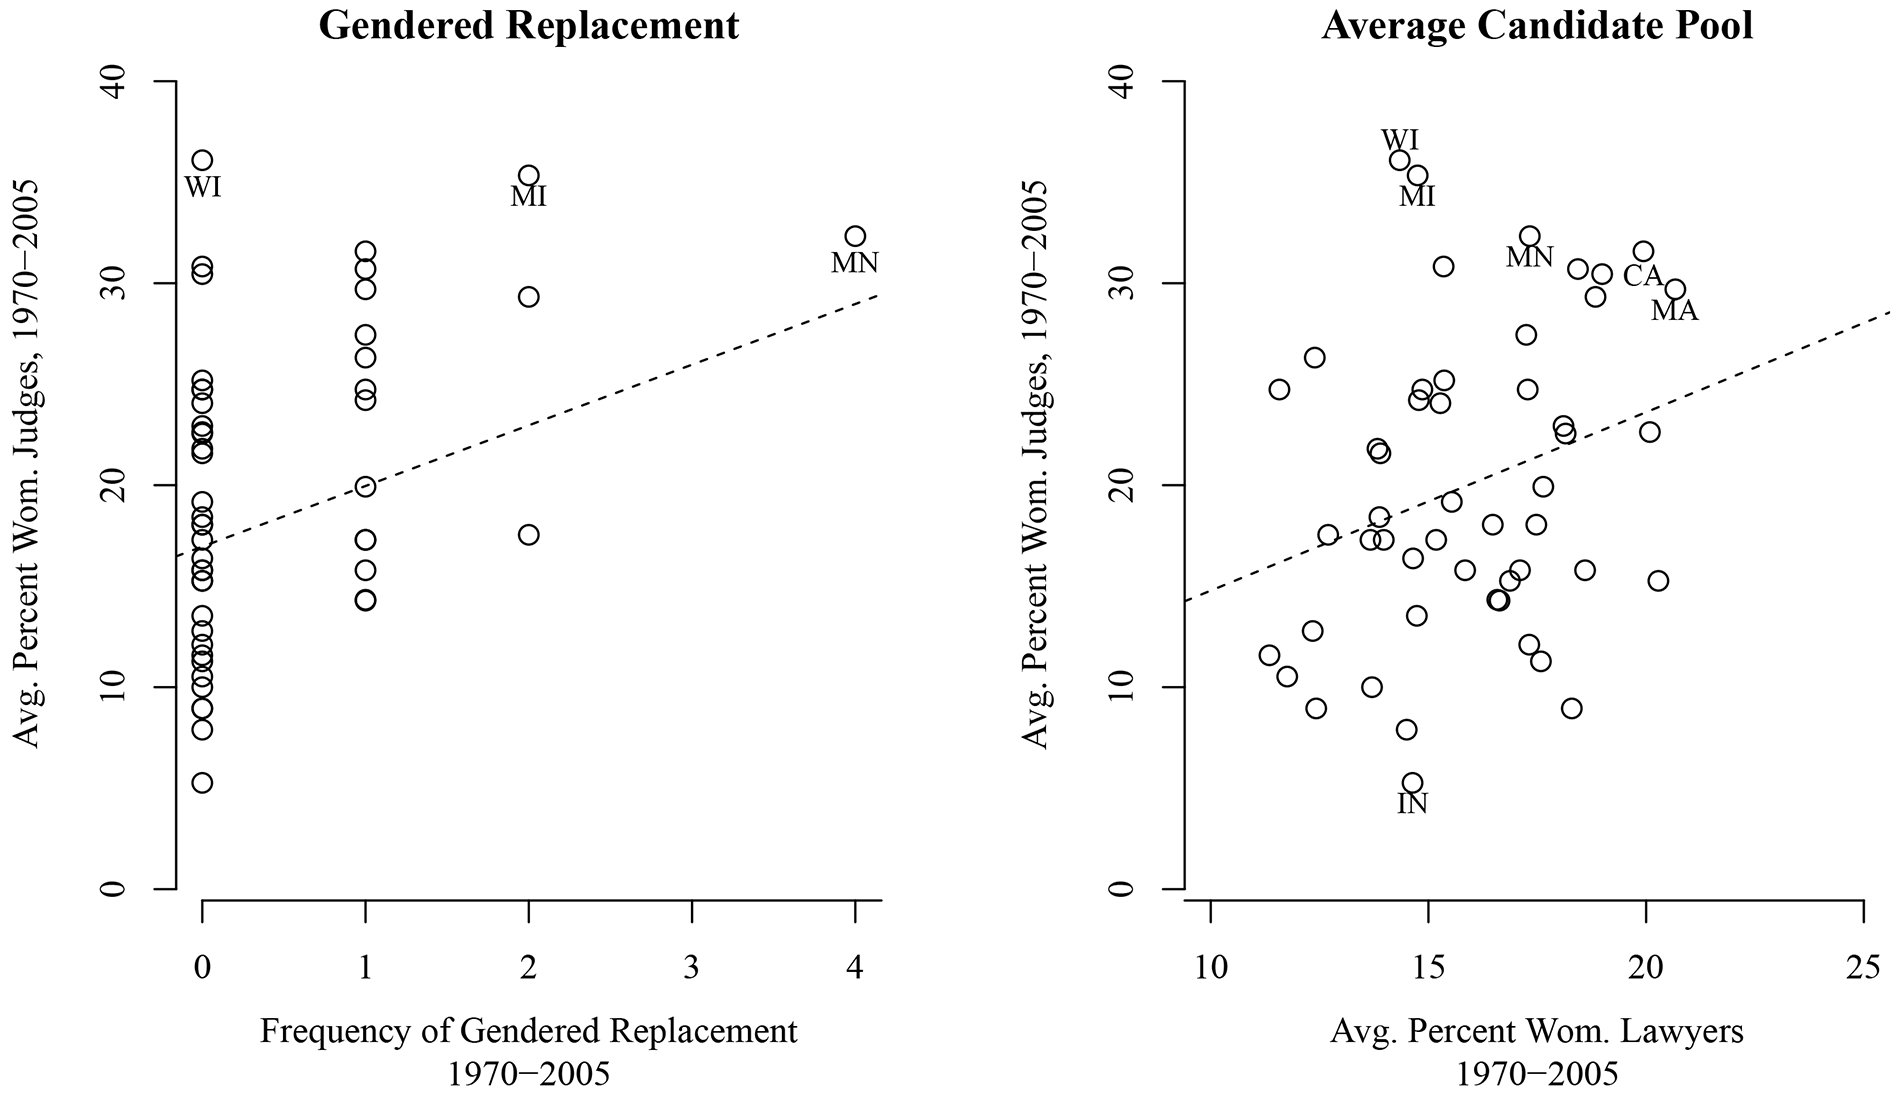
These aggregate patterns of selection and diversity cannot rule out the possibility that gendered patterns of judicial selection limit opportunities for women judges. It could be, for example, that the states that most consistently conform to a pattern of gendered turnover are the states with only one or a few women judges. Empirically, though, that is not the case. The y-axis of the left panel of figure 5 shows the average percentage of women on a state’s supreme court between 1970 and 2016. The x-axis shows the number of instances in which a woman judge replaced a woman judge between 1970 and 2016.
Left, Relationship between the number of instances in which a woman judge replaced a woman judge by state between 1970 and 2016. Right, Average proportion of women judges from 1970 to 2016 and the average proportion of women lawyers from 1970 to 2005 (2005 was the last year the Lawyer Statistical Report published data about the gender composition of lawyers at the state level).
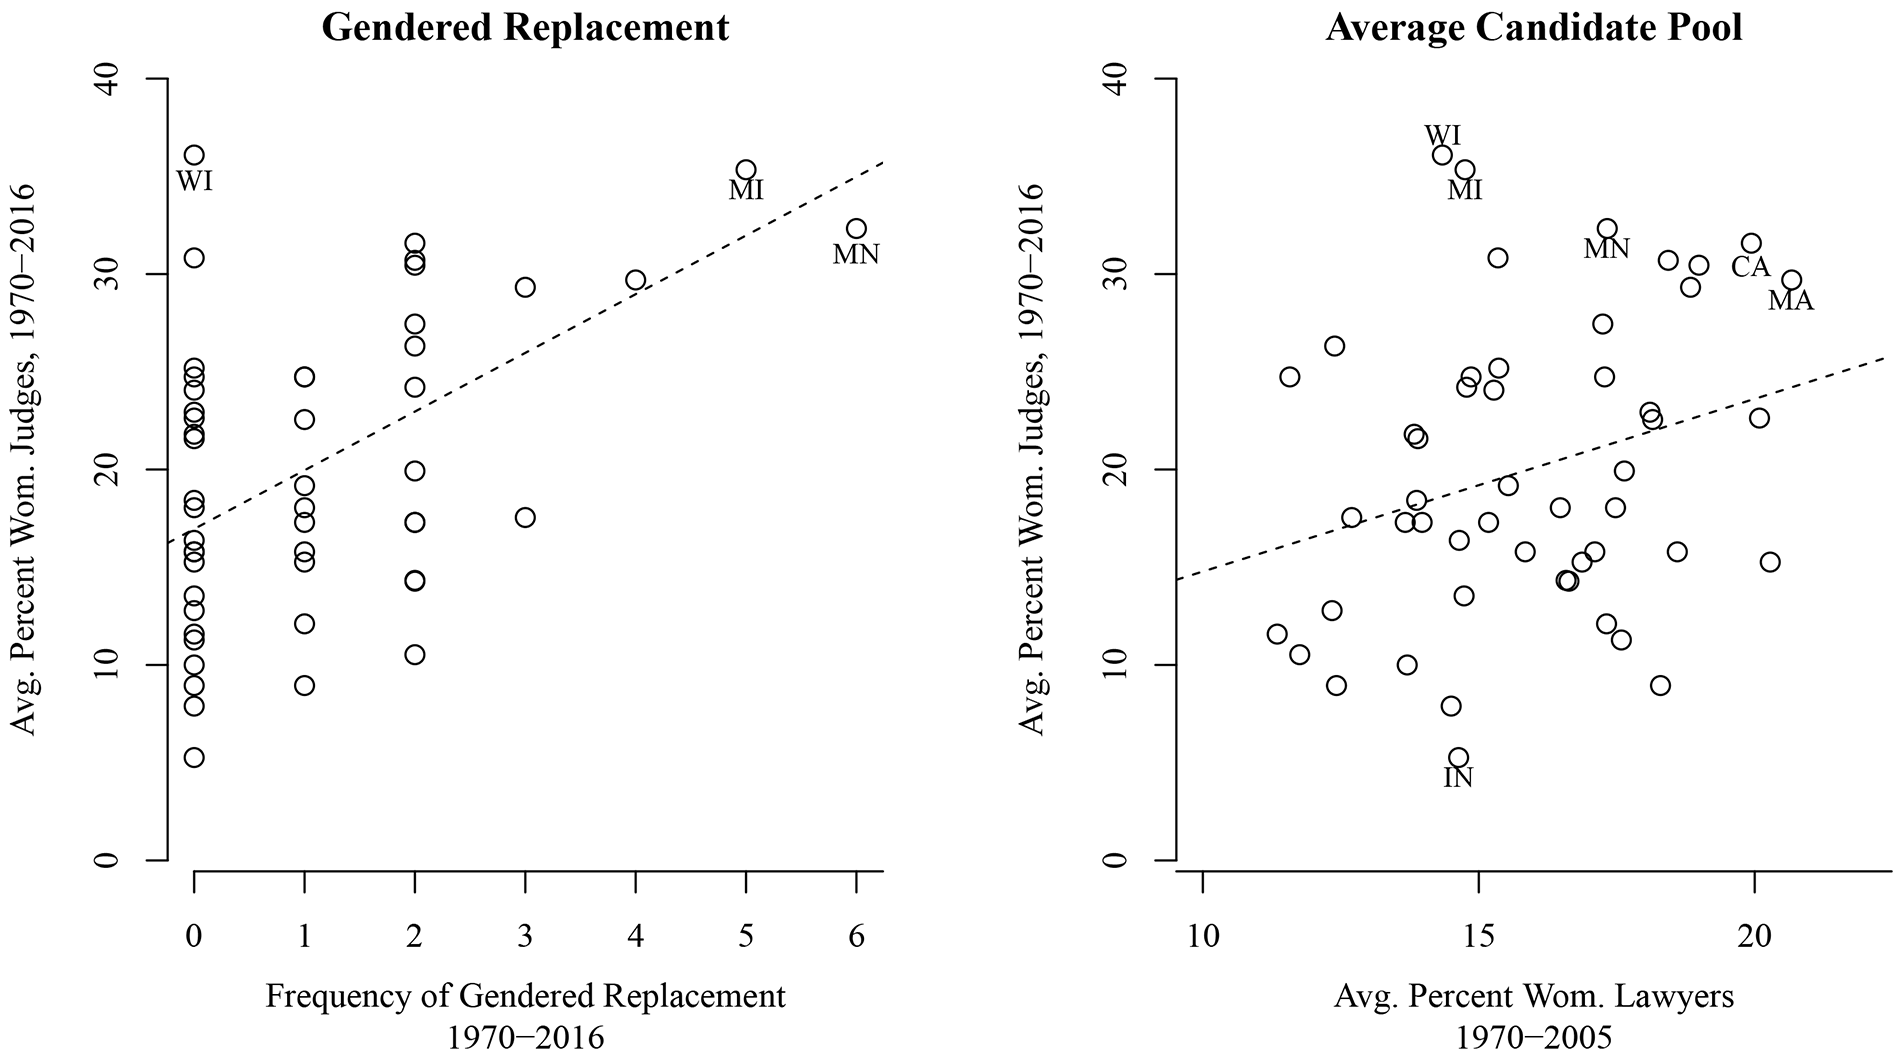
The two states with the highest frequency of gendered turnover—Michigan and Minnesota—also are among the most gender diverse. Of course, the relationship between gendered turnover and gender diversity is endogenous: the more women on the court, the more chances there are for women to retire and be replaced by women. Likewise, there are gender-diverse courts that do not have patterns of gendered replacement. What is important here is that the patterns of gendered replacement are not limited to courts with minimal diversity, which suggests that the pattern of women replacing women has not been systematically used to limit or exclude women from the bench. The right panel of figure 5 shows the average percentage of women judges from 1970 to 2016 on the y-axis and the average proportion of women lawyers from 1970 to 2005 on the x-axis.Footnote 27 While the relationship is positive, cross-state variation in the gender composition of lawyers does not account for all variation in the gender diversity on the bench. Neither gendered patterns of replacement nor a diverse candidate pool will necessarily lead to a diverse supreme court bench, but both factors are positively associated with greater gender diversity.
Discussion and Conclusion
This project demonstrates that gender is a relevant selection criterion for state supreme courts. Even though there are no formal rules or quotas requiring women to replace women, women judges are more likely to be selected to fill vacancies made by women than vacancies made by men. What this pattern of gendered replacement means for the overall trajectory of diversification depends on whether patterns of replacement have suppressed or promoted the inclusion of women on the bench. Using the gender composition of lawyers as a proxy for the composition of the qualified candidate pool for state supreme court benches, we see that women are selected to state supreme court benches as often as expected, given the candidate pool. These two findings have a few important implications.
First, these findings suggest that the use of gender as a selection criterion has not systematically suppressed the diversification of state supreme court benches at the selection stage. While women are more likely to replace women judges, they do not exclusively replace women.Footnote 28 In addition, patterns of gendered judicial replacement are not limited to courts with token levels of diversity, and there is a positive correlation between instances of women replacing women judges and levels of gender diversity on state supreme court benches. Patterns of women replacing women have not resulted in clear patterns of tokenism in which only one woman holds a seat on the bench at a time.
While there is no evidence here that gendered patterns of turnover have systematically promoted tokenism at the selection stage, this study does not speak to the experiences of women judges who were selected—or were selected at a specific time—to replace a woman judge. To the extent that people believe women judges are selected in whole or in part because of their gender, women judges may be perceived as less qualified than their male peers. Evidence from nonjudicial contexts suggests a “discounting principle” in which people perceive beneficiaries of affirmative action policies as less competent (Summers Reference Summers1991; Heilman, Block, and Lucas Reference Heilman, Block and Lucas1992). Notably, experimental evidence shows that perceptions of incompetence can be offset by unambiguous evidence that beneficiaries of affirmative action policies are competent (Heilman, Block, and Stathatos Reference Heilman, Block and Stathatos1997). In the judicial context, formal and informal qualification requirements may provide those unambiguous signals of competency; the impressive resumes of women state supreme court justices may preclude potential for observers to “discount” competency. Moreover, Heilman et al. (Reference Heilman, Battle, Keller and Andrew Lee1998) and Evans (Reference Evans2003) find that stigmatization decreases as affirmative action policies become more moderate. The fact that the pattern of women judges replacing women judges is informal and incomplete—not every woman judge who retires is replaced by a woman judge—may serve to alleviate potential discounting. Assessing whether gendered patterns of replacement affect perceptions of the competency of women judges or the experiences of women judges will be a fruitful extension of the current project.
Second, gendered patterns of replacement have not resulted in women getting systematically more seats than expected, given the gender composition of lawyers. Only three times in 30 years has the proportion of women selected been greater than the bounds of the 95% confidence interval, and in those instances the observed proportion of women judges selected was only slightly greater than the expected proportion. If the gender composition of lawyers is an accurate proxy of the candidate pool, then there is no evidence that the use of gender in the selection process systematically favors women judges over men. For advocates of equal gender representation on the bench, however, the selection of women at rates commensurate with the composition of the candidate pool may be viewed as the bare minimum. From this perspective, the selection of women at rates less than 50% is unjust because it reinforces the expectation that women need not be or should not be equally represented in positions of power and provides tacit approval for the current standards for qualification that favor men over women.
Third, this project highlights the importance of continued efforts to diversify the judicial candidate pool and state supreme court benches. While there is no settled standard of gender diversity on state supreme courts, advocates of descriptive representation argue that political bodies ought to mirror the descriptive characteristics of the population. Even though women, given the composition of the candidate pool, have been selected as often as expected, they do not make up 50% of lawyers or supreme court justices. Women have faced—and continue to face—barriers to the accumulation of formal and informal requirements for office (Cook Reference Cook1984; Guinier et al. Reference Guinier, Fine, Balin, Bartow and Lee Stachel1994; Drachman Reference Drachman2001; Epstein et al. Reference Epstein, Knight and Martin2003; Redfield Reference Redfield2009; Rikleen Reference Rikleen2015). These barriers to accessing qualifications, in turn, suppress the diversity of the eligibility pool. Removing the barriers for women to accumulate the necessary qualifications, or more critically, redefining what it means for one to be “qualified,” may help lead to more diverse state supreme court benches over time.
Encouragingly, law school graduation rates and the composition of the legal profession are much more diverse now than even 20 years ago. In fact, there were more women law school graduates than men law school graduates in 2015 and 2016. As these new lawyers mature and acquire informal qualifications, the candidate pool for high office will come to increasingly mirror the gender composition of the electorate. While a more diverse candidate pool may not necessarily lead to a more diverse judiciary (Cook Reference Cook1984), a more diverse candidate pool ought to facilitate efforts to further diversify the judiciary.Footnote 29
Finally, although the aggregate patterns of judicial selection conform to expectations, there is cross-state variation in the timing and consistency of diversification and in the use of gendered patterns of replacement.Footnote 30 This project has not addressed why some states chose to seek out women to replace women while other states did not. What is it about the social, political, or judicial context in Minnesota and Michigan that accounts for the frequent replacement of women judges with women judges? Of course, having more women on the bench provides more opportunities for gendered patterns of turnover, and Minnesota is unique: its seven-judge court had a four-woman majority in 1991 (Margolick Reference Margolick1991). To put that in context, Alaska selected its first woman judge, Dana Fabe, in 1996, and New Hampshire did not select its first woman judge, Linda Stewart Dalianis, until 2000. Furthermore, within a given state, not all women are replaced by women. Under what conditions are governors and political elites most likely to seek out—either implicitly or explicitly—women judges to replace women judges? Future research ought to address cross-state and over-time variation in the use of gendered patterns of judicial turnover. It is possible that patterns of women replacing women developed out of efforts to diversify the bench but could turn into a ceiling that limits the openness of any seat to a woman judge. Future research should continue to explore whether the judiciary—the branch tasked with ensuring equal justice under the law—is selected through fair, equal, and nondiscriminatory practices.
Appendix
Coding Rules: Aggregating 2 Years
Because vacancies and selections do not always occur in the same year, I aggregated 2 years when vacancies and selections did not occur in the same year. Specifically, courts must meet one of three requirements for 2 years to be aggregated. I implement these rules in order; 2 years can only be aggregated under rule 2, for example, if the 2 years are not aggregated under rule 1. The rules are as follows:
Rule 1: If the number of vacancies matched the number of selections in a given year, those selections were paired to those vacancies. Of the 671 state-year-vacancy(s) observations in the unmatched data set, 89 observations were paired under this rule.
Rule 2: If there is a vacancy in year t, no new judge selected in year t, and no vacancy in year t + 1, but there is a judge selected in year t + 1, I aggregate the 2 years so that the judge selected in year t + 1 is counted as the replacement for the judge who retired in year t. Of the 671 state-year-vacancy(s) observations in the unmatched data set, 497 observations were paired under this rule.
Rule 3: In the Bratton data set, judges who take office early in a year but were selected in the previous year are listed as selected in the previous year. Therefore, if a judge retires in year t, no judge is appointed in year t, no judge is selected in year t + 1, and no judge vacated in year t − 1, but a judge was selected in year t − 1, I count the judge selected in year t − 1 as the replacement to the judge who retired in year t. Of the 671 state-year-vacancy(s) observations in the unmatched data set, 16 observations were paired under this rule.
Rule 4: Finally, I aggregate 2 years when there is a discrepancy in the number of vacancies and selections in 1 year but not over 2 years. For example, if one judge retires in year t, no judge is selected in year t, one judge retires in year t + 1, and two judges are selected in year t + 1, I aggregate the 2 years so that the two retiring judges are matched with the two replacement judges. In this case, I treat the aggregated 2 years as 1 year with two vacancies. Of the 671 state-year-vacancy(s) observations in the unmatched data set, 69 observations were paired under this rule.
Disaggregated CMH Tests
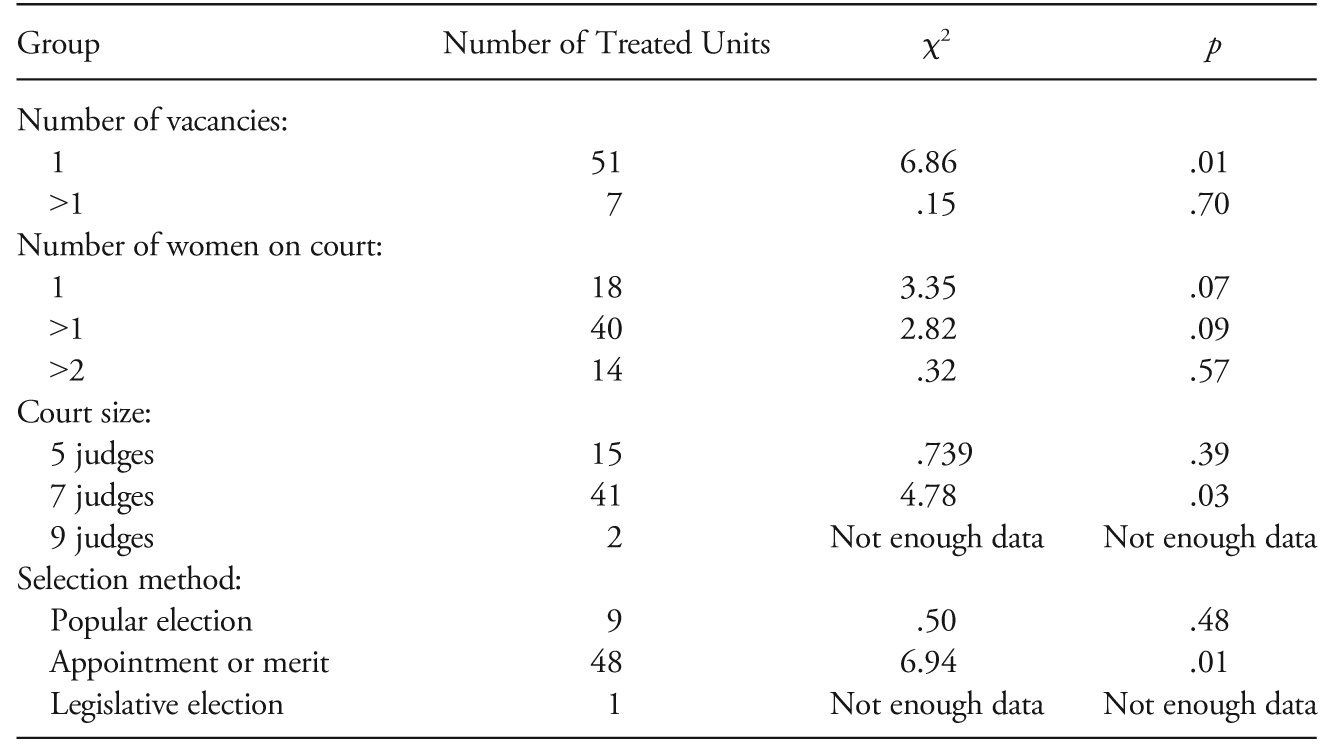
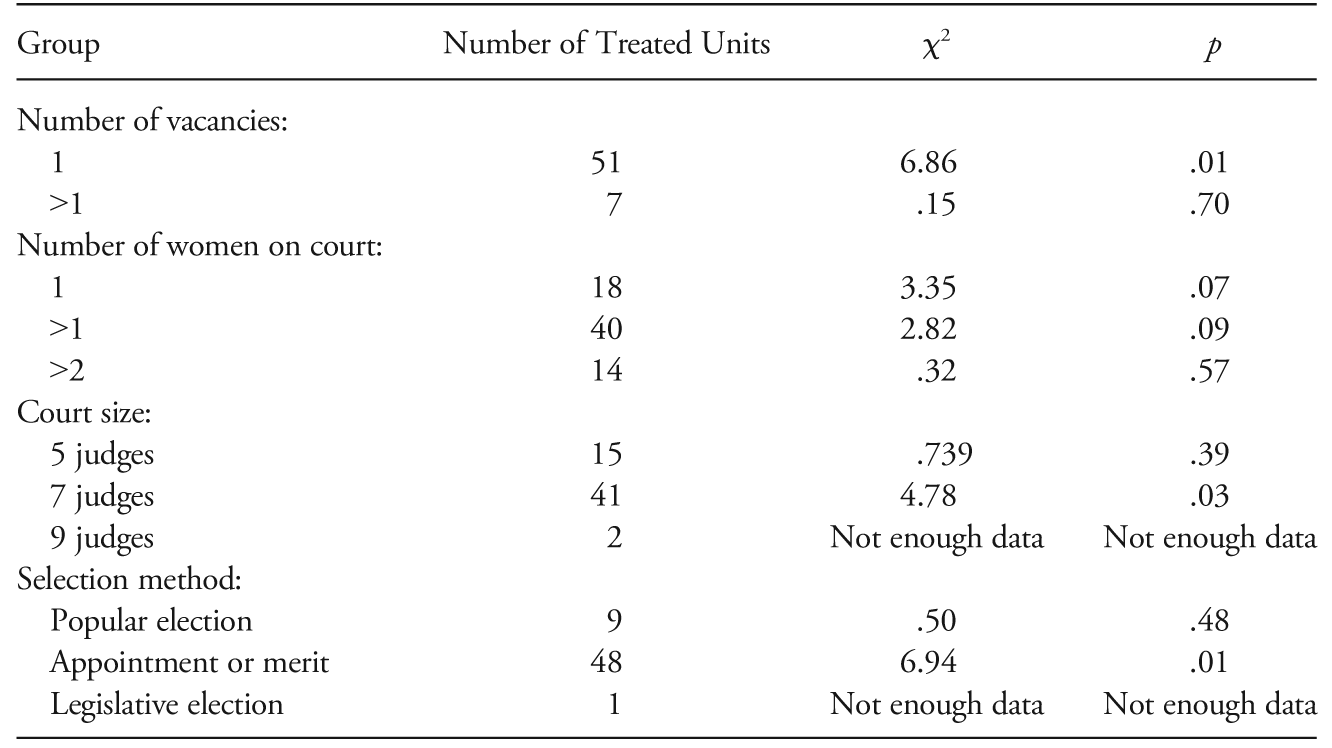
To determine whether the gender of vacating and replacement judges is independent across different conditions, I disaggregate the CMH test across various covariates. Disaggregating across covariates reduces the power of each test. Importantly, all observations are matched on the criteria listed in table A1. The CMH test is flexible to variation across strata, so the aggregated analysis reported in the main text is valid for overall patterns of judicial replacement.
Cochran-Mantel-Haenszel Test, Disaggregated Groups
Candidate Pool Confidence Intervals and Actual Vacancies
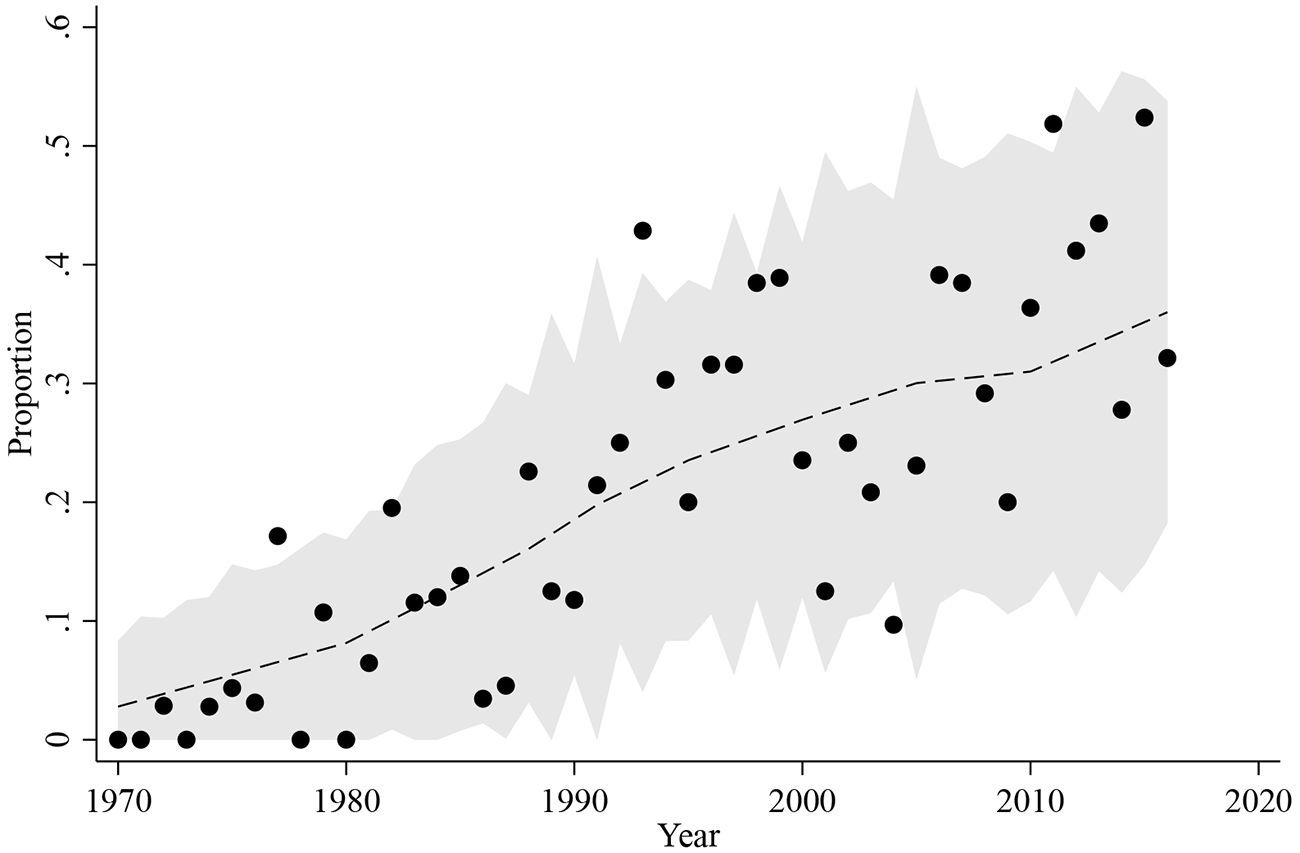
Figure 3 plots the candidate pool of lawyers with confidence intervals calculated with the average number of vacancies each year. Figure A1 shows the same plot but with confidence intervals calculated with the actual number of vacancies each year. Patterns are the same.
Dashed line, Proportion of lawyers who are women over time. Circles, Proportion of judges selected each year who are women. Shaded region, 95% confidence interval for the expected proportion of women selected each year. In this plot, the confidence intervals are calculated with the actual number of vacancies each year.
State-by-State Variation
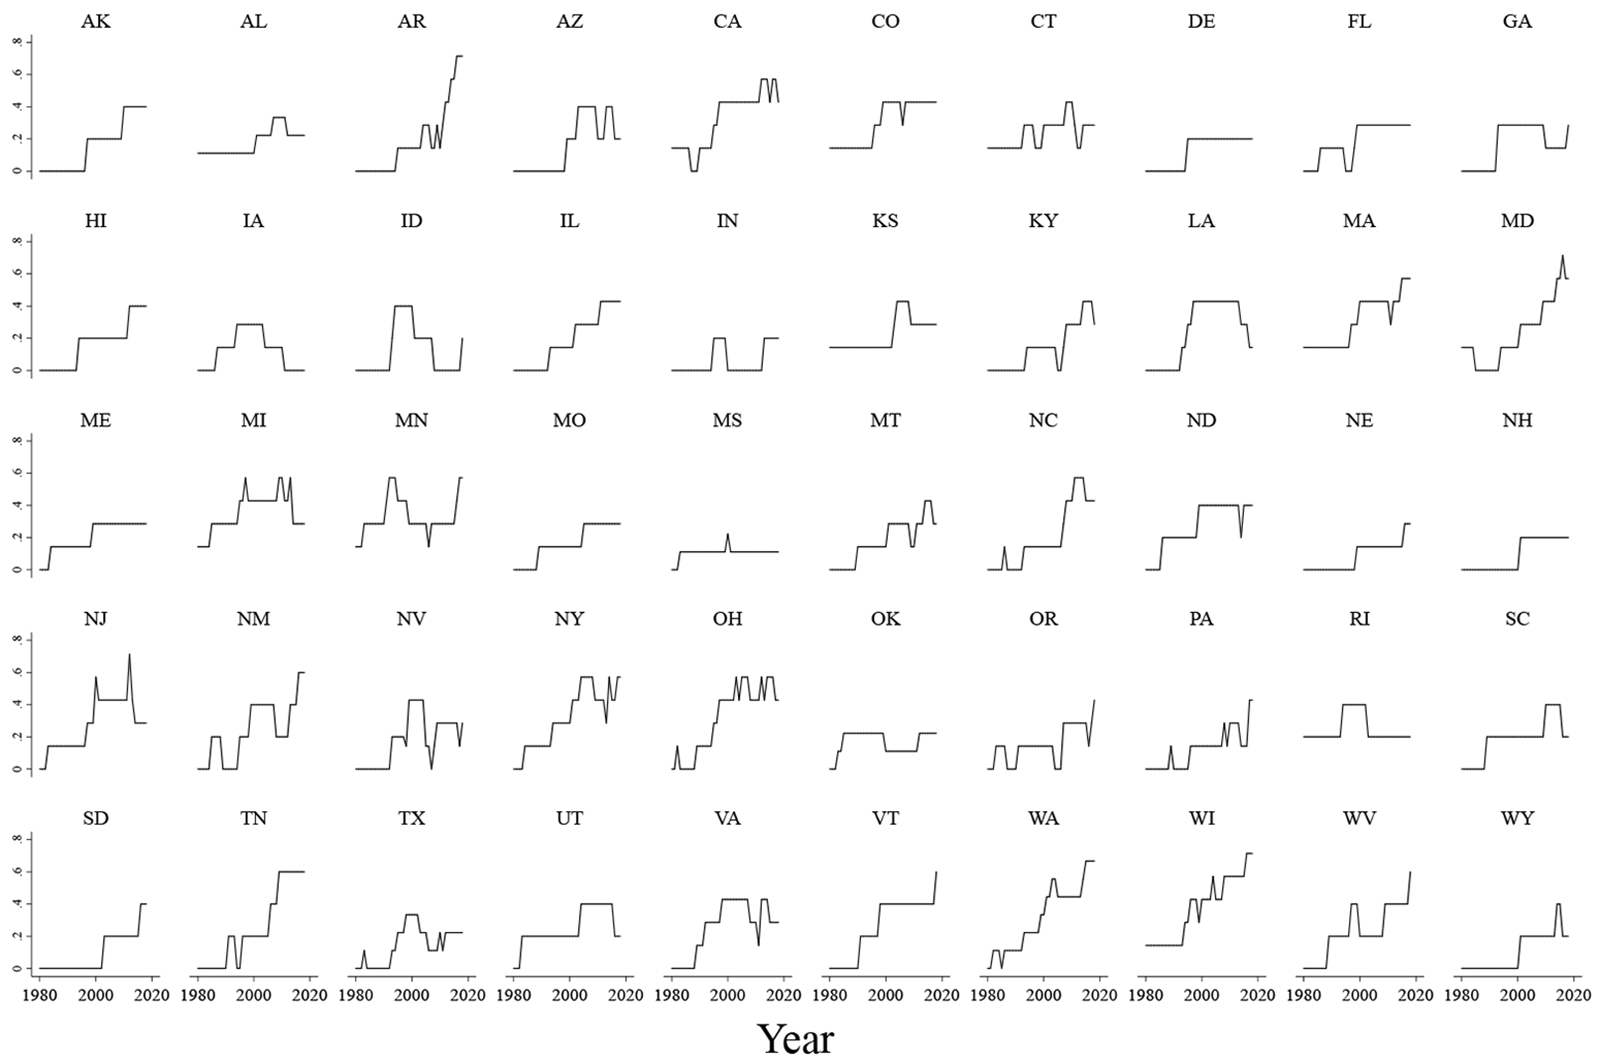
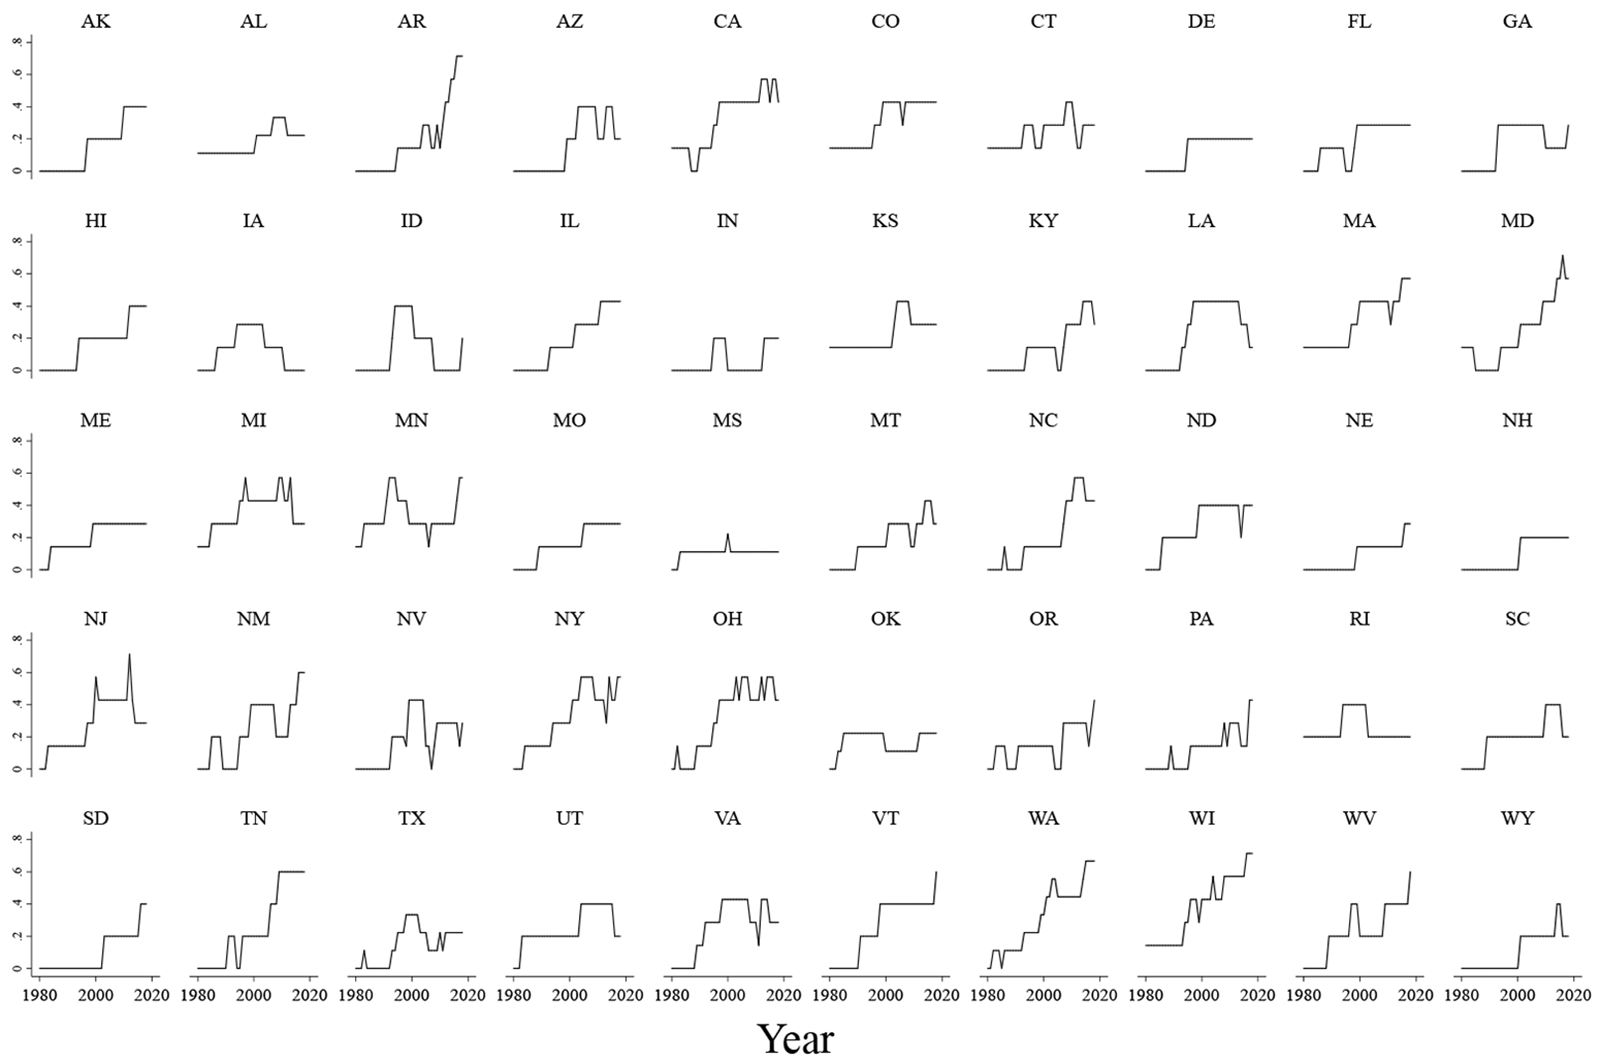
In addition to obscuring over-time stickiness in diversification, aggregate patterns of selection may obscure variation across states in the selection of women judges. Figure A2 shows how the proportion of women supreme court judges varies by state.
Proportion of women judges over time and by state. Truncating the data at 1980 obscures the trajectories of gender diversity in states where women were selected to the bench earlier: Florence Allen served on the Ohio Supreme Court from 1923 to 1934; Anne Alpern served on the Pennsylvania Supreme Court in 1961; Lorna Lockwood served on the Arizona Supreme Court from 1961 to 1975; and Elsijane Trimble Roy served on the Arkansas Supreme Court from 1975 to 1977.
Average percentage of women lawyers from 1970 to 2005, average number of gendered replacements from 1970 to 2005, and average percentage of women judges from 1970 to 2005.