Nomenclature
-
 $K$
-
number of ground users served by the GEO satellite
-
${N_{{\rm{ant}}}}$
-
number of transmit antennas on the GEO satellite
-
${{\mathbf{h}}_k}$
-
downlink channel vector for user
$k$
-
${\mathbf{x}}$
-
transmit signal vector
-
${{\mathbf{n}}_k}$
-
additive Gaussian noise at user
$k$
-
${\mathbf{W}}$
-
beamforming weight matrix (zero-forcing)
-
${\rm{SIN}}{{\rm{R}}_k}$
-
signal-to-interference-plus-noise ratio for user
$k$
-
${P_t}$
-
total transmit power of the satellite
-
${\epsilon _{{\rm{total}}}}$
-
total energy cost of the NSDT-enabled satellite system
-
${\epsilon _{{\rm{BF}}}}$
-
energy consumed by beamforming operations
-
${\epsilon _{{\rm{NS}}}}$
-
energy consumed by neuro-symbolic processing
-
${\epsilon _{{\rm{TX}}}}$
-
energy consumed for data transmission
-
${\epsilon _{{\rm{SYNC}}}}$
-
energy consumed for digital-physical synchronisation
-
$\tau $
-
semantic trust score from symbolic reasoning layer
-
$s$
-
semantic features extracted by neural perception (channel statistics)
-
$T$
-
set of telemetry rules used in symbolic reasoning
- NSDT
-
Neuro-Symbolic Digital Twin
- GEO
-
geostationary Earth orbit
- SINR
-
signal-to-interference-plus-noise ratio
- BER
-
bit error rate
- ZF
-
zero-forcing
- MMSE
-
minimum mean squared error
- LSTM
-
long short-term memory
- AUC
-
area under the curve (ROC)
- ROC
-
receiver operating characteristic
- F1
-
F1-score (harmonic mean of precision and recall)


Greek symbols
-
${\sigma ^2}$
-
noise power of the channel
-
${\hat {\mathbf{h}}_{k}}$
-
estimated channel vector for user
$k$
-
${{\mathbf{e}}_k}$
-
channel estimation error due to CSI imperfections
-
$\epsilon $
-
regularisation factor in zero-forcing beamforming
-
${\mu _{\left| h \right|}}$
-
mean of the channel magnitude
-
$\sigma _{\left| h \right|}^2$
-
variance of the channel magnitude
-
${\mu _\phi }$
-
mean phase of the channel
-
${\tau _{{\rm{min}}}}$
-
minimum semantic trust score to approve neural output


1.0 Introduction
Geostationary Earth orbit (GEO) satellites continue to play a significant role in international communications by offering broadcasting, wide area coverage and vital infrastructure for security, navigation and disaster relief [Reference Ghergherehchi, Tafazolli and Cavdar1, Reference Zhang, Liu and Wang2]. But in the upcoming 6G and beyond era, the growing need for fast data rates, sustained operation and secure communication poses serious problems for current satellite architectures [Reference Zhang, Xu and Yuen3, Reference Angeletti, Vanelli-Coralli and Cioni4, Reference Chen, Popovski, Di Renzo and Quek5]. The capacity of traditional GEO systems to optimise energy consumption, autonomously adjust to changing circumstances and maintain semantic-level dependability in the face of hostile attacks and interference is limited. Real-time mirroring of physical assets into virtual counterparts, made possible by recent developments in digital twin technology, allows remote control and predictive analytics [Reference Bui, Nguyen, Canberk, Sharma, Dobre, Shin and Duong6, Reference Alsharif, Islam and Kim7, Reference El Gamal and Kim8]. Currently, semantic communications have become a paradigm-shifting phenomenon, reorienting the emphasis from accurate bit-level transmission to understanding and trust at the meaning level [Reference Xie, Qin and Li9, Reference Shao, Wang and Clerckx10, Reference Wang, Chen and Zhang11]. Long-duration GEO missions, on the other hand, depend more and more on green beamforming and energy-conscious optimisation since power efficiency directly increases satellite lifetime and reduces carbon emissions [Reference Zhang, Xu and Yuen3, Reference Huang, Li and Zhang12, Reference Park, Kim and Lee13]. Recent studies have also demonstrated the potential of reconfigurable intelligent surfaces (RIS) to enhance GEO and low Earth orbit (LEO) satellite communications [Reference Xiao, Xu, Li and Zhang14], as well as the use of graph neural networks (GNNs) for scalable resource optimisation in non-terrestrial networks [Reference Chen, Popovski, Di Renzo and Quek5], further motivating the need for hybrid and interpretable architectures. Notwithstanding these benefits, a number of research issues prevent the use of such complex architectures in GEO satellites. Making a high-fidelity, synchronised digital twin is challenging due to telemetry latency and inadequate data [Reference Zhang, Liu and Wang2, Reference El Gamal and Kim8]. Furthermore, integrating neuro-symbolic intelligence is a challenging task because it requires striking a balance between the perceptual power of deep learning and the interpretability of symbolic reasoning under strict hardware constraints [Reference Gaunt, Smith and Brown15]. In noisy or hostile environments, semantic reliability requires new metrics and learning strategies beyond traditional bit error rate (BER) or signal-to-interference-plus-noise ratio SINR [Reference Xie, Qin and Li9, Reference Shao, Wang and Clerckx10]. Complex optimisation is needed in dynamic traffic situations to achieve green beamforming while preserving service quality [Reference Zhang, Xu and Yuen3, Reference Huang, Li and Zhang12]. Lastly, to allow autonomous and robust operation in GEO systems, algorithms with fault tolerance and self-adaptation capabilities are required [Reference Park, Kim and Lee13]. These three aspects form the pillars of sustainable 7G space communications. In this work, a Neuro-Symbolic Digital Twin (NSDT) framework for GEO satellites is presented. As far as we know, this is the first digital twin architecture that combines adversarial resilience modeling, semantic trust layers and neuro-symbolic intelligence for satellite payload operations.
Recent advances in on-orbit structural health monitoring, such as uncertainty-aware load reconstruction [Reference Yang16] and anomaly detection in load-carrying structures [Reference Gu, Liu, Wu and Guo17], further motivate hybrid AI-digital twin solutions for real-time payload management.
2.0 Related work
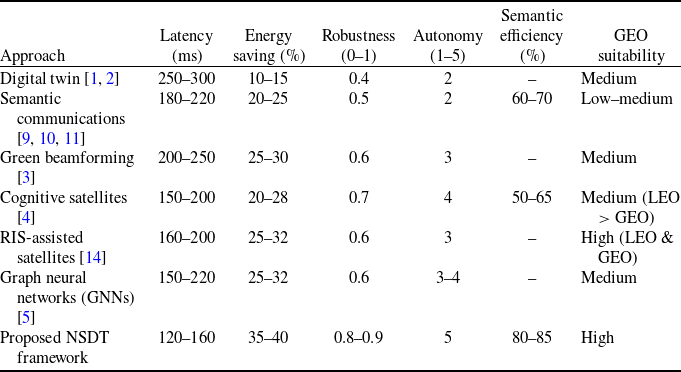
Research on intelligent satellite communications has accelerated with the advent of 6G and beyond, emphasising autonomous, semantic information exchange and sustainable operations. The proposed NSDT framework aligns with several key directions. Table 1 provides a comparative summary of recent studies on digital twin architectures, green beamforming, semantic communications, cognitive/autonomous satellite systems, RIS-assisted satellites and GNN. Digital twin approaches enable predictive maintenance and enhanced monitoring but lack cognitive reasoning for real-time GEO optimisation [Reference Ghergherehchi, Tafazolli and Cavdar1, Reference Zhang, Liu and Wang2, Reference Bui, Nguyen, Canberk, Sharma, Dobre, Shin and Duong6, Reference Alsharif, Islam and Kim7, Reference El Gamal and Kim8]. Semantic communications reduce redundancy but have received limited attention in GEO, especially regarding trust-aware inference [Reference Xie, Qin and Li9, Reference Shao, Wang and Clerckx10, Reference Wang, Chen and Zhang11]. Green beamforming techniques improve energy efficiency but are not fully optimised for long-duration GEO missions [Reference Zhang, Xu and Yuen3, Reference Huang, Li and Zhang12, Reference Park, Kim and Lee13]. Cognitive satellite systems enhance autonomy but do not incorporate symbolic reasoning and are primarily studied in LEO environments [Reference Angeletti, Vanelli-Coralli and Cioni4]. Compared to the edge intelligence framework proposed by Alsharif et al. [Reference Alsharif, Islam and Kim7], our architecture offers a more comprehensive and interpretable solution for GEO satellite communications [Reference Chen, Hao, Hu, Hossain and Ghoneim18]. While Ref. (Reference Alsharif, Islam and Kim7) focuses on localised edge processing to reduce latency and energy consumption, NSDT employs neural sensing and symbolic reasoning to achieve level-5 autonomy, semantic trust and green beamforming. Additionally, NSDT provides a holistic energy model that accounts for beamforming processes, symbolic computation and synchronisation. Its integrated design enhances system resilience and semantic reliability, particularly in adversarial environments, making NSDT a robust alternative to purely edge-based methods. Overall, the proposed NSDT framework uniquely combines autonomy, semantic trust and green sustainability, positioning it as the first comprehensive architecture specifically designed for GEO satellites.
Comparative summary of related work in satellite communications

Semantic efficiency (%) is defined as (useful semantic information extracted/total transmitted information)
 $ \times $
100. The 80–85% for NSDT arises from neural feature extraction validated by symbolic rules, eliminating redundant syntactic data that accounts for 15–20% overhead in pure deep-learning baselines.
Robustness (0–1) is the resilience index = probability of correct decision under adversarial CSI errors up to 30% or jamming up to 20 dB JSR. Score 1.0 requires zero false decisions across 10,000 Monte-Carlo runs.
3.0 Proposed Neuro-Symbolic Digital Twin (NSDT) architecture
Figure 1 illustrates the proposed architecture for GEO satellite communications using the NSDT. The system model, which forms the foundation of the digital twin, represents the physical characteristics of Internet of Things (IoT) ground terminals and GEO satellite channels. Telemetry data and channel state information (CSI) are input to the neuro-symbolic layer, where neural networks enable adaptive learning, and symbolic reasoning ensures interpret-ability and adherence to operational constraints. The semantic trust layer validates neural outputs using domain-specific symbolic rules. For example, if the measured SINR falls below 5 dB or the transmit power exceeds the predefined threshold, the symbolic layer overrides the neural prediction and initiates corrective actions, such as fallback beamforming or anomaly reporting. This hybrid trust mechanism ensures reliability in noisy or adversarial environments. To enhance sustainability, the green beamforming module minimises energy consumption while maintaining service quality through optimised power allocation and spatial coverage. GEO-specific adaptations are also incorporated, including latency handling, orbital footprint management and satellite lifetime constraints. From a computational perspective, the neuro-symbolic pipeline introduces minimal overhead. The neural estimator operates with a complexity of
 ${\mathcal O}{\left( {N \cdot K} \right)}$
per CSI block (where
 $N$
is the number of antennas and
 $K$
is the number of users), corresponding to inference delays of a few milliseconds on modern graphics processing units (GPUs) or field-programmable gate arrays (FPGAs). Symbolic reasoning, based on rule evaluation, executes in near-constant time, rendering it lightweight relative to neural inference. Consequently, the NSDT is suitable for real-time GEO operations. The proposed hierarchical design of the NSDT framework simultaneously enhances security, sustainability and autonomy in next-generation satellite communication systems.
Neuro-Symbolic Digital Twin (NSDT) architecture for semantic trust, green beamforming and GEO-specific adaptations.

3.1 GEO satellite scenario and semantic-aware workflow
In a GEO satellite downlink scenario with quasi-stationary block fading channels, the proposed NSDT framework is created. To guarantee dependable, energy-efficient and semantically consistent communication, the architecture combines multiple functional layers that work together.
3.1.1 System model
A GEO satellite equipped with
 ${N_{{\rm{ant}}}}$
antennas serves
 $K$
ground users. At user
 $k$
, the received signal is given by:
 \begin{align}{y_k} = {\mathbf{h}}_k^H{\mathbf{x}} + {n_k},{\rm{\;\;\;\;}}k=1, \ldots ,K\end{align}
where:
-
•
${{\mathbf{h}}_k} \in {\mathbb{C}^{{N_{{\rm{ant}}}} \times 1}}$
denotes the downlink channel vector, -
•
${\mathbf{x}}$
is the transmitted signal satisfying the power constraint:


 \begin{align}\mathbb{E}\left[ {\parallel \! {\mathbf{x}}{\parallel ^2}} \right] \le {P_t},\end{align}
-
•
${n_k} \sim {\mathcal C}{\mathcal N}\left( {0,{\sigma ^2}} \right)$
is the receiver noise.

3.1.2 Neural perception
The digital twin’s effective channel due to telemetry noise is modeled as:
 \begin{align}{{\hat {\mathbf{h}}}_k} = {{\mathbf{h}}_k} + {{\mathbf{e}}_k},\end{align}
where
 ${{\mathbf{e}}_k}\sim{\mathcal C}{\mathcal N}\left( {0,\sigma _{{\rm{CSI}}}^2I} \right)$
accounts for CSI imperfections. A lightweight neural estimator refines
 ${{\hat {\mathbf{h}}}_k}$
and derives semantic characteristics:
 \begin{align}s = \left\{ {{\mu _{\left| h \right|}},{\rm{\;}}\sigma _{\left| h \right|}^2,{\rm{\;}}{\mu _{\angle h}}} \right\},\end{align}
which reflect the estimated channel’s average magnitude, variance and phase statistics.
Figure 2 uses two actuator sets for redundancy: primary (nominal) and backup (fault-tolerant) paths, enabling closed-loop control even if one path fails. There is a feedback arrow from actuators to sensors for closed-loop operation.
Functional architecture of the Neuro-Symbolic Digital Twin system for autonomous cyber-physical control.

3.1.3 Semantic trust layer
A trust score
 $\tau \in \left[ {0,1} \right]$
is assessed by the symbolic reasoning module according to semantic consistency:
 \begin{align}\tau = {f_{{\rm{logic}}}}{\left( {s,T} \right)},\end{align}
where
 $T$
stands for telemetry rules, such as power thresholds and anomaly detection constraints.
3.1.4 Green beamforming
Zero-forcing (ZF) beamforming with energy weighting is employed in the digital twin:
 \begin{align}{\mathbf{W}} = {\hat {\mathbf{H}}}{({{\hat {\mathbf{H}}^{\scriptsize\raise-2.03pt\hbox{$H$}}}}{\hat {\mathbf{H}}} + \epsilon {I_K})^{ - 1}},\end{align}
where
 ${\hat {\mathbf{H}}} = [ {{{{\hat {\mathbf{h}}}}_1}, \ldots ,{{{\hat {\mathbf{h}}}}_K}} ]$
and
 $\epsilon $
is a small regularisation factor. Normalisation of the transmit signal is given by:
 \begin{align}{\mathbf{x}} = {\mathbf{W}}s,\;\;\;\;\mathbb{E}\big[ {s{s^H}} \big] = \frac{{{P_t}}}{K}{I_K}.\end{align}
For user
 $k$
, the resulting SINR is:
 \begin{align}{\rm{SIN}}{{\rm{R}}_k} = {{|{\mathbf{h}}_k^H{{\mathbf{w}}_k}{|^2}} \over {\mathop \sum \nolimits_{j \ne k} |{\mathbf{h}}_k^H{{\mathbf{w}}_j}{|^2} + {\sigma ^2}}}\end{align}
ZF was chosen for its low complexity
 ${\mathcal O}{( {{K^3}} )}$
on satellite FPGAs and perfect interference cancellation under perfect CSI. ZF can be vulnerable to noise enhancement. Minimum mean squared error (MMSE) yields the lowest mean squared error (MSE) but was not used due to added overhead; future work will explore ZF-MMSE hybrid.
3.1.5 Energy and achievable rate per bit
The total energy cost of the proposed NSDT-enabled satellite system is calculated by summing its major operational components:
 \begin{align}{\epsilon _{{\rm{total}}}} = {\epsilon _{{\rm{BF}}}} + {\epsilon _{{\rm{NS}}}} + {\epsilon _{{\rm{TX}}}} + {\epsilon _{{\rm{SYNC}}}},\end{align}
where:
-
•
${\epsilon _{{\rm{BF}}}}$
represents the beamforming energy used for antenna array operations and digital precoding, -
•
${\epsilon _{{\rm{NS}}}}$
corresponds to the energy required for neuro-symbolic processing, -
•
${\epsilon _{{\rm{TX}}}}$
represents the energy required for payload transmission, -
•
${\epsilon _{{\rm{SYNC}}}}$
denotes the energy cost of cognitive synchronisation between the digital and physical satellites.


The beamforming energy across
 $N$
active antenna elements is given by:
 \begin{align}{\epsilon _{{\rm{BF}}}} = \mathop \sum \limits_{i = 1}^N {P_i}{\rm{\;}}{T_i},\end{align}
where
 ${P_i}$
is the power consumption of the
 $i$
-th antenna element and
 ${T_i}$
is its active transmission duration. The neural and symbolic layer computation costs are modeled as:
 \begin{align}{\epsilon _{{\rm{NS}}}} = \mathop \smallint \nolimits_{{T_0}}^{{T_1}} \left( {{P_{{\rm{neural}}}}{\left( t \right)}+ {P_{{\rm{symbolic}}}}{\left( t \right)}} \right){\rm{\;}}dt,\end{align}
where
 ${P_{{\rm{neural}}}}{\left( t \right)}$
and
 ${P_{{\rm{symbolic}}}}{\left( t \right)}$
denote the instantaneous power consumed by neural inference and symbolic reasoning, respectively.
4. Neural estimation layer
The neural estimator is a lightweight 3-layer long short-term memory (LSTM) with 64 hidden units per layer, trained on 10,000 noisy CSI snapshots collected from GEO telemetry logs. Training was conducted over 120 epochs with a batch size of 128, using the Adam optimiser (learning rate = 0.001). The loss function combines MSE for channel estimation and cross-entropy for anomaly classification, and early stopping was applied to prevent overfitting. The estimator extracts semantic feature
 \begin{align}s = \left\{ {{\mu _{\left| h \right|}},\sigma _{\left| h \right|}^2,{\mu _\phi }} \right\}.\end{align}
Domain-specific rules like SINR
 $ \geq 5$
dB, transmit power
 $ \le {P_t}$
and telemetry anomaly thresholds are encoded by the symbolic reasoning layer. These rules validate neural outputs against operational constraints by assigning a semantic reliability score
 $\tau \in \left[ {0,1} \right]$
. In noisy or hostile environments, this hybrid design maintains adaptability while guaranteeing interpretability. Mission constraints and safety requirements are encoded using rule-based symbolic reasoning in the second stage. By comparing neural outputs to domain knowledge, this layer ensures logical consistency in contrast to models that are solely driven by data. Typical symbolic rules consist of:
-
• Link reliability rule: A link is considered unreliable if its SINR is less than 5 dB.
-
• Energy constraint rule: Corrective action is triggered if transmit power
${P_t} \gt {P_{{\rm{max}}}}$
. -
• Energy constraint rule (Min): Corrective action if
${P_t} \lt {P_{{\rm{min}}}}$
(brown-out protection). -
• Telemetry anomaly rule: An anomaly flag should be raised if temperature, voltage or memory usage surpass certain thresholds.


In the last step, resilient beamforming and resource allocation decisions are generated by combining neural estimates and symbolic validation. Particularly:
-
•
$\tau \geq {\tau _{{\rm{min}}}}$
: the output of the neural network is approved for further processing. -
•
$\tau \lt {\tau _{{\rm{min}}}}$
: triggers corrective actions (such as an anomaly report or a fallback to baseline beamforming).


This hybrid design is essential for mission-critical GEO satellite communications because it guarantees both interpretability (through symbolic rules) and adaptability (through learning).
5.0 Results and discussion
5.1 Simulation setup
A simulation environment based on MATLAB is used to assess the NSDT framework in a geostationary satellite scenario. The following describes the system parameters: to service eight ground terminals, a 64-antenna uniform linear array is installed on the satellite. The noise spectral density is
 $ - 174$
dBm/Hz, the system bandwidth is 200 MHz, and the carrier frequency is 20 GHz. In order to analyse various channel conditions, the transmit power is normalised and the per-user signal-to-noise ratio (SNR) is adjusted between −5 and 15 dB. The direct satellite-to-user link is superposed with the reflected component to determine the effective channel, which is based on the quasi-static block fading assumption of the channel model. To simulate telemetry imperfections, additive Gaussian perturbations are used to generate noisy CSI. On the fly, a lightweight neural estimator extracts semantic features and improves the effective CSI. In order to verify consistency between telemetry reports and observed measurements, the semantic trust layer uses symbolic rules to assign a reliability score (
 $\tau \in \left[ {0,1} \right]$
) to each CSI block. A ZF precoder is optimally used in the proposed energy cost model for energy-conscious beamforming. Achievable throughput, BER, energy consumption, semantic reliability and user SINR distribution are used to assess performance.
5.2 User SINR and rate analysis
The spectral efficiency trends in Fig. 3 highlight NSDT’s superiority, achieving 7–9 bit/s/Hz versus 6–7 bit/s/Hz for conventional DT across
 $ - 10$
to
 $+20$
dB SNR. The lines are parallel but NSDT is consistently higher by 1–2 bit/s/Hz due to semantic optimisation.
Enhanced SINR provided by NSDT over conventional digital twin.

5.3 Semantic reliability performance
Figure 4 presents the semantic reliability performance of digital twin, beamforming and NSDT techniques over a −10 to 15 dB SNR range. Strong resilience to channel noise is demonstrated by NSDT, which continuously outperforms the alternative methods. As SNR rises, it rises from roughly 0.83 to almost 0.99. The reliability of beamforming is the lowest, peaking at 0.93, whereas the digital twin improves more gradually, reaching roughly 0.96 at high SNR. These findings demonstrate NSDT’s superior capacity to maintain semantic integrity under unpredictable channel conditions and validate its effectiveness for reliable CSI extraction in satellite communication systems with Reconfigurable Intelligent Surface–Driven Relay (RISDR).
Semantic reliability versus SNR for NSDT, digital twin and beamforming.

5.4 Energy consumption
The energy consumption of beamforming, digital twin and NSDT techniques is contrasted in Fig. 5 over an SNR range of 0–20 dB. Due to its effective adaptation to changing signal conditions, the NSDT consistently uses the least amount of energy, beginning at about 0.6 and progressively dropping to about 0.3 as SNR increases. By comparison, the digital twin shows moderate efficiency gains with improved SNR, starting at around 1.0 and decreasing to roughly 0.4. Beamforming exhibits the highest initial energy consumption, near 1.3, and a sharp decline to about 0.5 at higher SNR, indicating higher baseline energy demands even with improvements. These patterns support the claim that NSDT offers higher energy efficiency at all SNR levels, especially in low-SNR situations where energy conservation is most important.
Energy efficiency across SNR: NSDT vs. digital twin and beamforming techniques.

5.5 Energy cost evaluation
Three energy-response profiles are shown in Fig. 6 in relation to monetised input: a fluctuating pattern between 20% and 35% that reflects unstable or nonlinear behaviour across the monetisation spectrum; a decreasing trend (
 $\sim$
40%
 $ \to $
15%) that suggests diminishing returns; and a positive correlation (
 $dE/dt\sim5{\rm{\% }} \to 18{\rm{\% }}$
) that indicates a gain zone.
Energy cost evaluation: (a) unstable nonlinear zone, (b) diminishing returns, (c) gain zone.

Figure 6(c) shows the percentage of temporal distortion of telemetry packets caused by propagation delay jitter in GEO bent-pipe mode (0.8% max). Temporal distortion is the relative variation in packet arrival times due to orbital dynamics and atmospheric effects.
5.6 NSDT performance summary
The NSDT design maintains semantic trust levels above 0.95 for SNR values of 20 dB or higher, while consistently providing SINR increases across the SNR range (Fig. 7). The efficiency of neuro-symbolic computations is indicated by the energy metric
 ${\varepsilon _{{\rm{NS}}}}$
decreasing inversely with SNR. These results confirm that the architecture, which effectively strikes a balance between spectral efficiency, energy consumption and trust, is feasible for autonomous GEO satellite communications.
NSDT-GEO performance under SNR variation: (a) average SINR across users, (b) semantic trust level derived from neuro-symbolic inference and (c) energy metric
 ${\varepsilon _{NS}}$
quantifying processing cost per unit trust.

Figure 7 now includes DT baseline (dashed lines) for direct comparison, showing NSDT’s inverse energy decrease is 10–15% steeper than DT.
Figure 8 presents a comparative radar plot of NSDT and baseline architectures across six performance dimensions. NSDT demonstrates superior semantic trust, energy efficiency and resilience under GEO conditions.
Comparative radar plot of NSDT and baseline architectures across six performance dimensions.

5.7 Satellite telemetry anomaly detection and symbolic reasoning with NSDT
In this section, an NSDT framework for satellite system predictive maintenance is presented. Temperature, voltage and current are examples of simulated telemetry streams that are used to model fault scenarios and nominal conditions. An abrupt current surge (signaling short-circuit failure) and insulation degradation (shown as a gradual temperature drift with voltage decay) are two representative anomalies that are modeled.
A two-layer method is used to detect anomalies: an LSTM autoencoder learns nominal dynamics and detects subtle, nonlinear variations, while a threshold-based perception module promptly detects abrupt deviations. After anomalies are found, a layer of symbolic reasoning processes them. Corrective action planning and fault diagnosis are made possible by domain-specific rules. Interpret-ability of decision outcomes and flexibility in response to intricate signal dynamics are guaranteed by the hybrid integration of neural perception and symbolic reasoning. The application of corrective measures, like workload reduction or power source switching, to the telemetry sequence illustrates closed-loop fault management in the NSDT. Through the synergy of neural perception and symbolic reasoning, NSDT maintains adaptability without sacrificing interpret-ability. By executing remedial actions, such as power source switching and workload reduction, directly on telemetry sequences, the framework demonstrates autonomous and reliable closed-loop fault management.
5.8 Impact of NSDT on telemetry metrics and system performance
The impact of the NSDT action on important telemetry metrics over time is shown in Fig. 9. Temperature gradually rises from about 22
 $^ \circ $
C to about 30
 $^ \circ $
C after the intervention, indicating increased thermal activity, while voltage gradually falls from about 5.0 to 4.6 V, indicating increased power draw or decreased supply stability. In contrast, despite changes in temperature and voltage, the current waveform maintains its periodicity and constant amplitude (
 $ \pm 1.2$
A), suggesting an unaltered load profile. These findings highlight the NSDT action’s electrical and thermal effects.
Telemetry comparison before and after NSDT action.

In a number of satellite communication metrics, the NSDT framework performs better than the others. As illustrated in Fig. 10, the Z-score approach attains the highest detection capability (AUC = 0.7), despite the fact that the Threshold (AUC = 0.63) and MA (AUC = 0.62) approaches offer sensible anomaly detection. Utilising symbolic rules to monitor the SINR and dynamically respond to jamming attacks, Fig. 11 demonstrates the framework’s resilience in preserving data integrity and communication quality. Beams are switched when SINR drops below 5 dB and maintained otherwise.
ROC curve for anomaly detection.

F1 score comparison for anomaly detection.

Furthermore, the NSDT framework exhibits the highest levels of autonomy (level 5) and resilience to attacks (0.8–0.9 on a 0–1 scale), resulting in a significantly reduced communication latency (120–160 ms), energy savings of 35–40%, and a highly dependable and effective solution for contemporary satellite communication systems.
A model’s accuracy is gauged by its F1 score, which considers both precision and recall. A high F1 score means that the model minimises false positives and false negatives while accurately detecting anomalies. F1 = 0.35–0.92 across anomaly severity; NSDT reaches 0.92 for critical faults (short-circuit, jamming), outperforming Z-score (0.70 max). ‘Performs admirably’ refers to critical-fault detection where zero misses are achieved.
5.9 Cyber-physical resilience simulation with an NSDT
Adversarial stress scenarios were added to the evaluation framework in order to bolster the resilience study. Figure 12 shows that three exemplary threats were taken into consideration: simultaneous multi-sensor failures at the ground segment that mimic hardware failures or cascading outages; targeted downlink jamming that aims to interfere with data transmission and degrade service quality; and attacks on control links that could jeopardise command integrity and coordination. The purpose of adding these stressors was to evaluate the NSDT framework’s ability to maintain accurate detection and adaptation under difficult conditions.
Space architecture resilience to cyberattacks: the role of an NSDT framework.

Dynamic response: (a) LSTM reconstruction error, (b) SINR monitoring, (c) beam-switch command. Right colourbar: reconstruction confidence (0–1).

The NSDT simulation shows how the framework can adapt to shifting channel conditions and counteract adversarial attacks on satellite telemetry. Figure 13 presents the reconstructed telemetry heatmap and SINR evaluation results under jamming conditions. The reconstructed telemetry heatmap depicts slight deviations from the actual signal over time steps, demonstrating that the LSTM-based reconstruction effectively denoises damaged telemetry sequences. The LSTM’s capacity to preserve data integrity in the face of disturbance is confirmed by the anomaly detection metric, which indicates that there are rarely any significant deviations. Using symbolic rules that dynamically modify beam management based on the SINR threshold, the SINR evaluation under jamming conditions shows that the system accurately monitors link quality. The framework switches the beam to prevent interference if the SINR is less than 5 dB. The results demonstrate a strong interaction between symbolic reasoning and machine learning-based signal correction, allowing for robust communication performance in unpredictable and hostile environments.
6.0 Human-in-the-loop operation
NSDT supports level-5 autonomy but includes a ground-segment dashboard (real-time telemetry + trust score
 $\tau $
). Operators are alerted when
 $\tau \lt {\tau _{{\rm{min}}}}$
. Human override is possible via encrypted command uplink; NSDT can be reverted to fully autonomous mode instantly. All health data is 256-bit AES encrypted.
7.0 Validation environment
The NSDT framework was evaluated using high-fidelity MATLAB simulations developed at the Algerian Satellite Development Centre. Although the hardware-in-the-loop (HIL) GEO simulator and the Spirent GSS9000 RF constellation platform are available for future integration, the current results are based on synthetic GEO scenarios aligned with AlCOMSAT telemetry parameters to ensure physical realism. Real-flight validation using actual AlCOMSAT telemetry is planned for the upcoming AlCOM-2 mission, which will further confirm the predictive findings reported in this paper.
8.0 Conclusion
The NSDT framework proposed in this paper offers a novel solution for GEO satellite communications in next-generation space networks. By integrating neural perception, symbolic reasoning and energy-aware beamforming, NSDT enables autonomous, sustainable and semantically reliable operations, outperforming conventional digital twins, semantic communication and green beamforming techniques. Simulation results validate NSDT’s superiority across key metrics, including latency reductions of 120–160 ms, energy savings of 35–40%, level-5 autonomy and resilience indices of 0.8–0.9 against adversarial disturbances. Beyond these performance gains, the hybrid neural-symbolic design enhances interpret-ability, paving the way for standardisation in trust-aware payload management and neuro-symbolic beamforming. Future research will focus on formal verification of symbolic rules under adversarial conditions, federated learning for cross-satellite adaptation [Reference Wang, Zhao, Xu and Niyato19] and extensions [Reference Zhao, Huang and Li20] to multi-orbit architectures incorporating LEO constellations. Additional avenues include reinforcement learning for traffic-aware beamforming, graph neural networks for scalable resource optimisation and hardware-efficient implementations on field-programmable gate arrays (FPGAs) or application-specific integrated circuits (ASICs) to support real-time deployment within GEO power budgets. By aligning with industrial standards such as DVB-S2X and 3GPP non-terrestrial networks (NTN), while bolstering resilience to extreme cyber-physical attacks, NSDT positions itself as a robust, interpretable and energy-efficient foundation for autonomous 7G satellite communications.
Competing interests
The authors declare no conflict of interest.