


1. Introduction
Small- and medium-sized enterprises (SMEs) in Canada, especially newer companies, face notable administrative challenges in complying with goods and services tax/harmonized sales tax (GST/HST) obligations. Beginning with reporting periods in 2024, the Canada Revenue Agency (CRA) has mandated electronic filing for nearly all GST/HST registrants, with exceptions for charities and selected listed financial institutions (Canada Revenue Agency, 2024a). Annual filers with a net tax of CAD 3,000 or more for the previous year are also required to make quarterly installment payments, which adds to the administrative workload for smaller businesses (Canada Revenue Agency, 2024a).
However, GST/HST returns continue to rely on manual data entry and reconciliation, requiring businesses to input sales, tax and credit details directly into their returns rather than through automated invoice data integration (Canada Revenue Agency, 2021a). Although digital invoicing frameworks have been implemented internationally, Canada currently lacks a real-time e-invoicing system that could enable prefilled returns or automatic data exchange between business invoices and tax submissions (Canada Revenue Agency, 2021b; Rocha, Reference Rocha2022). This manual process increases the potential for clerical errors and adds to compliance complexity, particularly for SMEs with limited in-house accounting resources.
Empirical evidence suggests that smaller firms bear disproportionately higher compliance costs relative to larger corporations owing to their limited administrative capacity and higher per-transaction reporting expenses (Fraser Institute, 2019). Introducing real-time e-invoicing could therefore improve accuracy, streamline administrative processes and reduce compliance burdens for Canadian SMEs (Rocha, Reference Rocha2022).
SMEs, which represent 99 % of all businesses in Canada, often lack the internal resources to manage the complexities of GST/HST compliance and, as a result, face disproportionately higher regulatory burdens (Canadian Federation of Independent Business, 2025). According to surveys conducted by firms in the Organization for Economic Co-operation and Development (OECD) and the EU, per-firm compliance costs relative to turnover or value-added tax (VAT) collected are significantly higher for small and micro enterprises than for larger firms (OECD, 2015; European Commission, 2018). This burden could be significantly reduced by implementing a more effective system, such as a prefilled GST/HST return system based on the tax administration utilizing electronic invoicing data. By automating tax reporting, such a model could streamline compliance for SMEs and improve the overall effectiveness of Canada’s system for GST/HST tax administration.
Countries such as Chile, Estonia and Italy have successfully implemented automated VAT return systems supported by national e-invoicing infrastructures, resulting in notable improvements in tax compliance and administrative efficiency (Rocha, Reference Rocha2022; OECD, 2022a). In contrast, Canada has not yet adopted a comparable approach. Despite the global momentum toward automating VAT returns, academic and policy literature on the subject for Canada remains limited. This lack of research presents a significant gap, particularly as other jurisdictions increasingly demonstrate the feasibility and net benefits of such innovations.
To address this gap, this paper conducts a cost–benefit analysis to estimate the potential financial and economic benefits of implementing a prefilled GST/HST return system in Canada. As electronic invoicing is being adopted at a rapid pace around the world and is almost comprehensive across Latin America (Barreix & Zambrano, Reference Barreix and Zambrano2018), we undertake this analysis on the assumption that e-invoicing infrastructure will eventually be in place in Canada, enabling the implementation of prefilled GST/HST. The analysis evaluates the expected compliance cost savings for businesses by size. It also evaluates the budgetary implications for the tax administrations, including the CRA and Revenu Québec (RQ), as well as the federal and provincial-territorial governments of Canada. The goal is to provide an evidence-based foundation for considering the policy and economic viability of automated tax return systems in Canada.
2. Overview of consumption taxes in Canada (2025)
Canada levies consumption taxes at two levels of government – federal and provincial/territorial – resulting in a layered system that varies across jurisdictions. This box provides a concise overview of who levies what, on what basis, at what rate and who collects it.
2.1. Federal tax: Goods and Services Tax (GST)
The federal government applies a 5 % GST on most goods and services nationwide. The GST is a VAT: businesses collect it at each stage of production and distribution, remit it to the tax administration and claim input tax credits (ITCs) to recover GST paid on business inputs. The final tax burden falls on consumers.
Businesses with annual taxable revenues below CAD $30,000 are exempt from registration under the “small supplier” threshold.
In all the provinces and territories except the Province of Québec, the CRA collects the GST. In Québec, RQ collects both the GST and the Québec sales tax (QST) and remits the GST revenues to the Federal Government.
3. Provincial/territorial consumption-tax arrangements (2025)
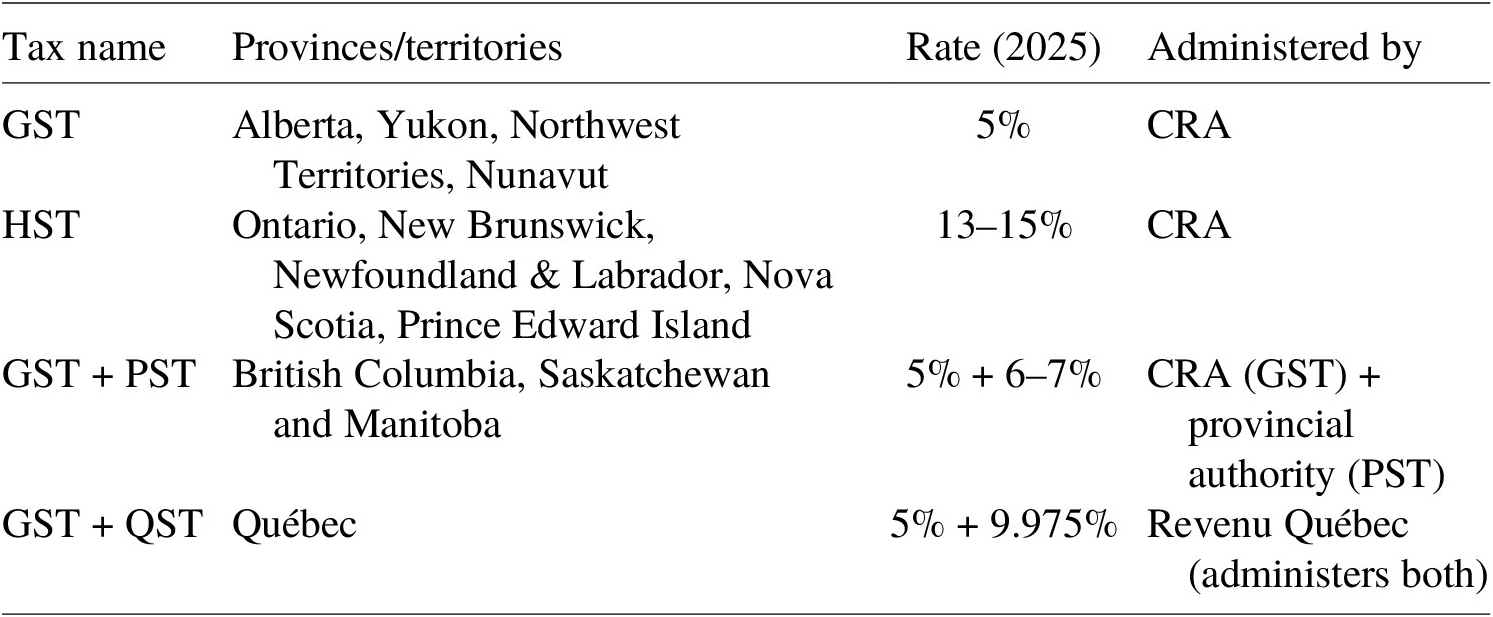
Table 1 summarizes the four distinct consumption-tax arrangements that operate across Canadian provinces and territories in 2025. Although Canada has a federal VAT – the GST – provinces and territories retain autonomy over whether to harmonize with the federal system or maintain their own sales taxes. This results in a multi-layered structure that differs substantially across jurisdictions.
Provincial/territorial consumption-tax arrangements in Canada (2025)

Table 1. Long description
The table is organized into four columns: Tax name, Provinces/territories, Rate (2025), and Administered by.
* Row 1: G S T. Applies to Alberta, Yukon, Northwest Territories, and Nunavut. The rate is 5 percent. Administered by the C R A.
* Row 2: H S T. Applies to Ontario, New Brunswick, Newfoundland and Labrador, Nova Scotia, and Prince Edward Island. The rate is 13 to 15 percent. Administered by the C R A.
* Row 3: G S T plus P S T. Applies to British Columbia, Saskatchewan, and Manitoba. The rate is 5 percent plus 6 to 7 percent. Administered by the C R A for G S T and provincial authorities for P S T.
* Row 4: G S T plus Q S T. Applies to Québec. The rate is 5 percent plus 9.975 percent. Administered by Revenu Québec, which manages both taxes.
The first group of jurisdictions, Alberta, Yukon, the Northwest Territories and Nunavut, levies no provincial sales tax (PST), applying only the federal 5 % GST. In these regions, the CRA is the sole tax administrator.
A second group of provinces, including Ontario, New Brunswick, Nova Scotia and Newfoundland and Labrador, has adopted the HST, which combines the federal GST with a provincial component into a single, fully harmonized VAT. The CRA administers the entire tax, and businesses file one return. HST rates range from 13 to 15 %, with Nova Scotia reducing its rate to 14 % in 2025. For this group of Provinces, the Federal Government remits the provincial share of the revenues to the provinces.
A third group, British Columbia, Saskatchewan and Manitoba, levies a separate PST alongside the federal GST. The PST is a retail sales tax, not a VAT, and therefore applies only at the final point of sale. Because PST is not recoverable through input tax credits, in some cases it represents a direct cost on business inputs. Each province administers its own PST independently of the CRA.
Finally, Québec operates a dual VAT system consisting of the federal GST and the QST. The QST is structured as a VAT and is closely aligned with the GST in structure and base.
This paper has three main contributions. First, it provides a literature review of Canada’s current e-invoicing and GST/HST reporting landscape, setting the stage for assessing prefilling initiatives. Second, it presents a benefit–cost analysis to evaluate potential savings from compliance and the administrative costs associated with implementing a prefilling model. Third, it estimates the additional revenue that the governments of Canada will receive due to the increase in the income tax base brought about by lower compliance costs. These contributions aim to inform future tax policy reforms and highlight practical, data-driven insights based on international experience, specifically tailored to Canada’s fiscal landscape.
4. Literature review
Research on VAT/GST compliance and administrative costs indicates that Canada’s burdens are substantial and broadly comparable with those in other advanced economies. However, direct quantitative cross-country comparisons remain limited. Historically, in Canada, GST compliance costs were estimated at USD 9.6 billion in 1991 (Cléroux, Reference Cléroux1992). However, as this was the first year of the implementation of the GST, the business compliance costs might be unusually high. More recent Canada-wide figures for all taxes place total compliance costs in 2011 at USD 19.2–24.8 billion, with administrative (government) costs around USD 6.6 billion (Ariganello et al., Reference Ariganello, Vaillancourt, Roy-César and Barros2013). Studies consistently find a regressive pattern, with small businesses bearing higher proportional burdens (Evans et al., Reference Evans, Hansford, Hasseldine, Lignier, Smulders and Vaillancourt2014; Bain et al., Reference Bain, Walpole, Hansford and Evans2015; Smulders & Evans, Reference Smulders and Evans2017). International evidence suggests that this pattern is not unique to Canada; in some jurisdictions, compliance costs have been documented at above 5 % of VAT revenue and at 1.50–1.55 times the total tax administration budget (Berhan & Jenkins, Reference Berhan and Jenkins2005). Qualitative comparisons likewise indicate that Canada’s experience tracks that of other developed countries, with one cross-country study describing “remarkably similar outcomes” across Canada, Australia, South Africa and the United Kingdom (Evans et al., Reference Evans, Hansford, Hasseldine, Lignier, Smulders and Vaillancourt2014). However, the literature highlights gaps in direct quantitative international comparisons, limiting precise ranking of Canada’s VAT/GST compliance and administrative-cost efficiency relative to its peers (Highfield et al., Reference Highfield, Evans, Tran-Nam and Walpole2019; Zu et al., Reference Zu, Evans and Krever2020).
To reduce the tax burden on businesses, the modernization of tax administration through digital tools has drawn growing interest from scholars, international organizations and tax authorities (TAs). The literature frequently highlights the potential of e-invoicing, real-time (or near-real-time) data reporting and prefilled returns to enhance tax collection efficiency, reduce opportunities for fraud and strengthen taxpayer compliance (Bellon et al., Reference Bellon, Dabla-Norris, Khalid and Lima2022; Kotsogiannis et al., Reference Kotsogiannis, Salvadori, Karangwa and Murasi2025).
One useful analogy is that of a credit card billing system in which all transactions are automatically recorded and posted, and the cardholder receives a ready-made statement summarizing activity, eliminating much manual reconciliation. In a digitally enabled tax regime, invoice data (or third-party transaction data) could be streamed to the TA to generate draft returns for taxpayer review rather than forcing businesses to compile everything manually. This kind of automation promises more accurate reporting, a lower administrative burden and a shift from reactive enforcement toward proactive taxpayer support. However, actual implementations will vary in their degree of real-time integration, audit oversight and system maturity (Martínez-Vázquez et al., Reference Martínez-Vázquez, Sanz-Arcega and Tránchez-Martín2022; OECD, 2025).
Countries such as Italy, Chile and Estonia provide instructive examples of how digitalization can transform VAT administration through e-invoicing and prefilled return systems. In Italy, the Exchange System (In Italian: Sistema di Interscambio or SdI) serves as the central platform for validating and exchanging all electronic invoices between businesses and the TA, enabling data-driven monitoring and forming the basis for partially prefilled VAT returns for eligible businesses (European Commission, 2019; Agenzia delle Entrate, 2022; Mazereel & Hermans, Reference Mazereel and Hermans2025). Systematic evidence on fraud reduction is still emerging. However, the Italian experience shows that automation can reduce administrative effort and enhance audit traceability. Italy’s adoption of mandatory e-invoicing through the SdI in 2019 has produced measurable compliance gains. Using cross-border trade data, Heinemann and Stiller (Reference Heinemann and Stiller2025) estimate that the reform reduced cross-border VAT fraud by EUR 2.2 billion to EUR 2.6 billion between 2018 and 2019, aligning with Italian government revenue estimates of similar magnitude.
These outcomes are supported by assessments from the European Commission and OECD, which highlight how Italy’s digital reporting infrastructure facilitates prefilled VAT returns and enhances administrative efficiency, particularly for SMEs (European Commission, 2020a, 2020b; OECD, 2025). Although anecdotal reports suggest that automation has shortened filing times for small businesses, systematic evidence on compliance cost reductions remains limited.
In Chile, the Servicio de Impuestos Internos (SII) mandates the issuance and clearance of Documentos Tributarios Electrónicos (DTEs) for most taxpayers. Firms must submit invoices electronically to the SII for validation before delivery, enabling near-real-time transaction monitoring (Jenkins et al., Reference Jenkins, Hesami, Alshamleh, Yarygina and Pessino2023). This system enhances VAT compliance and supports the automation of VAT reporting through prefilled monthly returns (Formulario 29) based on DTE data (Servicio de Impuestos Internos (SII), 2025; OECD, 2022a). Estonia, often cited for its advanced digital infrastructure, integrates business, accounting and tax data through interoperable national systems, allowing most businesses to submit returns rapidly with minimal manual input (Kalvet, Reference Kalvet2012; OECD, 2022c).
Across these cases, the literature identifies cost reduction as a central benefit of tax digitalization achieved through automation, streamlined data flows and the reduction of intermediaries (OECD, 2025). The same logic underpins proposed GST/HST prefilling initiatives in Canada, where automating return preparation could substantially reduce compliance costs and enhance reporting accuracy.
4.1. Digital transformation and public finance
Digitalization has recently emerged as a central driver of public sector reform, prompting governments worldwide to modernize service delivery, data management and revenue collection. Growing public expectations for efficient, transparent and user-friendly governance have accelerated the adoption of digital technologies across the public sector (OECD, 2020a; World Bank, 2022). Within this context, tax administrations are increasingly embracing digital transformation to streamline administrative processes, enhance compliance and strengthen trust between businesses and authorities (OECD, 2022a).
A central pillar of this transformation is the digitalization of tax systems, which reduces manual data handling, lowers administrative costs and improves taxpayer services through automation and analytics (Martínez-Vázquez et al., Reference Martínez-Vázquez, Sanz-Arcega and Tránchez-Martín2022; OECD, 2025). Among the most significant innovations is the development of systems for prefilling of tax returns, including prefilled GST/HST declarations, which leverage real-time transaction data to simplify compliance obligations for businesses of all sizes and enhance overall filing accuracy (Rocha, Reference Rocha2022; OECD, 2022b).
The OECD (2020b, 2020c) underscores that digital transformation in tax administration is not merely a technical upgrade but a strategic shift that redefines the relationship between the taxpayer and the state. Digital tools can reduce administrative burdens, increase accuracy in reporting and promote voluntary compliance. Similarly, the United Nations Conference on Trade and Development (UNCTAD) (, 2020) emphasizes the importance of integrating digital tax systems into a comprehensive digital economy strategy. Bellon et al. (Reference Bellon, Dabla-Norris, Khalid and Lima2022) find that after the mandatory adoption of e-invoicing, firms in Peru significantly increased their reported VAT liabilities, suggesting that digitalization reduces compliance costs and improves reporting.
Automation and the integration of digital records have transformed the analytical and enforcement capacities of modern tax administrations. Empirical and comparative research demonstrates that digital infrastructures enable risk-based auditing, reduce manual reporting errors and improve the allocation of enforcement resources (Martínez-Vázquez et al., Reference Martínez-Vázquez, Sanz-Arcega and Tránchez-Martín2022; Okunogbe & Santoro, Reference Okunogbe and Santoro2023; OECD, 2025). When supported by robust legal frameworks and interoperable information systems, automation facilitates the use of predictive analytics and real-time compliance monitoring, enabling TAs to shift from reactive enforcement to proactive, data-driven compliance management (Gupta et al., Reference Gupta, Keen, Shah and Verdier2017; Nose & Mengistu, Reference Nose and Mengistu2023).
However, the degree to which automation can be realized is shaped by institutional and legal complexity. The intricate nature of the US tax code and data-sharing rules poses significant obstacles to the adoption of prefilled returns (Guenther, Reference Guenther2022), illustrating that even technologically advanced jurisdictions face barriers to full automation when statutory and administrative systems remain fragmented.
For prefilled sales tax-type returns to become more beneficial in the United States, several structural changes would be required: greater harmonization of state sales-tax rules, standardized digital reporting of transactions, and more consistent data sharing between states and the federal government. These changes would create the administrative conditions necessary for a prefilled system similar to those used in VAT jurisdictions (Friedman & Lindholm, Reference Friedman and Lindholm2021; Council On State Taxation & STRI, 2024).
4.2. The role of e-invoicing in tax compliance
Among the most transformative instruments of tax digitalization is e-invoicing. E-invoicing systems enable the real-time exchange of structured transactional data between businesses and TAs, forming the technological foundation for more efficient, accurate and transparent tax administration (Caluwaerts, Reference Caluwaerts2010; Bellon et al., Reference Bellon, Dabla-Norris, Khalid and Lima2022; OECD, 2022b; Akagi, Reference Akagi2024). When embedded within broader digital tax infrastructures, e-invoicing automates the purchase-to-pay cycle, enhances auditability and reduces compliance burdens by minimizing manual data entry and reconciliation (IMF, 2023).
Empirical evidence from OECD and IMF studies demonstrates that digital reporting and e-invoicing reforms not only improve VAT compliance and revenue collection but also enable the automatic generation of prefilled returns for VAT or GST/HST systems (Bellon et al., Reference Bellon, Dabla-Norris, Khalid and Lima2022; OECD, 2025). Furthermore, e-invoice data contribute to the development of the real-time economy, allowing governments to monitor transactions as they occur, strengthen anti-fraud mechanisms and improve the timeliness and granularity of national accounts (Akagi, Reference Akagi2024). Collectively, these benefits position e-invoicing as a cornerstone of modern, data-driven tax administration that advances both administrative efficiency and fiscal transparency.
Empirical evidence increasingly supports the fiscal benefits of mandatory e-invoicing. In Latin America, Bellon et al. (Reference Bellon, Dabla-Norris, Khalid and Lima2022) conducted a quasi-experimental study in Peru showing that the introduction of mandatory VAT e-invoicing increased reported sales, purchases and VAT liabilities by roughly 5 % in the first year, mainly by improving transaction-level data accuracy and reducing under-reporting. Their findings indicate that e-invoicing, when combined with nationwide digital integration, can meaningfully narrow the VAT compliance gap.
4.3. Prefilled returns: Efficiency and equity
The OECD (2022a) documents multiple country experiences with prefilled tax return systems, noting that they reduce administrative burdens, minimize manual data entry and lower error rates for both businesses and tax administrations. In its Towards Seamless Taxation report, the OECD (2022b) further highlights that automated data sharing and prefilling capabilities enable businesses to spend less time on routine reporting while improving data accuracy and compliance outcomes.
A leading example is Estonia, where the national E-Tax platform pre-fills individual income tax returns using data automatically transmitted by employers, banks and government databases. According to the European Commission (2019), most businesses can review and submit their prefilled income tax returns in under five minutes, reflecting Estonia’s high degree of digital integration. Although these figures refer to personal income tax, not VAT, they demonstrate the efficiency gains possible when real-time data interoperability is achieved across systems.
International evidence shows that digital tax administration, especially e-invoicing and prefilling, reduces routine workload and errors and can shift effort away from audits toward risk-based controls (IMF, 2023; OECD, 2022b). In contrast, the European Commission’s (2022) assessment of SME tax compliance costs finds that in jurisdictions without such integration, VAT obligations remain a major source of administrative burden across EU member states, underscoring the potential of prefilled and real-time reporting systems to simplify compliance. For example, in jurisdictions without integrated real-time VAT data, the post-filing VAT refund stage alone can require substantial time – an average of 18.2 hours to prepare and submit a refund claim and weeks to obtain the refund – highlighting the administrative drag where automation is limited (World Bank & PwC, 2019).
In Canada, public documentation and comparative OECD reporting indicate that the GST/HST system still relies on periodic (non-real-time) reporting, which constrains the CRA’s ability to offer automated or prefilled GST/HST returns (Rocha, Reference Rocha2022; OECD, 2022a). Recent CRA-commissioned research on GST/HST filing focuses on behaviors and process pain points rather than direct compliance costs. However, it reinforces that frictions persist and that simplification/digitalization are active priorities for the CRA (Canada Revenue Agency, 2024a). Together, these sources support the policy case that implementing real-time data collection and prefilled GST/HST returns would reduce the compliance burden for Canadian businesses, particularly SMEs (OECD, 2022a; IMF, 2023; Rocha, Reference Rocha2022).
The Government of Canada (2025) has highlighted that public organizations continue to rely on outdated digital infrastructure, which can hinder integration and innovation in services. Meanwhile, OECD comparative reports (2020c, 2022a) show that, unlike leading jurisdictions such as Italy and Estonia, the CRA does not currently integrate real-time transactional invoice data into GST/HST reporting systems. This limits the CRA’s ability to offer automated or prefilled tax return services, placing higher compliance burdens on businesses – especially SMEs.
4.4. Objective of the study: Cost–benefit analysis of prefilled GST/HST returns
This study conducts a cost–benefit analysis of implementing prefilled GST/HST returns in Canada. Given the cost savings available to businesses from electronic invoicing, it is expected that in the near future, there will be a successful establishment of comprehensive business e-invoicing nationwide. By analyzing the impacts of prefilled returns on businesses of various sizes – non-employee, small, medium and large – this study seeks to quantify the benefits of reducing compliance costs for businesses and improving tax efficiency for the CRA.
For SMEs, prefilled GST/HST returns offer significant benefits. SMEs face the highest compliance costs relative to their sales or GST/HST revenues collected due to their limited resources for handling complex tax filing requirements (Vaillancourt et al., Reference Vaillancourt, Palacios and Clemens2007; Clemens, Reference Clemens2008; Vaillancourt & Barros, Reference Vaillancourt and Barros2011). Laurin and Dahir (Reference Laurin and Dahir2022) discuss the challenges of implementing automatic tax filing in Canada, emphasizing the complexity of the tax system.
Prefilled returns could reduce the administrative burden by automating data entry and alleviating the psychological costs imposed on small business owners associated with tax audits (Choi & Kleiman, Reference Choi and Kleiman2024). Eliminating these costs will allow businesses to focus more on their core operations rather than on tax compliance tasks.
Large businesses, while better equipped to complete their tax filings, would still benefit from increased efficiency and fewer errors in reporting. For the CRA, prefilled returns would not only streamline the tax filing process but also contribute to cost savings in processing and handling returns. These savings could be redirected toward more strategic functions (Canada Revenue Agency, 2024a).
Prefilled returns would likely increase compliance rates and reduce errors in tax filings, benefiting the overall economy (Statistics Canada, 2024). Furthermore, even if the GST/HST levels of taxpayer compliance do not change, reducing GST/HST compliance costs for businesses would lead to higher-income tax revenue for the CRA. As businesses allocate fewer resources to administrative tasks, their taxable income will increase, resulting in higher-income tax payments.
The digitalization of Canada’s tax system includes the adoption of electronic services and platforms to enhance the efficiency of tax administration. This transition aims to simplify interactions between businesses and the tax administrations in Canada, both the CRA and RQ, while aligning with global trends in tax modernization (OECD, 2022b). The CRA’s digital transformation initiatives underscore its commitment to modernizing tax administration in response to the demands of an increasingly digitalized economy (Canada Revenue Agency, 2024b).
5. Methodology
A benefit–cost analysis is designed to evaluate the potential benefits and cost savings associated with integrating an administratively prefilled GST/HST tax return system within a framework characterized by the widespread adoption of e-invoicing.
The evaluation is conducted over a period of 10 years. The period of the study, 10 years, was chosen to measure the economic loss that Canada would incur if the implementation of this system of tax administration were delayed 10 years. Given the potential net benefits of such a system, it is likely to be implemented at some point in the future. This study quantifies the loss to Canada if there is a decade-long delay in its implementation.
This analysis utilizes a cost–benefit analysis framework, examining the results from both financial and economic perspectives. These two perspectives differ in focus:
-
• The financial perspective of a benefit–cost analysis highlights the direct financial costs and benefits related to a specific project or intervention. It determines whether the initiative will produce a net financial gain or loss for the involved parties, which can include administrative agencies and private companies. This view considers key elements such as implementation costs, operating expenses and revenue, concentrating on how the intervention impacts net cash flow.
-
• The economic perspective adopts a broader approach by considering both the direct resource savings and costs associated with the intervention. This perspective evaluates the economic efficiency of the project through an analysis of its overall impact on resource allocation and societal economic welfare. Unlike financial benefits and costs, which reflect variations in cash flow, economic benefits and costs assess whether the intervention enhances or undermines societal welfare. Conducting an economic appraisal is essential to ensure that policy decisions prioritize the overall economic efficiency of tax mobilization rather than the financial interests of specific organizations.
This dual-perspective approach facilitates the quantification of the intervention’s influence on principal stakeholders within the economy. The primary stakeholders encompass the government and Canadian enterprises. From the government’s viewpoint, this includes the TA, which is concerned with implementation costs, and the National Treasury, which assesses broader fiscal implications, including administrative expenses and projected changes in tax revenue. It regards savings in administrative and compliance costs as economic benefits, while any increases in staffing, technology or infrastructure expenditures are deemed economic costs. The objective is to ascertain whether the initiative enhances or diminishes overall economic welfare. An increase in government revenue is regarded as a financial benefit to the government, but it is not an economic benefit. It is an income transfer from consumers/businesses to the government.
5.1. Stakeholder considerations
We evaluate the benefits for both businesses and the federal and provincial governments. The main stakeholders are as follows:
-
• Businesses can be categorized into four distinct types, each playing a vital role in the economy: large, medium, small and non-employee businesses.
-
• Tax administration for the GST/HST in Canada is primarily managed by the CRA, along with RQ. At the same time, the budgetary aspects of the government are the responsibility of the Department of Finance. This intervention will also impact the provincial government’s revenues. In the following analysis, the impacts are quantified for each government entity and combined to form the total budgetary impacts.
From this analysis, the impact on the stakeholders in the economy can be quantified.
These relationships are described in the following set of equations:
5.1.1. Businesses
Through the prefilling of the GST/HST tax returns, two components of compliance costs – data collection and preparation – will be eliminated. The proportion of compliance cost eliminated is denoted as
$ \beta $
 ; hence, the annual economic compliance cost savings (
$ {B}_t^{iB} $
 ) can be expressed as:

Here, i indexes business size categories, where i = 1 corresponds to non-employee businesses and i = 4 represents large businesses. The summation aggregates outcomes across all business sizes and
$ {CC}_t^i $
 is the corresponding annual GST/HST compliance cost prior to the introduction of prefilled returns.
The present value of benefits from compliance cost savings by each type of business over 10 years of prefilled tax implementation, discounted by the rate of r, is given in Equation (2).

The annual costs incurred by the business category to implement the prefilled tax are denoted by
$ {C}_t^i $
 . These costs may include items such as computer service costs (
$ {CSC}_t^i $
 ) and staff retraining costs (
$ {EC}_t^i $
 ). These annual costs are expressed by Equation (3):

The present value of the costs incurred by the businesses over 10 years to accommodate the prefilled tax system, denoted by
$ {PVC}_{t=0}^{iB} $
 , is described by Equation (4):

The present value of the net benefits after deducting implementation costs for each business category, before tax,
$ {NPVB}_{t=0}^{iB} $
 , is described by Equation (5):

The additional provincial income tax revenue (
$ {PVPR}^{ij} $
 ) is estimated for the increased taxable income resulting from compliance savings in each province and territory, denoted as j. This estimate covers a 10-year period after the implementation of the prefilled tax return. The values for the increase in provincial tax revenues are obtained by multiplying the present value of the net benefits by the applicable provincial income tax rate
$ {R}^{Pi} $
 for that business size, as described by Equation (6):

Here, j indexes provinces, with j = 1, …11 denoting each province in CanadaFootnote
1. The summations over j aggregate the results across provinces and territories. The additional federal income tax revenue (
$ {PVFR}^{ij} $
 ) arising from increased taxable income due to compliance savings over 10 years is obtained by multiplying the present value of the net benefits by the business type by the applicable federal income tax rate
$ R $
 Fi. This relationship is described by Equation (7):

The present value of total revenue (
$ {PVTR}^{ij}\Big) $
 is estimated from the summation of additional federal income tax revenue and additional provincial income tax revenue over 10 years of implementation of prefilled tax returns and described by Equation (8):

The net present value of financial net of tax benefits (
$ {NPVB}^{ij} $
 ) accruing to each business category is estimated by deducting the additional taxes (
$ {PVTR}^{ij} $
 ) that the businesses pay from the net benefits (
$ {NPVB}^{ijB} $
 ) of the decreased compliance cost due to prefilled tax returns over 10 years of implementation, as described in Equation (9):

The components of Equation (9) for each business category provide estimates of stakeholder impacts for each group. The value of
$ {NPVB}^{ij} $
 is the total stakeholder impact for businesses in Canada.
5.1.2. Tax administration
Financial costs incurred in year t,
$ {C}_t^{FTA} $
 , include initial costs,
$ {IC}_t^{FTA} $
 , and incremental operation costs,
$ {OC}_t^{FTA} $
 . In principle, the impact of this administrative innovation on operating costs could either increase or decrease the overall operating costs of tax administration. In undertaking this analysis, the assumption is made that there are no incremental tax administration cost savings from implementing a prefilled returns system. This is unlikely to be the case. However, this assumption introduces a downward bias in our estimate of total economic benefits to the Canadian economy.
The initial cost includes the personnel cost of the change management team,
$ {PC}_t^{TA} $
 , and training cost,
$ {TC}_t^{TA} $
 . The incremental operating cost includes the incremental computer services cost,
$ {CSC}_t^{TA} $
 , incremental software license and maintenance cost,
$ {SC}_t^{TA} $
 , and additional personnel cost,
$ {APC}_t^{TA} $
 . This equation is given as Equation (10):

The present value of the net cash flow of the tax administration over 10 years of prefilled tax implementation is described by Equation (11):

5.1.3. All governments
The additional revenues collected by federal and provincial governments are an externality for the government entity resulting from the implementation of prefilled tax returns. These benefits are itemized in Equation (8).
Net financial benefit for government entities occurs after deducting the present value of costs,
$ {PVC}^{TA} $
 , from the present value of total revenues they collected from businesses due to decreased compliance cost from prefilled tax return over 10 years of implementation, as described in Equation (12):

With this methodological framework, our focus now turns to its application in the Canadian context of prefilled GST/HST returns. As international experiences demonstrate, the digitalization of tax systems has become a defining feature of modern public administration, offering significant gains in efficiency, transparency and compliance. This application not only quantifies the potential benefits and costs but also provides policymakers with evidence on how delays in adoption could generate financial losses and place Canada behind other advanced jurisdictions in the global movement toward digital tax innovation.
5.2. Taxonomy of GST/HST tax filers in Canada
For the cost–benefit analysis, the first requirement is to have estimates of the number of businesses categorized by business size, namely, large, medium, small and micro enterprises. Canadian GST/HST tax filers are classified by the province or territory in which they file their return; however, no public information is available on the classification of GST/HST filers by their size.
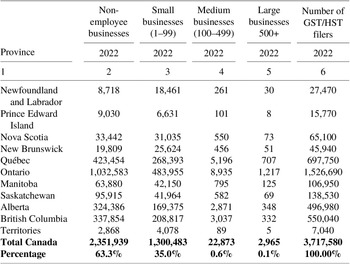
The number of GST/HST filers by provincial jurisdiction, as of the latest available version (2022), is obtained from the CRA’s GST/HST Statistics Report, Table 2 (Canada Revenue Agency, 2024c). This information is presented in Table 2, column 6. In 2022, there were 3,717,580 GST/HST tax filers in the whole of Canada. It included 39,320 filers from outside Canada.
Distribution of GST/HST businesses in Canada in 2022 by size classification

Table 2. Long description
The table is organized into seven columns: Province, Non-employee businesses, Small businesses (1 to 99 employees), Medium businesses (100 to 499 employees), Large businesses (500 plus employees), and the total Number of G S T or H S T filers. All data is for the year 2022.
* Newfoundland and Labrador: 8,718 non-employee; 18,461 small; 261 medium; 30 large; 27,470 total.
* Prince Edward Island: 9,030 non-employee; 6,631 small; 101 medium; 8 large; 15,770 total.
* Nova Scotia: 33,442 non-employee; 31,035 small; 550 medium; 73 large; 65,100 total.
* New Brunswick: 19,809 non-employee; 25,624 small; 456 medium; 51 large; 45,940 total.
* Québec: 423,454 non-employee; 268,393 small; 5,196 medium; 707 large; 697,750 total.
* Ontario: 1,032,583 non-employee; 483,955 small; 8,935 medium; 1,217 large; 1,526,690 total.
* Manitoba: 63,880 non-employee; 42,150 small; 795 medium; 125 large; 106,950 total.
* Saskatchewan: 95,915 non-employee; 41,964 small; 582 medium; 69 large; 138,530 total.
* Alberta: 324,386 non-employee; 169,375 small; 2,871 medium; 348 large; 496,980 total.
* British Columbia: 337,854 non-employee; 208,817 small; 3,037 medium; 332 large; 550,040 total.
* Territories: 2,868 non-employee; 4,078 small; 89 medium; 5 large; 7,040 total.
* Total Canada: 2,351,939 non-employee; 1,300,483 small; 22,873 medium; 2,965 large; 3,717,580 total.
* Percentage of Total: 63.3 percent non-employee; 35.0 percent small; 0.6 percent medium; 0.1 percent large; 100.00 percent total.
The distribution of the number of GST/HST businesses among the large, medium and small categories with employees is based on the categories from Statistics Canada’s, 2022 reports, which show the number of businesses with employees in June 2022 (Statistics Canada, 2022), as shown in Table 2, columns 3, 4 and 5.
To estimate the number of non-employee businesses (self-employed) GST/HST tax filers, the total number of businesses in 2022 that have employees in each province and territory (small, medium and large), as reported in Statistics Canada (2022), is subtracted from the total number of GST/HST filers in each jurisdiction for that year. The assumption is that all businesses with employees must also be GST/HST tax filers. The number of non-employee businesses for 2022 is reported in Table 2, column 2. The categories are defined by the number of employees, as mentioned above. Large businesses are those with more than 500 employees, while medium-sized businesses are those with 100 to 499 employees. Small businesses are those with 1 to 99 employees.
The striking result from these estimations is that 99 % of all GST/HST tax filers fall into the small (35 %) and non-employee (64 %) categories. Due to the low threshold of CAD 30,000 for requiring a self-employed individual to register for GST/HST, the result is that over time, more than 63 % of GST/HST tax filers are one-person businesses. Except for the provinces of Newfoundland and Labrador, New Brunswick, Nova Scotia and Prince Edward Island, the number of non-employee tax filers is much larger than that of those classified as small businesses. This can be attributed to the industrial structure in these provinces. The large (0.1 %) and medium (0.6 %) businesses, while responsible for collecting a significant proportion of the GST/HST revenues, represent a small fraction of the entities required to file GST/HST returns.
The distribution of GST/HST taxpayer businesses in Canada is very similar to that of Chile, where 98 % of all VAT taxpayers are either small or micro businesses (Jenkins et al., Reference Jenkins, Hesami, Alshamleh, Yarygina and Pessino2023). The reason small businesses account for such a large proportion of VAT filers in Chile is due to the absence of any turnover threshold for registering as a VAT taxpayer. As soon as a business is formed and starts to sell taxable items, it must register as a VAT taxpayer even if its total turnover is close to zero.
5.3. Compliance cost of GST/HST tax filers in Canada
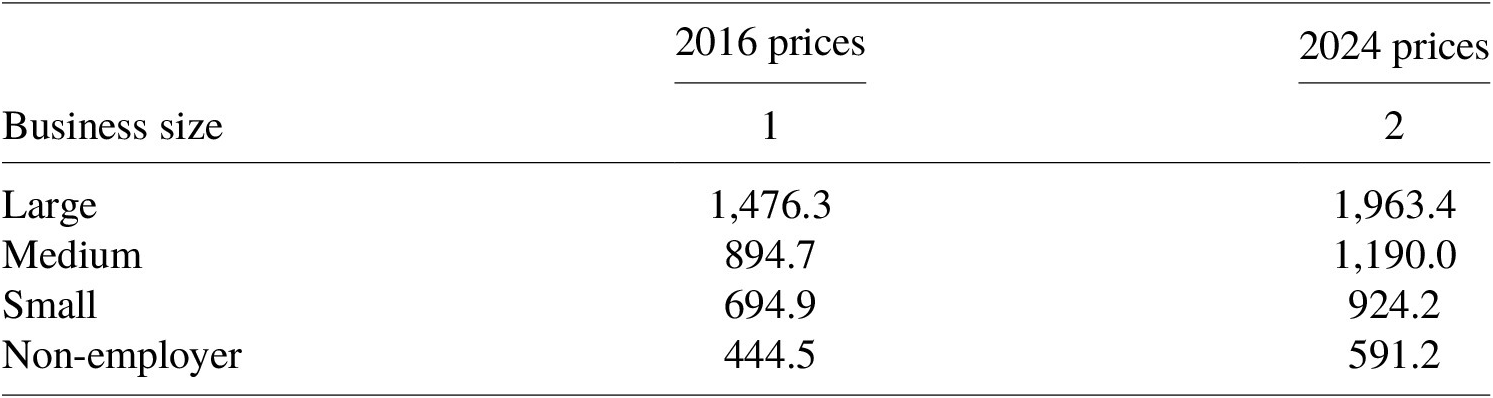
The second key variable in conducting a cost–benefit analysis of a system of prefilling GST/HST returns is an estimate of the current compliance costs that businesses incur under the laws governing the collection of these taxes. It is fortunate that in 2016, Statistics Canada conducted a survey to estimate the average GST/HST compliance costs incurred by businesses of various sizes in Canada. (The data from the 2016 Statistics Canada Survey has been provided through communication between the authors and Statistics Canada.) With a Statistics Canada survey, one can have confidence that the estimates are likely to be unbiased. The 2016 estimates for non-employee, small- and medium-sized businesses are published, but no estimates of the compliance costs are provided for large businesses. To estimate the compliance costs for large businesses, we compare our data with European data. According to European data, large businesses’ compliance costs were approximately 65 %Footnote 2 higher than those of medium-sized businesses. We use the same proportion to estimate the compliance costs of Canadian large businesses. These costs, by type of business, are expressed in 2016 Canadian dollars and presented in Table 3, column 1. To reflect the 2024 value, these costs are then adjusted for the cumulative inflation plus the cumulative growth in real wages in Canada. The increase in real wages was 6.4 % over the period between 2016 and 2024 (Statistics Canada, 2025). The values are reported in Table 3, column 2. The estimated compliance costs for large businesses are the highest, averaging CAD 1,963.40, followed by medium-sized businesses at CAD 1,190, small businesses at CAD 924.20 and non-employer businesses at CAD 591.20.
GST/HST compliance costs per business in Canada, by enterprise size (CAD)

Table 3. Long description
The table consists of three columns: Business size, 2016 prices, and 2024 prices. The data is organized into four rows by business size.
* Large: 1,476.3 in 2016 prices and 1,963.4 in 2024 prices.
* Medium: 894.7 in 2016 prices and 1,190.0 in 2024 prices.
* Small: 694.9 in 2016 prices and 924.2 in 2024 prices.
* Non-employer: 444.5 in 2016 prices and 591.2 in 2024 prices.
All values are in C A D. The 2024 prices show a consistent increase across all business sizes compared to 2016.
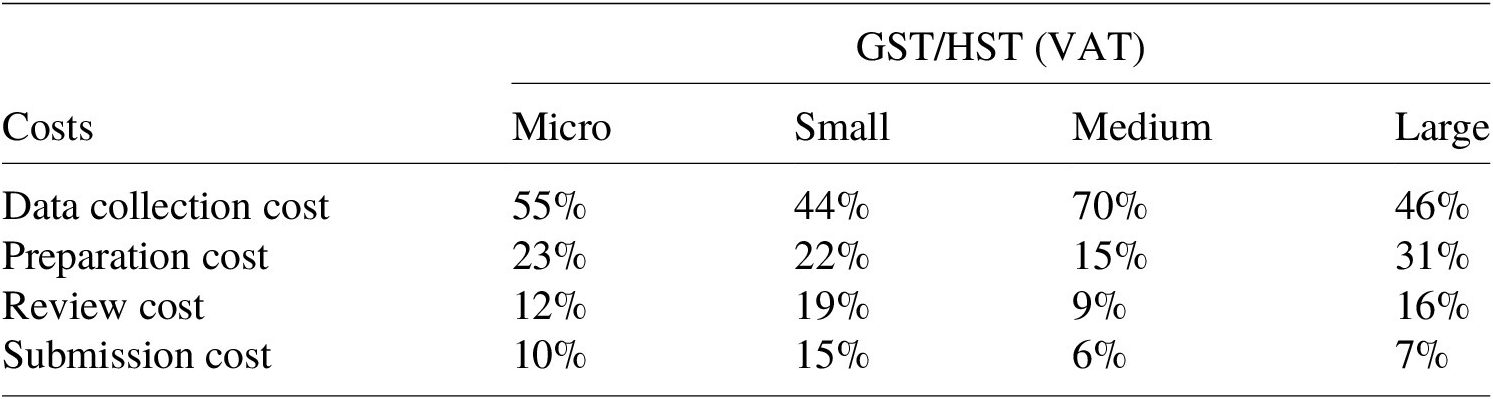
The compliance costs that businesses incur to meet the filing requirements of the GST/HST laws can be categorized into four main types: data collection, preparation of the return, review of the return prior to submission and the cost of submitting the return. If the government were to instead prefill the tax returns, at least the costs of data collection and return preparation would be removed. The EU survey of the costs incurred by businesses to comply with VAT prefilling tax returns (European Commission, 2018) indicates that approximately 77 % of these costs are generated by data collection and form preparation (see Table 4).
Breakdown of total tax compliance costs for GST/HST (VAT) by task and by the size of the enterprise (European Commission, 2018)

Table 4. Long description
The table is organized with four columns representing enterprise sizes: Micro, Small, Medium, and Large. The rows represent four types of costs.
* Data collection cost: 55 percent for Micro, 44 percent for Small, 70 percent for Medium, and 46 percent for Large.
* Preparation cost: 23 percent for Micro, 22 percent for Small, 15 percent for Medium, and 31 percent for Large.
* Review cost: 12 percent for Micro, 19 percent for Small, 9 percent for Medium, and 16 percent for Large.
* Submission cost: 10 percent for Micro, 15 percent for Small, 6 percent for Medium, and 7 percent for Large.
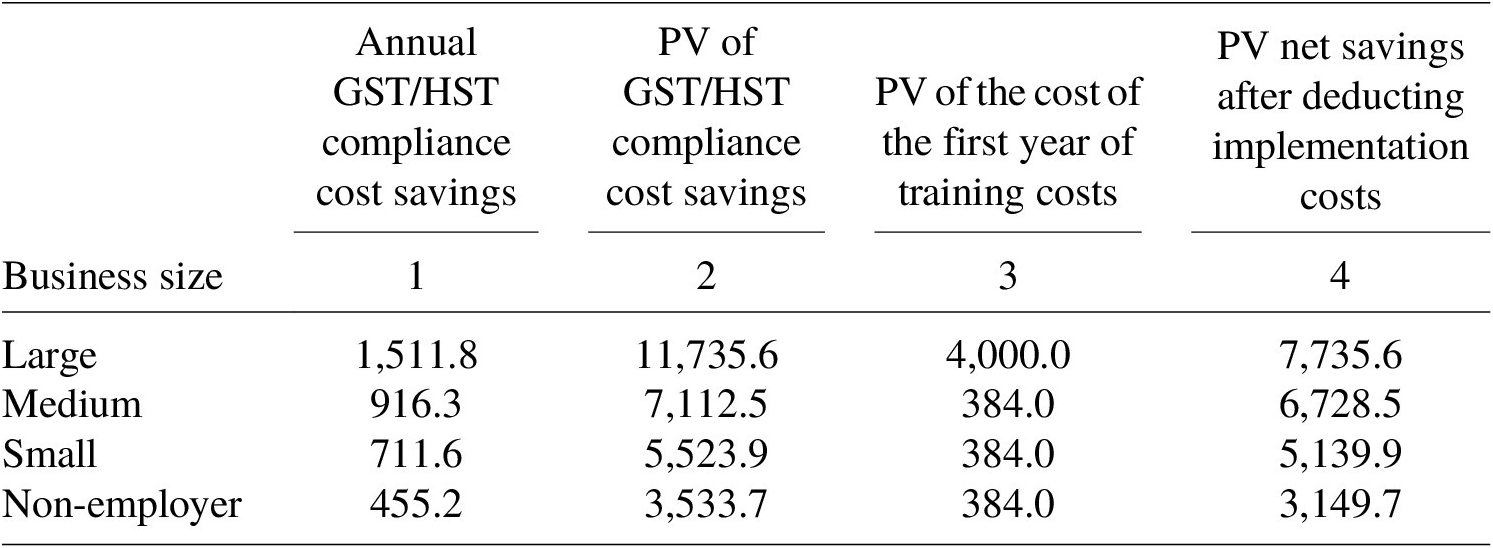
The 77 % reduction in business compliance costs results in annual savings of CAD 1,511.80 for large businesses, CAD 916.30 for medium-sized businesses, CAD 711.60 for small businesses and CAD 455.20 for non-employee businesses (self-employed individuals). These values, estimated using Equation (1), are reported in Table 5, column 1.
Cost savings from prefilled GST/HST implementation in Canada: Annual and 10-year PV (CAD per Business, 2024 Prices)

Table 5. Long description
The table contains five columns and five rows of data. The columns are labeled: Business size, Annual G S T or H S T compliance cost savings, P V of G S T or H S T compliance cost savings, P V of the cost of the first year of training costs, and P V net savings after deducting implementation costs. All values are in C A D.
* Large businesses: Annual savings of 1,511.8. P V savings of 11,735.6. Training costs of 4,000.0. Net savings of 7,735.6.
* Medium businesses: Annual savings of 916.3. P V savings of 7,112.5. Training costs of 384.0. Net savings of 6,728.5.
* Small businesses: Annual savings of 711.6. P V savings of 5,523.9. Training costs of 384.0. Net savings of 5,139.9.
* Non-employer businesses: Annual savings of 455.2. P V savings of 3,533.7. Training costs of 384.0. Net savings of 3,149.7.
The annual compliance cost reductions are projected for 10 years. The average hourly wages are increased by 1.064 % over time (Statistics Canada, 2025), to reflect the rise in real wages of accountants, bookkeepers and the primary skill groups employed to complete GST/HST returns. The present value of these savings is presented in Table 5, column 2. They are calculated using Equation (2) and employing a real discount rate of 7 %. This is the discount rate recommended for use in calculating NPVs for such regulatory or administrative interventions (Treasury Board Secretariat, 2007).
To implement prefilled returns, business personnel will require additional training costs in the first year. We estimate that large businesses will require 40 training hours at a cost of CAD 100 per hour. For medium, small and non-employee businesses, they are expected to engage in 8 hours of training each at a cost of CAD 48.00 per hour. For these items, we assume that the financial and economic costs of the training activities are equal. In other words, there are no significant tax or subsidy distortions in the evaluation of these costs. We also assume that these businesses will incur no additional software or computer costs to adapt their systems to electronic invoicing, enabling them to provide GST/HST collection data to the government. In Chile and some EU countries, such as Italy, the government has provided a free app for VAT filers to ensure compatibility between electronic invoicing and the government’s information requirements for prefilling VAT returns. The present value of the implementation cost per taxpayer by business type is reported in Table 5, column 3.
Using Equation (5), the present values of the net benefits of compliance cost savings over 10 years to businesses, by size, are estimated and reported in Table 5, column 4. For large businesses, the savings amount to CAD 7,735.60; for medium, small and non-employer businesses, the savings are CAD 6,728.50, CAD 5,139.90 and CAD 3,091.60, respectively. These net savings in business compliance costs form the basis for estimating both the financial and economic benefits of implementing a prefilled returns system for GST/HST.
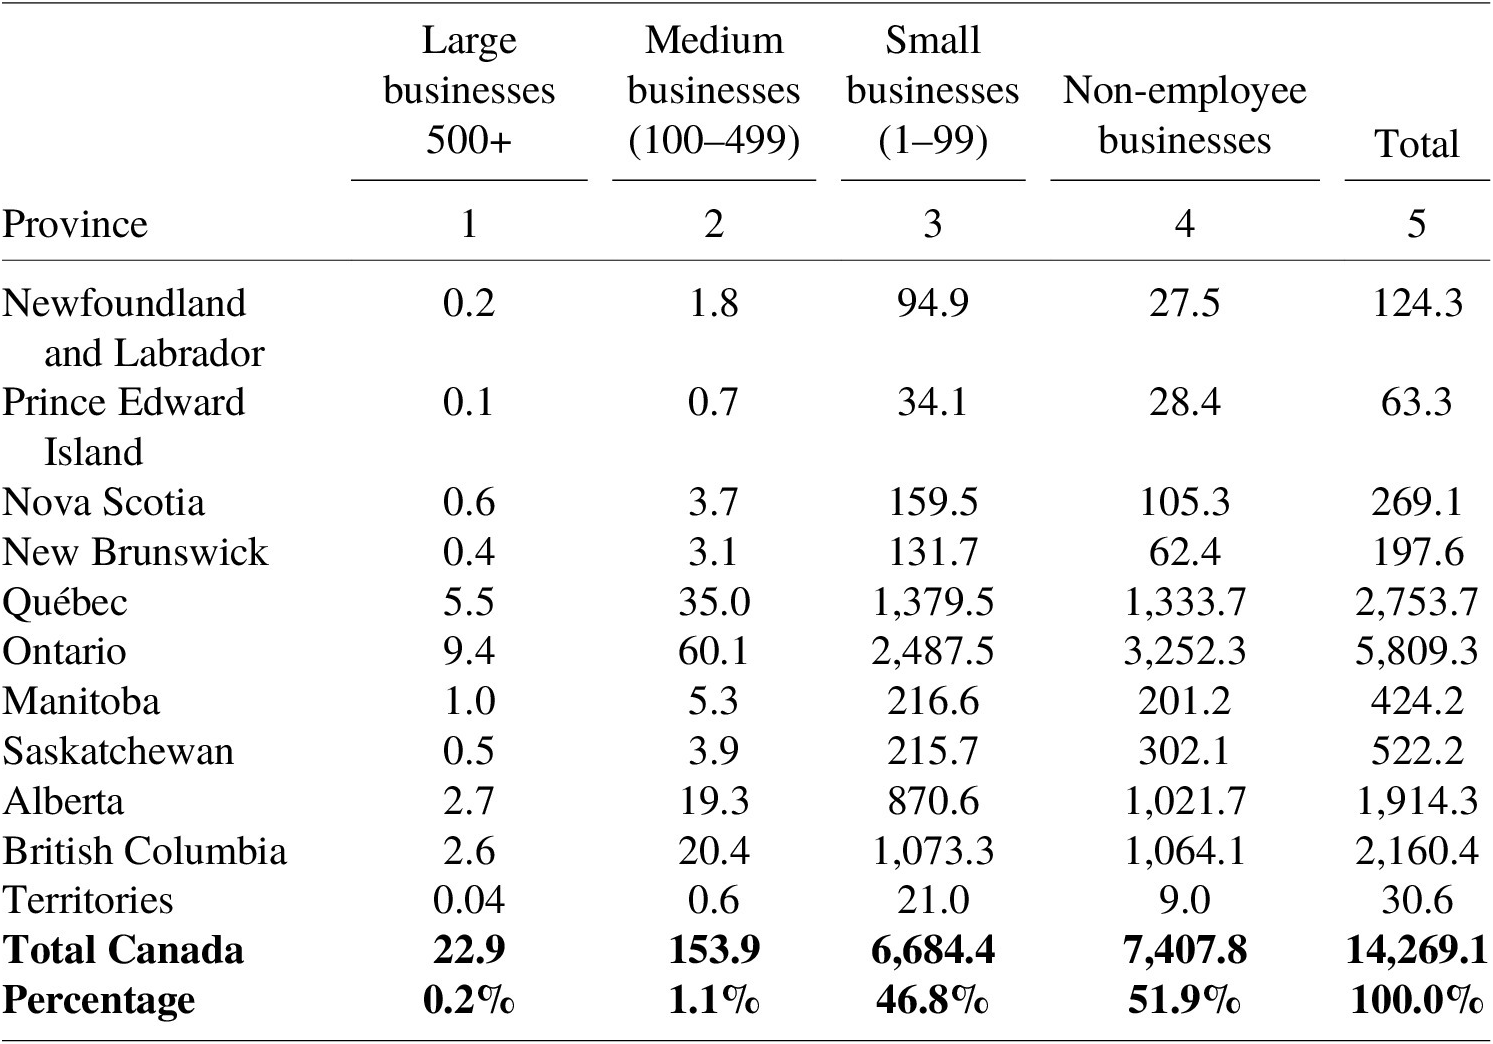
To derive the present value of the net savings to all businesses in Canada over 10 years and distributed across the provinces, the annual savings are multiplied by the annual number of businesses in each category, as reported in Table 2. When making projections of cost savings, the initial survey for the number of businesses is adjusted by 1 % per year to reflect the growth in the number of businesses over time (ISED, 2026). In Table 6, the present values for the economic benefits to the country and the before-tax financial benefits to businesses that accrue over 10 years are reported for Canada, as well as by each province and territory. These values are presented in Table 6, column 5. They are also reported by business size and by jurisdiction in columns 1, 2, 3 and 4.
Present value of net compliance cost savings before taxes for all businesses in Canada over 10 years, by province (CAD million) 2024 prices

Table 6. Long description
The table contains 13 rows of data across 6 columns. The columns are: Province, Large businesses 500 plus, Medium businesses 100 to 499, Small businesses 1 to 99, Non-employee businesses, and Total.
* Newfoundland and Labrador: 0.2, 1.8, 94.9, 27.5, Total 124.3.
* Prince Edward Island: 0.1, 0.7, 34.1, 28.4, Total 63.3.
* Nova Scotia: 0.6, 3.7, 159.5, 105.3, Total 269.1.
* New Brunswick: 0.4, 3.1, 131.7, 62.4, Total 197.6.
* Québec: 5.5, 35.0, 1,379.5, 1,333.7, Total 2,753.7.
* Ontario: 9.4, 60.1, 2,487.5, 3,252.3, Total 5,809.3.
* Manitoba: 1.0, 5.3, 216.6, 201.2, Total 424.2.
* Saskatchewan: 0.5, 3.9, 215.7, 302.1, Total 522.2.
* Alberta: 2.7, 19.3, 870.6, 1,021.7, Total 1,914.3.
* British Columbia: 2.6, 20.4, 1,073.3, 1,064.1, Total 2,160.4.
* Territories: 0.04, 0.6, 21.0, 9.0, Total 30.6.
* Total Canada: 22.9, 153.9, 6,684.4, 7,407.8, Total 14,269.1.
* Percentage: 0.2 percent, 1.1 percent, 46.8 percent, 51.9 percent, Total 100.0 percent.
The financial present value of the total benefits is estimated to be about CAD 14.3 billion, with 98.7 % of the benefits being created by the reduction in compliance costs of small and non-employee businesses. Of the total benefits, Ontario would receive the largest share, at 41 % of the total, followed by Québec at 19 %, British Columbia at 15 % and Alberta at 13 %. The business communities in these four provinces would gain 88 % of the Canada-wide gains from this intervention.
Due to the reduction in compliance costs, the reported expenses of doing business by these firms should decrease, and hence the amount of taxable income should increase by the same amount. It follows that, as expressed by Equations (6) and (7), there will be an increase in income taxes paid by these businesses equal to their respective tax rates multiplied by the change in the amount of taxable income. To estimate the additional provincial and federal tax revenues, one needs to select a set of representative tax rates that would be applied to taxable income earned by firms, based on the size and tax jurisdiction of the business.
For large and medium businesses, the federal and provincial corporate income tax rates are applied to the change in taxable income. No further increased tax payments are estimated for the shareholder level, although some additional tax may be paid if increased dividend distributions occur. In Canada, the income earned by small and non-employee businesses is integrated for tax purposes with the income of the shareholders. Therefore, instead of applying the very low small business tax rates, the first level of the individual income tax is applied. These tax rates by tax jurisdiction and firm size are presented in the Appendix, Table A1.
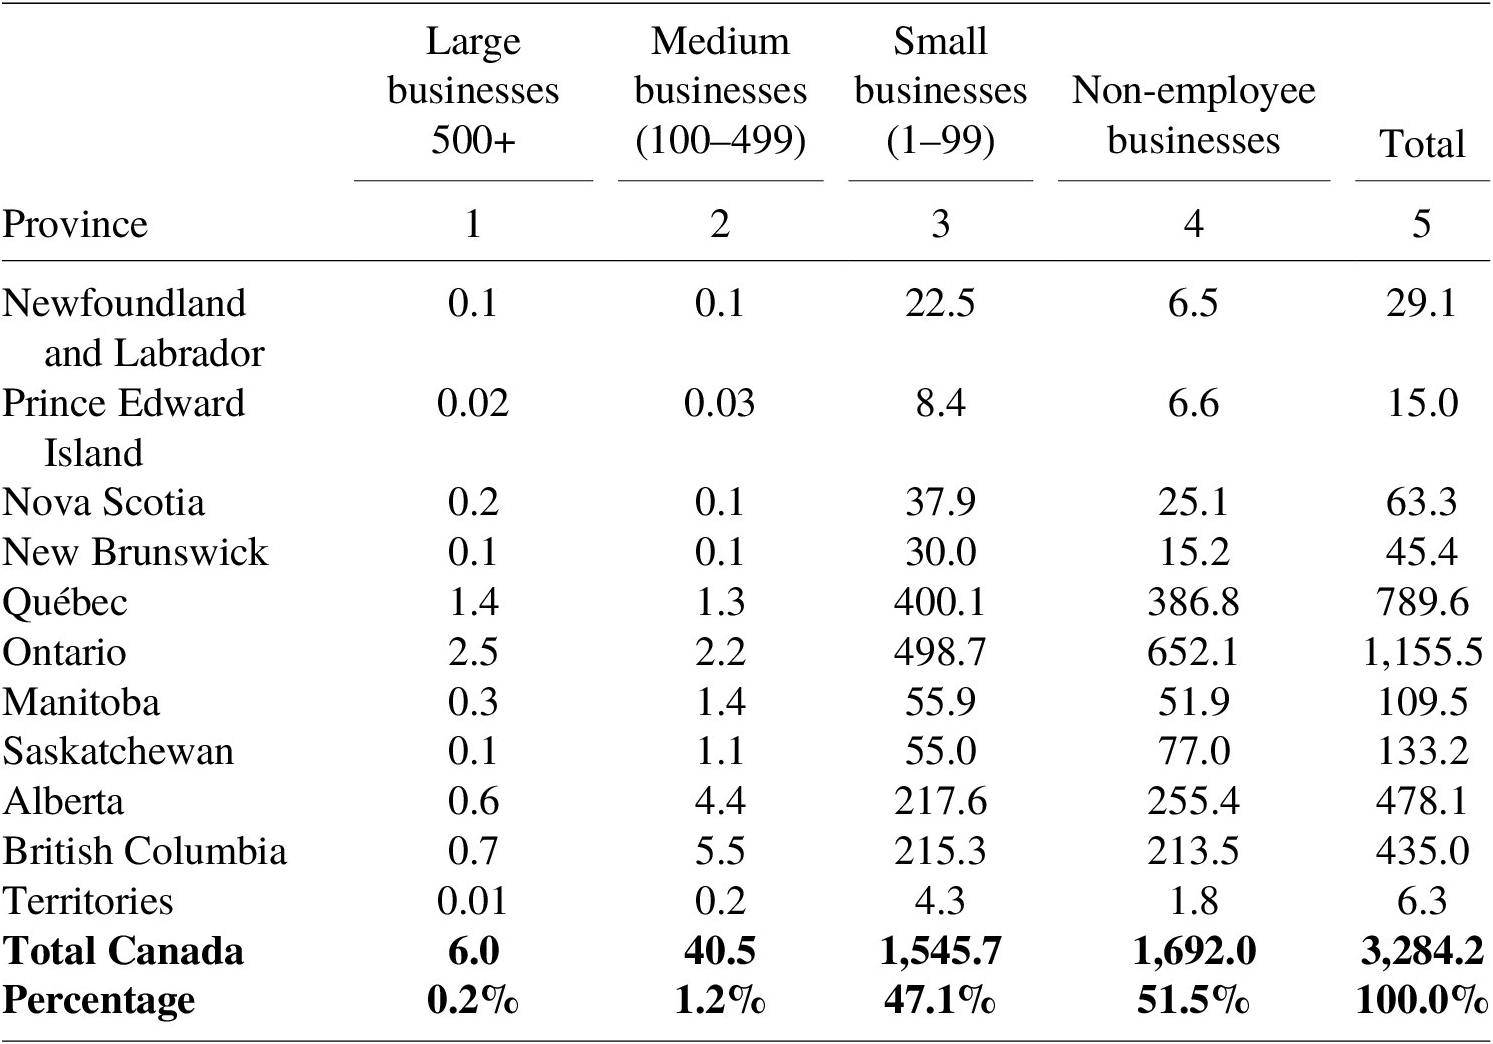
By applying these income tax rates to the amount of compliance cost savings reported in Table 6, a set of estimates is derived using Equation (8) for the increase in tax revenues paid by these businesses to both the federal and provincial/territorial governments in Canada. The estimates of the total present values of the increased revenues for the period 2025–2035 by province and the Federal Government are reported in Table 7, column 5. The present value of the total increase in income tax revenues is estimated to be CAD 3.3 billion, with 98.6 % of the amount being paid by small and non-employee businesses, who would be the main beneficiaries of this intervention.
Present value of additional provincial and federal revenues from increased taxable income over 10 years of prefilled GST/HST return implementation (CAD million), 2024 prices

Table 7. Long description
The table consists of 6 columns and 14 rows. The columns are: Province, Large businesses 500 plus, Medium businesses 100 to 499, Small businesses 1 to 99, Non-employee businesses, and Total. All values are in C A D millions at 2024 prices.
* Newfoundland and Labrador: 0.1, 0.1, 22.5, 6.5, Total 29.1.
* Prince Edward Island: 0.02, 0.03, 8.4, 6.6, Total 15.0.
* Nova Scotia: 0.2, 0.1, 37.9, 25.1, Total 63.3.
* New Brunswick: 0.1, 0.1, 30.0, 15.2, Total 45.4.
* Québec: 1.4, 1.3, 400.1, 386.8, Total 789.6.
* Ontario: 2.5, 2.2, 498.7, 652.1, Total 1,155.5.
* Manitoba: 0.3, 1.4, 55.9, 51.9, Total 109.5.
* Saskatchewan: 0.1, 1.1, 55.0, 77.0, Total 133.2.
* Alberta: 0.6, 4.4, 217.6, 255.4, Total 478.1.
* British Columbia: 0.7, 5.5, 215.3, 213.5, Total 435.0.
* Territories: 0.01, 0.2, 4.3, 1.8, Total 6.3.
* Total Canada: 6.0, 40.5, 1,545.7, 1,692.0, Grand Total 3,284.2.
* Percentage: Large 0.2 percent, Medium 1.2 percent, Small 47.1 percent, Non-employee 51.5 percent, Total 100.0 percent.
With the results of the net economic benefits to businesses reported in Table 6 and the increase in income tax payments reported in Table 7, the net financial impact on businesses in Canada can be estimated (see Equation (9)). These estimates are presented in Table 8, both by firm size and by political jurisdiction. The present value of the immediate financial gain, net of income taxes, for businesses in Canada is estimated to be CAD 11 billion over the next 10 years (Table 8, column 5). Of this amount, 98.8 % of the net financial benefits would be received by the small and non-employee establishments.
Present value of net compliance cost savings after taxes for all businesses in Canada over 10 years, by province (CAD million), 2014 prices

Table 8. Long description
The table is organized into six columns: Province, Large businesses (500 plus), Medium businesses (100 to 499), Small businesses (1 to 99), Non-employee businesses, and Total. Values are in C A D millions at 2014 prices.
* Newfoundland and Labrador: Large 0.2, Medium 1.7, Small 72.4, Non-employee 21.0, Total 95.2.
* Prince Edward Island: Large 0.04, Medium 0.7, Small 25.7, Non-employee 21.8, Total 48.2.
* Nova Scotia: Large 0.4, Medium 3.6, Small 121.6, Non-employee 80.3, Total 205.8.
* New Brunswick: Large 0.3, Medium 2.9, Small 101.7, Non-employee 47.2, Total 152.1.
* Québec: Large 4.0, Medium 33.7, Small 979.5, Non-employee 947.0, Total 1,964.1.
* Ontario: Large 6.9, Medium 57.9, Small 1,988.8, Non-employee 2,600.2, Total 4,653.8.
* Manitoba: Large 0.7, Medium 3.9, Small 160.8, Non-employee 149.3, Total 314.7.
* Saskatchewan: Large 0.4, Medium 2.9, Small 160.7, Non-employee 225.1, Total 389.0.
* Alberta: Large 2.1, Medium 14.9, Small 652.9, Non-employee 766.3, Total 1,436.2.
* British Columbia: Large 1.9, Medium 14.9, Small 858.0, Non-employee 850.7, Total 1,725.5.
* Territories: Large 0.03, Medium 0.4, Small 16.7, Non-employee 7.2, Total 24.3.
* Total Canada: Large 16.9, Medium 113.4, Small 5,138.7, Non-employee 5,715.9, Total 10,984.9.
* Percentage of Total: Large 0.2 percent, Medium 1.0 percent, Small 46.8 percent, Non-employee 52.0 percent, Total 100.0 percent.
In summary, the methodological framework and empirical analysis presented in this section highlight the potential compliance savings for Canadian GST/HST filers. By applying a cost–benefit methodology, the analysis quantifies how prefilled returns could reduce reporting burdens and improve accuracy, demonstrating the tangible benefits of this administrative innovation. While the focus here is on the potential benefits to the private sector, these findings provide an essential foundation for evaluating the broader institutional and operational implications. The following section, therefore, shifts attention to the cost implications for the CRA/RQ as well as the economic benefits to the country.
5.4. Estimation of financial and economic benefits and costs to the public sector
So far, our analysis has focused on the impact of this intervention on private GST/HST filers. However, it is anticipated that this major administrative innovation will impose some costs, at least in the short term, on both CRA and RQ. RQ administers both the GST for the Federal Government and the QST for the provincial government.
Because the Federal Government compensates the Province of Québec for the administration costs of collecting the GST in Québec for the Federal Government, we do not try to break down the impact of this reform on the administration costs and benefits originating from the CRA and RQ. The estimated costs presented below reflect the combined impact on administration costs, including for both Québec and the rest of Canada.
Given the comprehensive information base that the tax administration would have through prefilling returns, it is expected that prefilling returns would also lead to tax administration efficiencies in the collection and auditing of the GST/HST. This has been the experience of Chile after implementing its system of prefilled tax returns. Over the period 2018–2022, the ratio of the cost of the tax administration to the amount of revenue collected has fallen (OECD, 2025b). However, in the appraisal of this intervention, the assumption is made that there are no long-term tax administration cost savings due to its implementation.
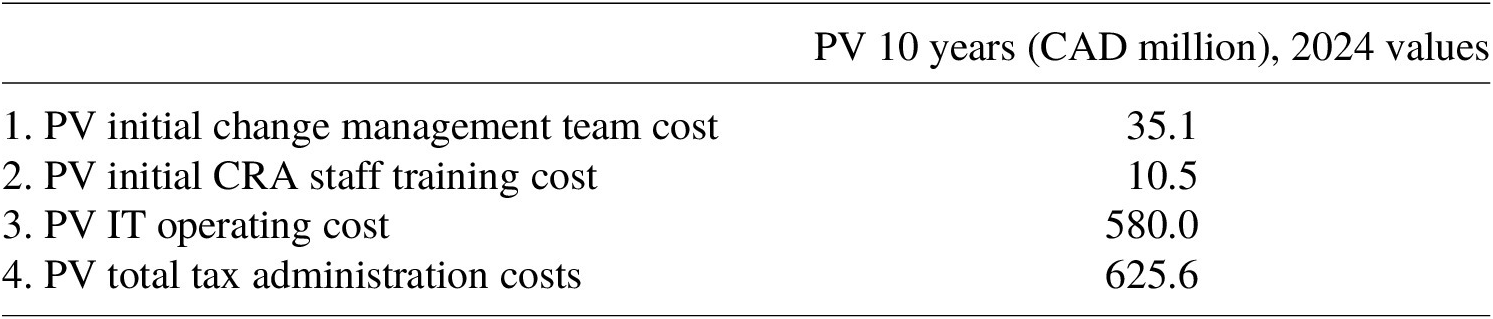
In this analysis, it is assumed that there will be some start-up costs for the first five years, consisting of the salaries of a change management team, which have a present value of CAD 35.1 million, and additional training costs for tax administration personnel, which would be CAD 10.5 million, as reported in Table 8, rows 1 and 2.
No public estimates exist for Canada on the financial and economic costs associated with the additional IT requirements of administrative prefilling of GST/HST returns. The potential set of costs that the CRA and RQ might incur to introduce this innovation is described by the components of Equation (10). In 2024, the total value of IT services obtained by the CRA from Shared Services Canada was estimated to be CAD 401.9 million (Canada Revenue Agency, 2024b, Table 8). In the case of Chile, from 2019 to 2024 the average level of IT expenditures (in real terms) increased over the base year of 2018 by approximately USD 13 million or CAD $17.41 million in 2024 prices (OECD, 2025b). When this increase is adjusted by the ratio of tax filers in Canada to the number of tax filers in Chile (3.7), the estimated additional annual IT costs for Canada would be approximately CAD 65 million. This amount represents approximately a 16 % increase in the entire IT budget for the CRA. Over the 10-year appraisal period, these costs are assumed to increase by 2 % each year in real terms. The present value of these IT costs over the appraisal period is estimated to be CAD 462 million. Additionally, the present value of the estimated additional human resources required over the 10-year period for the program’s operation is estimated to be CAD 118 million. The present value of the sum of these two operating cost items amounts to CAD 580 million, as reported in Table 9, row 3. With these assumptions, we arrive at a present value of the additional administration costs over the 10 years of CAD 625.6 million (see Table 9, row 4). We assume that the financial values of these public sector budgetary costs closely reflect their economic resource costs. No further adjustment is made.
Estimated financial and economic costs incurred by all tax administrations in Canada

Table 9. Long description
The table consists of two columns. The first column lists cost categories and the second column provides the P V 10 years in C A D million, 2024 values.
* Row 1. P V initial change management team cost: 35.1
* Row 2. P V initial C R A staff training cost: 10.5
* Row 3. P V I T operating cost: 580.0
* Row 4. P V total tax administration costs: 625.6
5.5. Economic outcomes of prefilled GST/HST returns
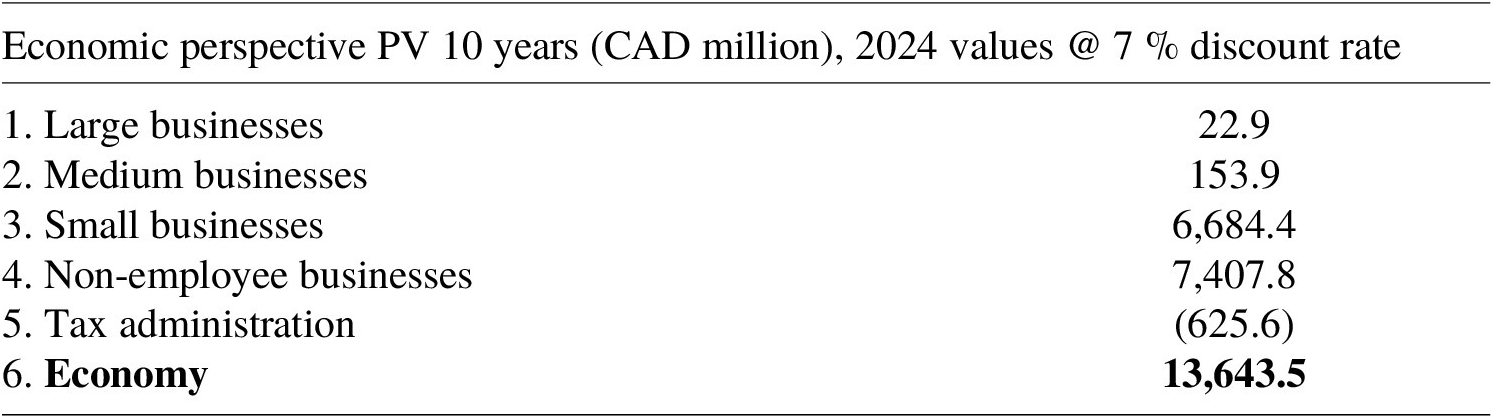
From the economy’s point of view, the benefits are the net resource cost savings by each of the business groups that are GST-/HST-registered taxpayers. These savings are calculated in Table 6 and reported in Table 10, rows 1–4. From the total of these amounts, one needs to subtract the estimated net resource costs incurred by the CRA and RQ to implement this system of prefilled returns (see Equation (12)). This value is estimated in Table 9 and reported again in Table 10, row 5. The estimated economic present value for the first 10 years after the implementation of this intervention is a positive CAD 13.6 billion net benefit to the economy (Table 10, row 6). This is an underestimate of the economic benefit to Canada from implementing prefilled GST/HST returns. It is assumed that the current costs of checking and submitting the return would remain the same as they are now. These components of compliance costs will also be reduced, but not eliminated, with the prefilling of the returns.
Economic perspective

Table 10. Long description
The table consists of two columns. The header spans both columns and reads Economic perspective P V 10 years C A D million, 2024 values at 7 percent discount rate. The rows are as follows.
* Row 1. Large businesses: 22.9.
* Row 2. Medium businesses: 153.9.
* Row 3. Small businesses: 6,684.4.
* Row 4. Non-employee businesses: 7,407.8.
* Row 5. Tax administration: negative 625.6.
* Row 6. Economy: 13,643.5.
6. Stakeholder analysis
The two main stakeholder groups affected by this intervention are businesses and the government. The government’s net financial position comprises several components. First, the additional income tax revenue generated in Canada due to the reduction in business costs is split between the provincial and territorial governments and the Federal Government. The distribution of revenue gained by each province and the Federal Government is reported in Table A2 in the Appendix.
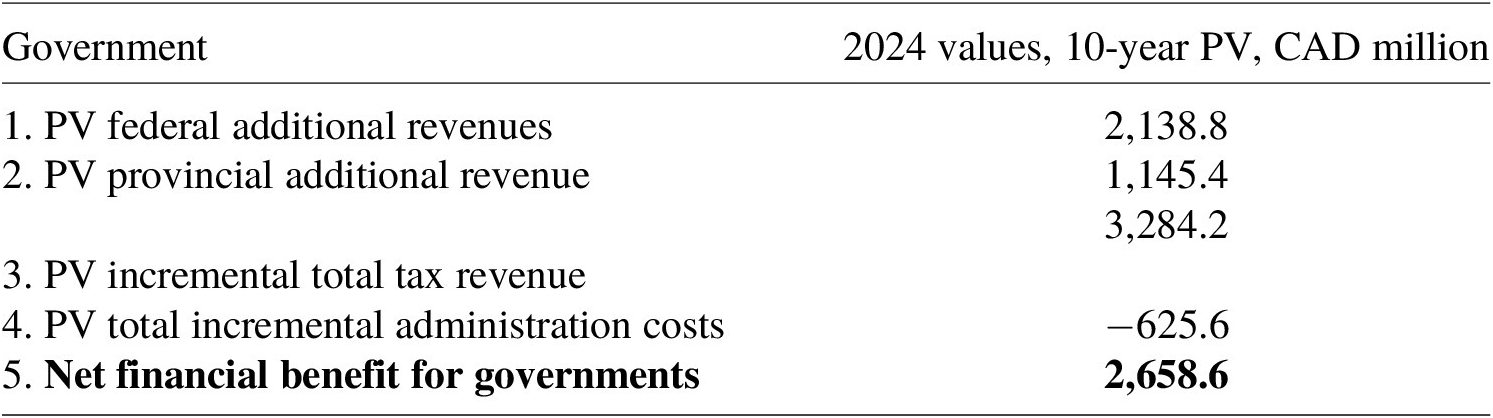
From the present value of the estimated increase in tax revenues of CAD 3,284.2 million, approximately one-third will accrue to the provincial and territorial governments and two-thirds will accrue to the Federal Government (Table 11, rows 1–3). After deducting the estimated additional costs incurred by the tax administration to implement this system, the net financial revenue gain by the governments of Canada is CAD 2.6586 billion (Table 11, row 5).
Government budgetary impact

Table 11. Long description
The table consists of two columns: Government and 2024 values, 10-year P V, C A D million.
* Row 1: 1. P V federal additional revenues is 2,138.8.
* Row 2: 2. P V provincial additional revenue is 1,145.4.
* Row 3: 3. P V incremental total tax revenue is 3,284.2.
* Row 4: 4. P V total incremental administration costs is minus 625.6.
* Row 5: 5. Net financial benefit for governments is 2,658.6.
The net economic benefit to Canada, as reported in Table 10, is approximately CAD 13.6 billion. The net financial benefit to GST/HST filers is CAD 11 billion, while the net financial revenue gain to the Canadian government is CAD 2.6 billion. This reconciliation is presented in Table 12, where the value of the economic benefits is equal to the distributed benefits received by the businesses and the governments of Canada.
Reconciliation

Table 12. Long description
The table consists of two columns. The first column is titled Reconciliation and the second column is titled 2024 values, 10-year P V, C A D million.
* Row 1: Economy – N P V has a value of 13,643.5.
* Row 2: Net financial benefits, business perspective (indicated with a bullet point) has a value of 10,984.9.
* Row 3: Total government budgetary impacts (indicated with a bullet point) has a value of 2,658.6.
7. Conclusions and implications for GST/HST tax policy
The implementation of prefilled GST/HST returns in Canada has the potential to reduce compliance costs and burdens for businesses while enhancing the overall administrative efficiency of the tax system. The cost–benefit analysis of prefilled GST/HST returns suggests that this initiative can reduce compliance costs for businesses by a substantial amount while also generating additional income tax revenues for both the provincial and federal levels of government. About 99 % of the cost reductions resulting from this administrative innovation would accrue to small and self-employed businesses in Canada.
These estimates are highly robust to any changes that are likely to arise in the major cost items required to implement a system of prefilled returns from either the perspective of the business tax filters or the government. The major cost item for the businesses is training their employees to interface with the new system of checking returns and submitting them. From Table 5, we find that depending on the size of the firm, the PV of the savings of compliance costs is between 2.9 and 18.5 times the estimated training costs for the new system. For most taxpayers, this ratio is more than 10.
Considering the IT costs of implementation, the present value of the estimated additional IT costs of 580 million, reported in Table 8, row 3, is only 4 % of the estimated net economic benefits to the economy from the implementation of the system of prefilled GST/HST/QST returns. Furthermore, the increased IT costs are only about 18 % of the increased income tax revenues that are expected to come about by the reduction in business operating expenses. Any change in these costs will not change the benefit–cost analysis’s recommendation to implement the system as quickly as possible.
The key driver of the results is the elimination of the data collection and return preparation costs that are central to the current “voluntary compliance” system of tax administration. At least 77 % of the business compliance costs now incurred to comply with the current system of tax collections will be eliminated by the introduction of prefilled GST/HST/QST returns.
In this analysis, certain potential benefits have been excluded, including any cost savings for the CRA and RQ and improvements in GST/HST/QST revenue compliance. These components, while significant from the government’s perspective, are excluded to focus on the direct financial and economic benefits to businesses and the broader economy. Even after excluding these government-side benefits, the results show substantial gains accruing to the Canadian economy, enhancing the cost competitiveness of Canadian businesses. The analysis estimates a net welfare gain of approximately CAD 13.6 billion over the 10 years, with most of the savings benefiting small and self-employed businesses. For these businesses, lower compliance costs translate into more time for growth, innovation and job creation.
The move toward electronic invoicing and the prefilling of GST/HST will also create incentives to harmonize further the tax bases of the GST and PSTs. The number of zero-rated consumption items and exemptions from the GST/HST tax base can be removed with little or no impact on income distribution. However, the economic efficiency of the Canadian economy will likely be improved. Evidence suggests that exemptions intended to support lower-income households often provide disproportionately larger benefits to higher-income households (Abshari et al., Reference Abshari, Jenkins, Kuo and Shahee2021). Furthermore, with the simplification of the VAT, overall tax compliance can be expected to increase (Agha & Haughton, Reference Agha and Haughton1996).
Federal leadership will be essential to advance these reforms. Federal regulations for the standardization of e-invoicing information, similar to practices already used by credit card providers, would facilitate a smooth transition. Moreover, the Federal Government’s policy of maintaining a low registration threshold for GST/HST ensures that the prefilled system can be implemented without needing to expand coverage to other business entities. Pilot projects led by the CRA, along with support for small businesses, will help to ensure a smooth and equitable transition.
To date, no Canadian study has evaluated the potential of prefilled GST/HST returns. This study addresses that gap by applying an integrated financial, economic and stakeholder cost–benefit analysis to the GST/HST system. Evidence from countries such as Chile, Italy and Estonia demonstrates that prefilled returns can ease compliance burdens while strengthening fairness and efficiency. This study provides the first evidence of how similar reforms could work in Canada, offering a clear path forward for modernizing tax administration.
In short, prefilled GST/HST returns represent an administrative innovation that benefits both businesses and governments. Prompt action is essential, as digital tools are readily available, and delays will result in unnecessary and unrecoverable costs. By adopting this reform, Canada can modernize its tax system, making it simpler, more automated and better suited to the realities of a modern, digital economy.
Acknowledgements
We greatly appreciate the comments and suggestions of François Vaillancourt, Siamand Hesami and Marcus Cruz at various stages of this research effort. Any errors and omissions that remain are the responsibility of the authors. Financial assistance for the completion of this study was provided through a Mitacs Accelerate Award.
Appendix
Corporate income tax rates by province and territory, 2024

Table A1. Long description
The table is organized into seven columns. The first column lists the Province or Territory. The next three columns fall under the header Large and medium businesses, subdivided into Federal, Provincial, and Total. The final three columns fall under Small and non-employee businesses, also subdivided into Federal, Provincial, and Total.
In all cases, the Federal tax rate is a constant 15 percent.
Data by row:
* Newfoundland and Labrador: Large Total 30 percent (Provincial 15 percent); Small Total 23.7 percent (Provincial 8.7 percent).
* Prince Edward Island: Large Total 31 percent (Provincial 16 percent); Small Total 24.5 percent (Provincial 9.5 percent).
* Nova Scotia: Large Total 29 percent (Provincial 14 percent); Small Total 23.8 percent (Provincial 8.8 percent).
* New Brunswick: Large Total 29 percent (Provincial 14 percent); Small Total 24.4 percent (Provincial 9.4 percent).
* Québec: Large Total 26.5 percent (Provincial 11.5 percent); Small Total 29.0 percent (Provincial 14 percent).
* Ontario: Large Total 26.5 percent (Provincial 11.5 percent); Small Total 20.1 percent (Provincial 5.1 percent).
* Manitoba: Large Total 27 percent (Provincial 12 percent); Small Total 25.8 percent (Provincial 10.8 percent).
* Saskatchewan: Large Total 27 percent (Provincial 12 percent); Small Total 25.5 percent (Provincial 10.5 percent).
* Alberta: Large Total 23 percent (Provincial 8 percent); Small Total 25.0 percent (Provincial 10 percent).
* British Columbia: Large Total 27 percent (Provincial 12 percent); Small Total 20.1 percent (Provincial 5.1 percent).
* Northwest Territories: Large Total 26.8 percent (Provincial 11.8 percent); Small Total 20.4 percent (Provincial 5.4 percent).
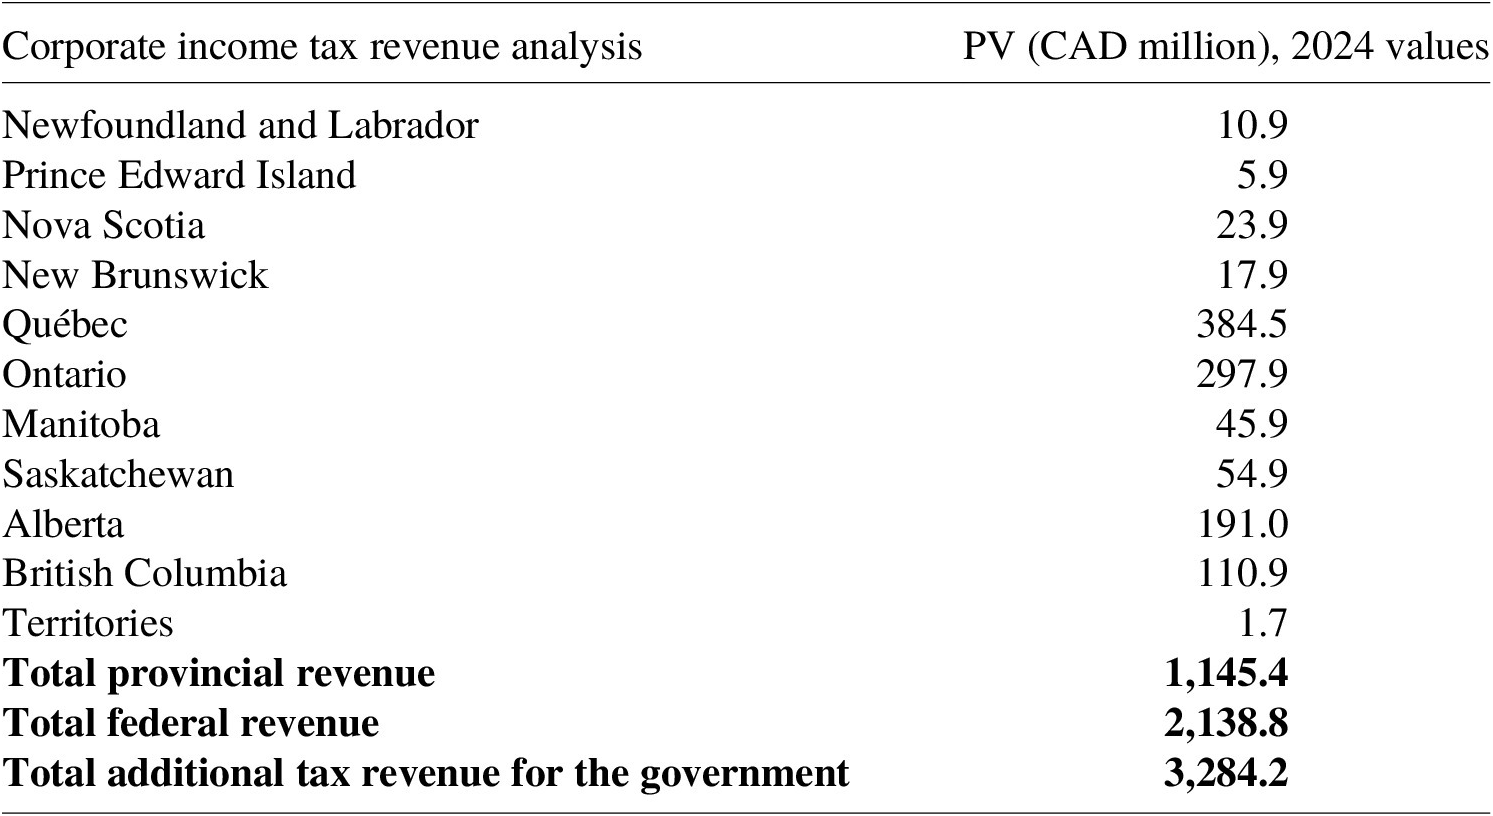
Additional corporate income tax revenue per province, 2024

Table A2. Long description
The table consists of two columns: Corporate income tax revenue analysis and P V in C A D million, 2024 values.
Individual provincial and territorial values are as follows:
* Newfoundland and Labrador: 10.9
* Prince Edward Island: 5.9
* Nova Scotia: 23.9
* New Brunswick: 17.9
* Québec: 384.5
* Ontario: 297.9
* Manitoba: 45.9
* Saskatchewan: 54.9
* Alberta: 191.0
* British Columbia: 110.9
* Territories: 1.7
The bottom of the table provides three summary totals:
* Total provincial revenue: 1,145.4
* Total federal revenue: 2,138.8
* Total additional tax revenue for the government: 3,284.2




 Open access

