


Introduction
Depression is one of the leading causes of disability worldwide (World Health Organisation, 2017). Its incidence is steadily rising on an annual basis with considerable personal costs to sufferers and economic costs to healthcare providers (McCrone et al., Reference McCrone, Dhanasiri, Patel, Knapp and Lawton-Smith2008). Major depressive disorder (MDD) has been characterized as a refractory condition, with high rates of relapse and recurrence. Approximately 50% of individuals who recovered from their first episode of depression will have one or more further episodes within their lifetime, and this rises to 80% for individuals who have a history of two or more prior episodes (American Psychiatric Association, 2000a). Relapse is typically defined as a reappearance of an illness, after symptoms have remitted, but before full recovery has occurred. In contrast, recurrence refers to a new episode of the illness after full recovery has occurred. A number of operational definitions of depression relapse and recurrence have been proposed by different authors (Möller et al., Reference Möller, Riedel and Seemüller2011). Some have defined recovery as the full remission of symptoms for a period of 4 months (Rush et al., Reference Rush, Kraemer, Sackeim, Fava, Trivedi, Frank, Ninan, Thase, Gelenberg, Kupfer and Regier2006), but others propose 6 months (Frank et al., Reference Frank, Prien, Jarrett, Keller, Kupfer, Lavori, Rush and Weissman1991) or even 12 months (Reimherr et al., Reference Reimherr, Amsterdam, Quitkin, Rosenbaum, Fava, Zajecka, Beasley, Michelson, Roback and Sundell1998). According to contemporary guidelines (Bockting et al., Reference Bockting, Hollon, Jarrett, Kuyken and Dobson2015), relapse is defined as the return of major depressive symptoms within 12 months after initial remission of symptoms to a sub-clinical level. Recurrence denotes the onset of a new episode of major depression, after a period of recovery (12 months of sustained remission of symptoms). In this paper, the authors will be referring to both definitions as RR (relapse and/or recurrence), as the evidence base focuses on both as predicted outcomes, using a variety of definitions of each and therefore preventing clear delineation.
Cognitive behavioural therapy (CBT) is an increasingly available and effective psychological intervention, recommended as a first-line treatment in clinical guidelines for the management of depression (American Psychiatric Association, 2000b; National Institute for Health and Care Excellence, 2010). Research suggests that CBT successfully treats the acute symptoms of depression, whilst costing less than pharmacotherapy or combined psychological and pharmacological treatment (Antonuccio et al., Reference Antonuccio, Thomas and Danton1997). Furthermore, CBT has a lasting effect in comparison with discontinued pharmacotherapy (Hollon et al., Reference Hollon, DeRubeis, Shelton, Amsterdam, Salomon, O’Reardon, Lovett, Young, Haman, Freeman and Gallop2005) and therefore it has been found to reduce the risk of short-term RR (Cuijpers et al., Reference Cuijpers, Berking, Andersson, Quigley, Kleiboer and Dobson2013a). However, some patients are prone to RR after CBT as described in a review by Paykel (Reference Paykel2007), where rates between studies ranged from 10 to 49%. This variability may be due to individual differences, or variability in the quality (e.g. competence and fidelity of treatment delivery) or intensity (e.g. duration) of treatment. Continuation-phase interventions have also been developed to maximize the long-term benefits of therapy; these are typically delivered once initial remission of symptoms is observed after the end of the acute-phase of treatment. Examples include continuation-phase CBT and mindfulness-based cognitive therapy (MBCT), which have been found to reduce the risk of RR (Beshai et al., Reference Beshai, Dobson, Bockting and Quigley2011; Cuijpers et al., Reference Cuijpers, Hollon, van Straten, Bockting, Berking and Andersson2013b). However, even with continuation-phase CBT or MBCT, at least 29% of cases experience a relapse within a year or so (Piet and Hougaard, Reference Piet and Hougaard2011; Scott et al., Reference Scott, Palmer, Paykel, Teasdale and Hayhurst2003). Therefore, it is clear that identifying individuals at higher risk of RR is an important challenge, as enduring depression symptoms may require further treatment and continue to incur personal, financial and societal costs.
There is a breadth of research suggesting that demographic and clinical variables are associated with depressive RR after treatments including pharmacotherapy, interpersonal psychotherapy, MBCT and CBT. These include biological factors (Lok et al., Reference Lok, Mocking, Ruhé, Visser, Koeter, Assies, Bockting, Olff and Schene2012, Reference Lok, Mocking, Ruhé, Visser, Koeter, Assies, Bockting, Olff and Schene2013), cognitive factors (Elgersma et al., Reference Elgersma, Glashouwer, Bockting, Penninx and de Jong2013), stress (Beshai et al., Reference Beshai, Dobson, Bockting and Quigley2011; Teasdale et al., Reference Teasdale, Segal, Williams, Ridgeway, Soulsby and Lau2000), family history of psychopathology (Burcusa and Iacono, Reference Burcusa and Iacono2007), and personality features (Alnaes and Torgersen, Reference Alnaes and Torgersen1997). It has been suggested that the most robust predictors of depressive RR are the number of prior episodes of depression, and the presence of residual depressive symptoms at the end of treatment (Burcusa and Iacono, Reference Burcusa and Iacono2007; Keller et al., Reference Keller, Lavori, Lewis and Klerman1983; Kessing et al., Reference Kessing, Hansen, Andersen and Angst2004; Mueller et al., Reference Mueller, Leon, Keller, Solomon, Endicott, Coryell, Warshaw and Maser1999). Previous reviews have synthesized evidence on predictors of RR after various treatments for depression (e.g. Bockting et al., Reference Bockting, Hollon, Jarrett, Kuyken and Dobson2015; Paykel, Reference Paykel2007), but no reviews to date have focused specifically on predictors of RR after CBT using systematic review or meta-analytic methods.
There are a number of reasons to focus on the CBT literature. First, as outlined above, CBT has more enduring effects compared with pharmacotherapy. It is therefore plausible that CBT works through different mechanisms, and may thus have specific moderators of long-term effects. Second, CBT is becoming increasingly available in many countries as a first-line treatment, which raises the need to understand how its durability can be maintained or enhanced. Third, there is now a critical mass of CBT-oriented research with longitudinal designs, and where treatments are well described and standardized, thus potentially enabling the identification of significant RR predictors. On this basis, we aimed to conduct a systematic review and meta-analysis. We focused on studies that examined predictors of RR in adult patients who completed acute-phase CBT for major depression, delivered without continuation-phase interventions.
Method
Study protocol
The systematic review protocol was registered and published in the International Prospective Register of Systematic Reviews (PROSPERO) ahead of conducting the review (protocol ID: PROSPERO 2017:CRD42017057747).
Eligibility criteria
Studies were included if they (1) had an adult (18+) sample of participants who were diagnosed with unipolar major depressive disorder using diagnostic interviews and/or validated depression case-finding measures, (2) analysed a sample that had completed a course of acute-phase CBT without continuation-phase interventions such as MBCT or continuation-CBT, (3) were published in peer-reviewed journals, (4) were written in the English language, (5) were part of a randomized controlled trial (RCT) or longitudinal cohort study, (6) included a follow-up period of at least 6 months, and (7) investigated one or more variables as a predictor of RR.
Search strategy
The search strategy was developed using best practice guidelines (Centre for Reviews and Dissemination, 2009). Four databases (Web of Science, PubMed, PsycINFO, Scopus) were searched for relevant articles published between January 1990 and March 2017, using variations of the key words ‘depression’, ‘cognitive behaviour therapy’, ‘relapse’ and ‘predict’.
Selection of articles
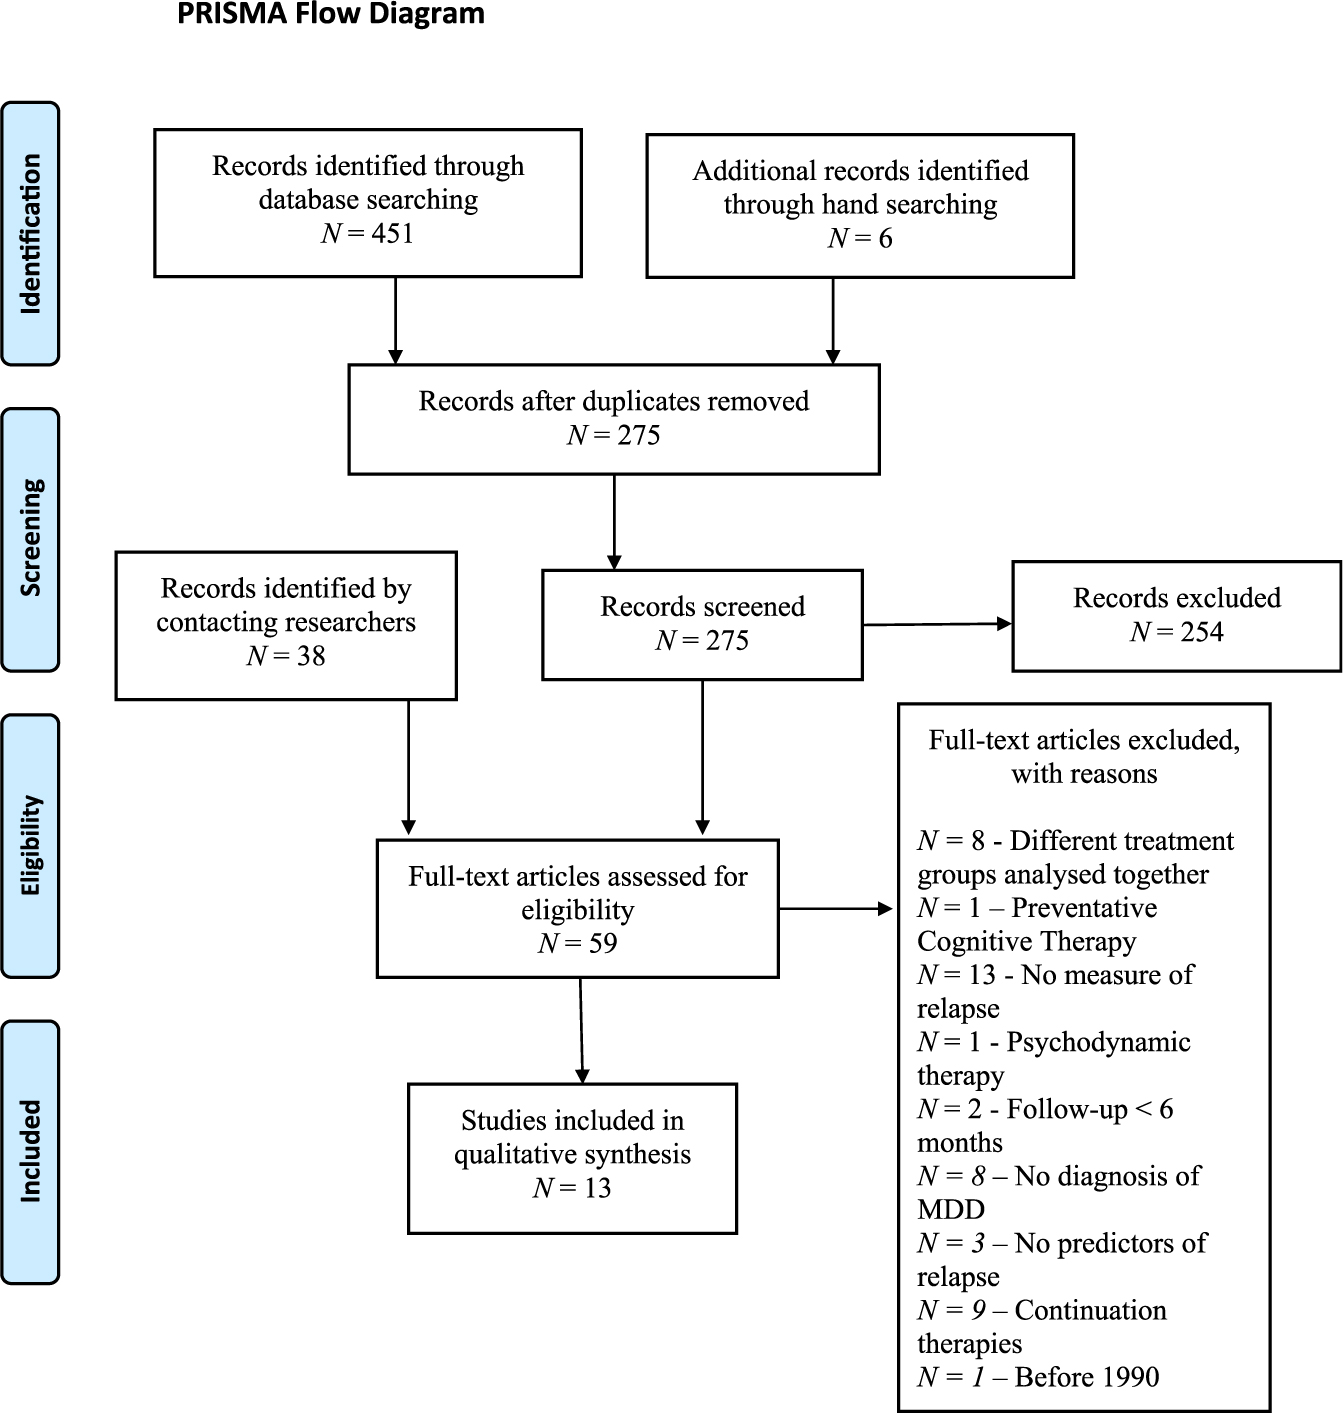
The search strategy returned 275 unique titles and abstracts, which were screened for eligibility. Hand searching was also conducted using the reference lists from previous reviews and included studies. Further to this, the corresponding authors of eligible articles were contacted and given 4 weeks to recommend relevant articles. This generated 38 new articles, of which only one met the above eligibility criteria for review. The most common reasons for exclusion during screening were: populations of adolescents/children; psychological problems other than depression (e.g. bulimia, psychosis); treatments other than CBT; or the studies did not quantify or report RR rates. Fifty-nine full-text articles were then assessed for eligibility independently by two reviewers; any disagreements were discussed and resolved by consensus. Thirteen articles were identified as eligible for inclusion in the review. Figure 1 shows the PRISMA diagram (Moher et al., Reference Moher, Liberati, Tetzlaff and Altman2009) for the systematic selection of articles.
PRISMA diagram presenting search results and article selection procedure.

Quality assessment
Eligible papers were independently assessed for risk of bias by two reviewers, using the Cochrane Collaboration tool for assessing risk of bias for controlled trials (Higgins et al., Reference Higgins, Altman, Gøtzsche, Jüni, Moher, Oxman, Savović, Schulz, Weeks and Sterne2011) and the quality assessment tool for observational and cohort studies (U.S. Department of Health and Human Services, 2014). There were no disagreements in results between the two independent reviewers.
Data extraction and synthesis
Data were extracted and tabulated using the Cochrane Collaboration Data Collection form (Higgins and Green, Reference Higgins and Green2011). Two reviewers extracted the data independently. A statistical synthesis of quantitative data was performed using random effects meta-analysis. In line with standard recommendations (Borenstein et al., Reference Borenstein, Hedges, Higgins and Rothstein2009; Valentine et al., Reference Valentine, Pigott and Rothstein2010), meta-analysis was restricted to predictors that were examined across two or more studies, and where relevant significance tests were reported. To aid interpretation, we transformed relevant inferential statistics (e.g. odds ratios, chi-squared tests, t-tests, etc.) into correlation coefficients (r) to attain standardization and to enable meta-analysis (Borenstein et al., Reference Borenstein, Hedges, Higgins and Rothstein2009). Heterogeneity was examined using the Q and I2 statistics (Higgins et al., Reference Higgins, Thompson, Deeks and Altman2003). Potential publication bias was examined using regression and rank-correlation tests for funnel plot asymmetry. Additionally, the Fail-safe N calculation was performed using Rosenthal’s method (Orwin, Reference Orwin1983). The small number of studies (≤5) entered into meta-analysis precluded more detailed sub-group or moderator analyses.
It was not possible to apply meta-analytic methods for numerous potential variables due to under-reporting of statistical information or lack of replication in multiple studies. We therefore present a detailed narrative synthesis of the results across studies, in order to assess the evidence concerning variables that were not examined through meta-analysis.
Results
Study characteristics
Of the 13 studies eligible for inclusion, nine were RCTs and four were longitudinal cohort studies. Across these studies, age ranged between 18 and 70 years, with a higher proportion of female participants. Studies were conducted in the USA, Canada and the Netherlands. Most used a combination of diagnostic interviews and screening tools to determine a depression diagnosis; however, four studies only used diagnostic interviews. The total pooled sample size across included studies was 1219.
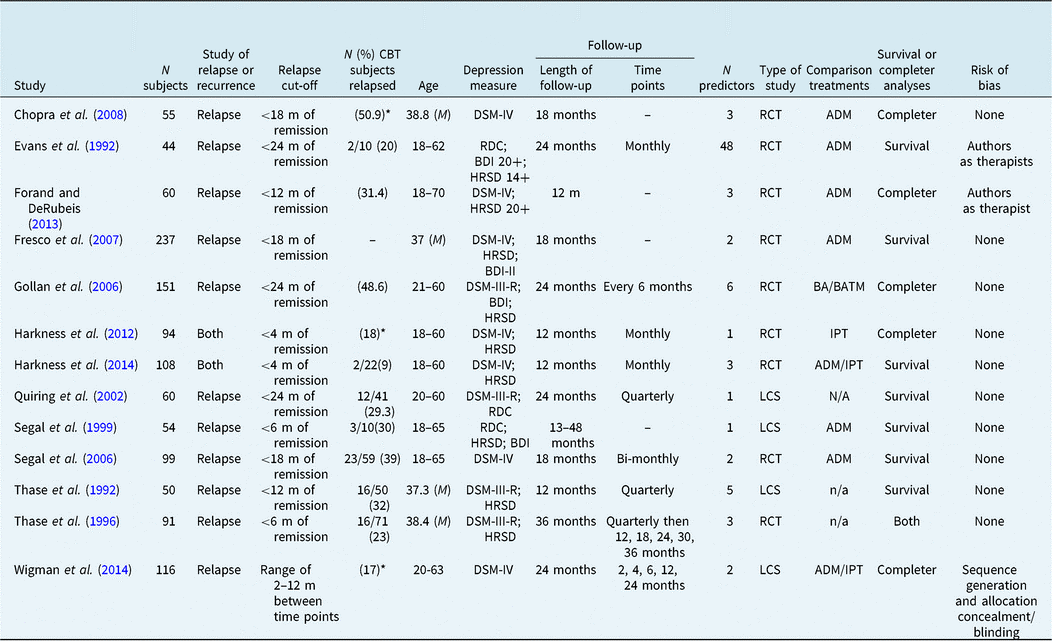
Follow-up duration ranged from 12 months to 48 months, with a mean follow-up duration of 20 months. Differences in follow-up duration could potentially influence results, as studies with a 12-month follow-up may show lower rates of RR than those with a 36-month follow-up. However, after conducting a Pearson’s correlation between RR rates and follow-up duration, we found no significant association (r = 0.46, p = 0.16). An important discrepancy is that no single or consistent cut-off was used across studies to demarcate relapse and recurrence events. As shown in Table 1, the cut-off period (from the time of remission of symptoms) to define ‘relapse’ events varied from 4 up to 24 months across different studies, thus blurring the boundaries between these clinical phenomena. As previously discussed, for this reason we refer only to predictors of RR (relapse and/or recurrence) events, as it is not possible to parse these clinical phenomena across studies.
Study characteristics

M, mean; HRSD, Hamilton Rating Scale for Depression) (Hamilton, Reference Hamilton1960); DSM, Diagnostic and Statistics Manual of Mental Disorders; RDC, Research Diagnostic Criteria (Spitzer et al., Reference Spitzer, Endicott and Robins1985); BDI, Beck’s Depression Inventory (Beck et al., Reference Beck, Ward, Mendelson, Mock and Erbaugh1961); MDD, major depressive disorder; –, information not available; RCT, randomized controlled trial; LCS, longitudinal cohort study; ADM, anti-depressant medication; BA, behavioural activation; BATM, behavioural activation with automatic thoughts modification; IPT, interpersonal psychotherapy; n/a, not applicable; *this % is from a combined CBT/medication sample as the study did not report CBT-specific relapse rates.
The most common statistical technique used to examine potential predictors was a Cox proportional hazards regression and survival analysis (Cox and Oakes, Reference Cox and Oakes1984), which investigates the effect of several variables on the time to RR. The studies that used this technique collected measures of depression symptoms and/or diagnosis over the follow-up period either monthly, bi-monthly or quarterly (see Table 1). Eleven of the selected studies used this technique (Chopra et al., Reference Chopra, Segal, Buis, Kennedy and Levitan2008; Evans et al., Reference Evans, Hollon, DeRubeis, Piasecki, Grove, Garvey and Tuason1992; Fresco et al., Reference Fresco, Segal, Buis and Kennedy2007; Forand and DeRubeis, Reference Forand and DeRubeis2013; Gollan et al., Reference Gollan, Gortner and Dobson2006; Harkness et al., Reference Harkness, Bagby and Kennedy2012, Reference Harkness, Theriault, Stewart and Bagby2014; Quiring et al., Reference Quiring, Monroe, Simons and Thase2002; Segal et al., Reference Segal, Kennedy, Gemar, Hood, Pedersen and Buis2006; Thase et al., Reference Thase, Simons, McGeary, Cahalane, Hughes, Harden and Friedman1992, Reference Thase, Simons and Reynolds1996). Kaplan-Meier survival analysis was also used alongside a Cox proportional hazards regression in one study (Chopra et al., Reference Chopra, Segal, Buis, Kennedy and Levitan2008). A point bi-serial correlation was conducted as the main analysis by Harkness et al. (Reference Harkness, Theriault, Stewart and Bagby2014) and a logistic regression was conducted by Wigman et al. (Reference Wigman, Van Os, Abidi, Huibers, Roelofs, Arntz, Kelleher and Peeters2014) and Segal et al. (Reference Segal, Gemar and Williams1999). The samples used in Chopra et al. (Reference Chopra, Segal, Buis, Kennedy and Levitan2008) and Fresco et al. (Reference Fresco, Segal, Buis and Kennedy2007) were derived from the study by Segal et al. (Reference Segal, Kennedy, Gemar, Hood, Pedersen and Buis2006). Therefore, data from one sample was used in different analyses resulting in three separate sets of results.
Eight studies used a combined analysis of treatments, where differences in RR were compared between treatment groups, and if the difference was non-significant they were grouped together for the investigation of predictors of RR (Chopra et al., Reference Chopra, Segal, Buis, Kennedy and Levitan2008; Evans et al., Reference Evans, Hollon, DeRubeis, Piasecki, Grove, Garvey and Tuason1992; Gollan et al., Reference Gollan, Gortner and Dobson2006; Harkness et al., Reference Harkness, Bagby and Kennedy2012, Reference Harkness, Theriault, Stewart and Bagby2014; Segal et al., Reference Segal, Gemar and Williams1999, Reference Segal, Kennedy, Gemar, Hood, Pedersen and Buis2006; Wigman et al., Reference Wigman, Van Os, Abidi, Huibers, Roelofs, Arntz, Kelleher and Peeters2014). Overall, studies that analysed RR after CBT alone reported a mean RR rate of 29.1%, and studies that grouped different treatments together (e.g. CBT with pharmacotherapy; CBT with behavioural activation; CBT with interpersonal therapy and pharmacotherapy) reported a mean RR rate of 28.6%. For clarity, Table 1 presents the total sample sizes for each study (including combined treatments in some studies) and separately presents the RR rates that are specific to the CBT treatment groups where this was reported. Meta-analyses reported below present specific sample sizes for the number of cases (sometimes sub-samples from a wider study) that were followed-up to track RR.
Quality assessment of controlled trials
Sequence generation
Most of the studies did not provide sufficient information to assess whether there was a risk of bias due to randomization. Most studies lacked a detailed description of the randomization procedures.
Allocation concealment and blinding
Due to the nature of the studies included in this review, there is a high risk of bias towards concealment as participants would be aware if they were receiving CBT or pharmacotherapy, as would the therapist(s) administering the treatment. Six of the studies do not provide enough information on the blinding of researchers collecting data, but three studies used research assistants who were blind to the participant’s condition when collecting data (Evans et al., Reference Evans, Hollon, DeRubeis, Piasecki, Grove, Garvey and Tuason1992; Harkness et al., Reference Harkness, Bagby and Kennedy2012, Reference Harkness, Theriault, Stewart and Bagby2014).
Incomplete outcome data
As is common in longitudinal studies, there were high rates of attrition. Most of the studies addressed attrition by either conducting completer analyses (Evans et al., Reference Evans, Hollon, DeRubeis, Piasecki, Grove, Garvey and Tuason1992; Gollan et al., Reference Gollan, Gortner and Dobson2006; Harkness et al., Reference Harkness, Theriault, Stewart and Bagby2014; Thase et al., Reference Thase, Simons and Reynolds1996), conducting multiple imputation (Harkness et al., Reference Harkness, Bagby and Kennedy2012), or interpolating their data (Forand and DeRubeis, Reference Forand and DeRubeis2013). Three studies do not provide enough information on how they dealt with missing data (Chopra et al., Reference Chopra, Segal, Buis, Kennedy and Levitan2008; Fresco et al., Reference Fresco, Segal, Buis and Kennedy2007; Segal et al., Reference Segal, Kennedy, Gemar, Hood, Pedersen and Buis2006).
Selective reporting
There is little evidence of selective reporting within six of the included studies, with the remaining three showing a low risk of selective reporting as evidenced by published protocols (Chopra et al., Reference Chopra, Segal, Buis, Kennedy and Levitan2008), clear explanations for missing analyses (Forand and DeRubeis, Reference Forand and DeRubeis2013) and stating hypotheses before treatment began (Harkness et al., Reference Harkness, Bagby and Kennedy2012).
Other sources of bias
Concerns for other sources of bias come from two studies. In Evans et al. (Reference Evans, Hollon, DeRubeis, Piasecki, Grove, Garvey and Tuason1992) and Forand and DeRubeis (Reference Forand and DeRubeis2013), the authors of the paper are also the therapists within the study, potentially leading to researcher allegiance effects. Although it may be coincidental, Evans et al. (Reference Evans, Hollon, DeRubeis, Piasecki, Grove, Garvey and Tuason1992) also shows one of the lowest rates of RR among the studies.
Quality assessment for observational studies
All four observational studies (Quiring et al., Reference Quiring, Monroe, Simons and Thase2002; Thase et al., Reference Thase, Simons, McGeary, Cahalane, Hughes, Harden and Friedman1992; Segal et al., Reference Segal, Gemar and Williams1999; Wigman et al., Reference Wigman, Van Os, Abidi, Huibers, Roelofs, Arntz, Kelleher and Peeters2014) were rated as being of good quality by the two reviewers.
Rates of RR
The reported rates of depressive RR varied between studies, ranging from 18.5 to 46.5% after acute-phase CBT. There was an average of 33.4% events within a maximum follow-up period of 36 months.
Predictors of RR
Studies included in this review investigated 62 variables as potential predictors of relapse. Only four variables were consistently assessed as potential predictors of RR in more than one study (residual depressive symptoms, prior episodes, cognitive reactivity, marital status). It is possible that some studies examined a broader range of predictors that were not published in their final report. Clinical variables (e.g. residual depressive symptoms, prior number of depression episodes) tended to be studied more often than demographic variables (e.g. age, gender, etc.). We reviewed all identified (significant and non-significant) predictors, grouped into seven categories: residual depressive symptoms; prior episodes of depression; cognitive reactivity; stressful life events; personality factors; clinical and diagnostic factors; demographics. Most of the results are described in narrative form, as data in the primary studies did not allow for a quantitative synthesis. Meta-analyses are presented only for those variables that were examined in more than one study, and where sufficient quantitative data were available.
Residual depressive symptoms
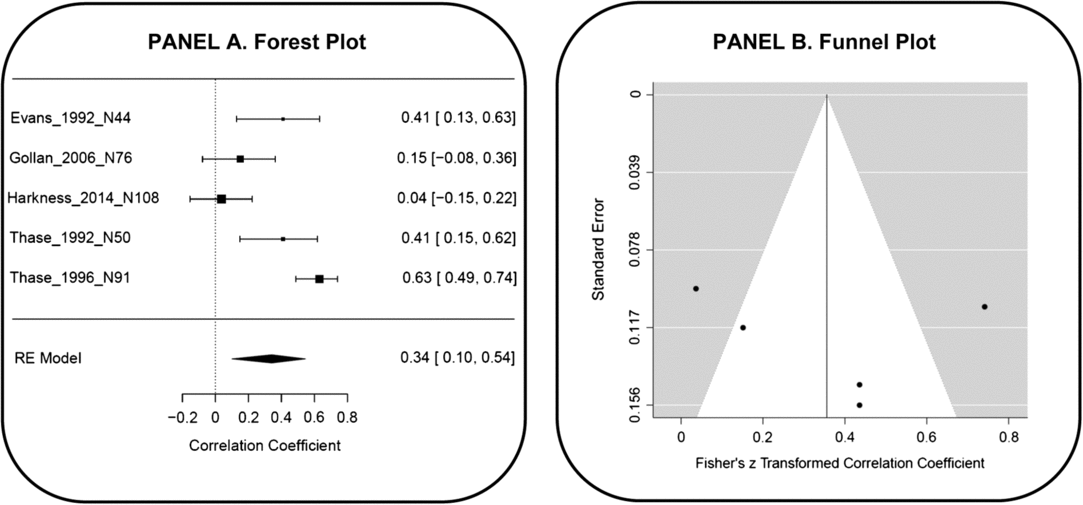
Five studies examined residual depressive symptoms (e.g. measured using the Beck Depression Inventory; Beck et al., Reference Beck, Ward, Mendelson, Mock and Erbaugh1961, or Hamilton Rating Scale for Depression; Hamilton, Reference Hamilton1960) at the end of the acute phase of treatment as a predictor of RR. Four reported statistically significant results (Evans et al., Reference Evans, Hollon, DeRubeis, Piasecki, Grove, Garvey and Tuason1992; Harkness et al., Reference Harkness, Theriault, Stewart and Bagby2014; Thase et al., Reference Thase, Simons, McGeary, Cahalane, Hughes, Harden and Friedman1992, Reference Thase, Simons and Reynolds1996) and one reported non-significant results (Gollan et al., Reference Gollan, Gortner and Dobson2006). Meta-analysis results for these studies are displayed in Fig. 2. The pooled effect was statistically significant, denoting a moderate correlation between residual depressive symptoms and RR; r = 0.34 (95% CI 0.10, 0.54), p = .01. There was evidence of considerable heterogeneity; Q = 27.27, d.f. = 4, p < 0.0001; I2 = 85.3% (95% CI 67.6, 93.4). The regression (t = 0.4729, d.f. = 3, p = 0.67) and rank correlation tests (Kendall’s tau = 0.2000, p = 0.82) for funnel plot asymmetry were not statistically significant, indicating no evidence of likely publication bias. According to the fail-safe N, 72 null studies would be needed to overturn this meta-analytic result.
Random effects meta-analysis: correlations between residual depression and relapse/recurrence.

Prior episodes of depression
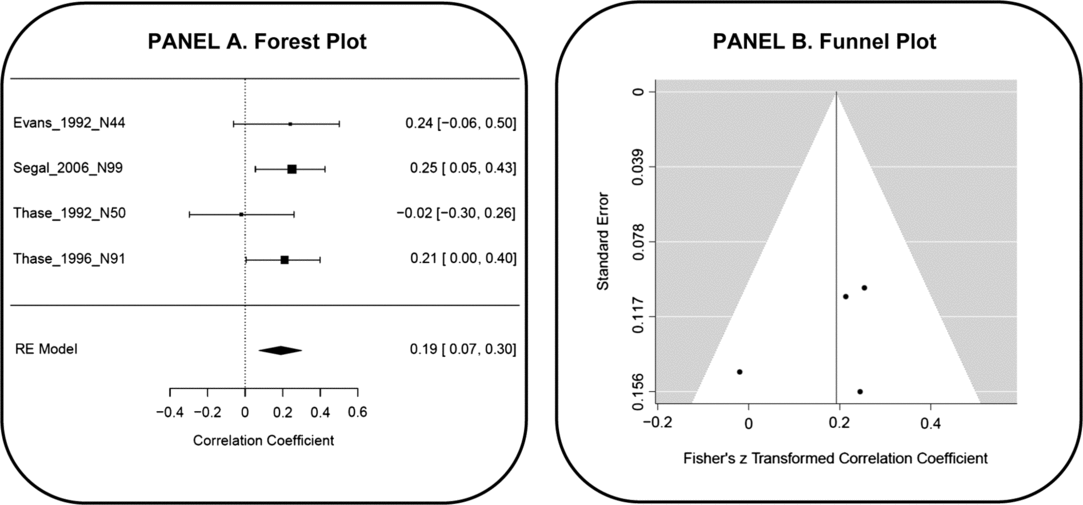
Five studies examined prior depression episodes or treatments as a predictor of RR. Four reported statistically significant results (Evans et al., Reference Evans, Hollon, DeRubeis, Piasecki, Grove, Garvey and Tuason1992; Chopra et al., Reference Chopra, Segal, Buis, Kennedy and Levitan2008; Segal et al., Reference Segal, Kennedy, Gemar, Hood, Pedersen and Buis2006; Thase et al., Reference Thase, Simons and Reynolds1996) and one reported non-significant results (Thase et al., Reference Thase, Simons, McGeary, Cahalane, Hughes, Harden and Friedman1992). Meta-analysis results for these studies are displayed in Fig. 3, which excludes the study by Chopra et al. (Reference Chopra, Segal, Buis, Kennedy and Levitan2008) as it is derived from the sample reported by Segal et al. (Reference Segal, Kennedy, Gemar, Hood, Pedersen and Buis2006). The pooled effect was statistically significant, denoting a small correlation between prior depression episodes and RR; r = 0.19 (0.07, 0.30), p = .002. There was no significant evidence of heterogeneity; Q =2.64, d.f. = 3, p = 0.45; I2 = 0.0% (95% CI 0.0, 82.6). The regression (t = –0.8810, d.f. = 2, p = 0.47) and rank correlation tests (Kendall’s tau = –0.33, p = 0.75) for funnel plot asymmetry were not statistically significant and the fail-safe N was 9.
Random effects meta-analysis: correlations between prior depression episodes and relapse/recurrence.

Cognitive reactivity
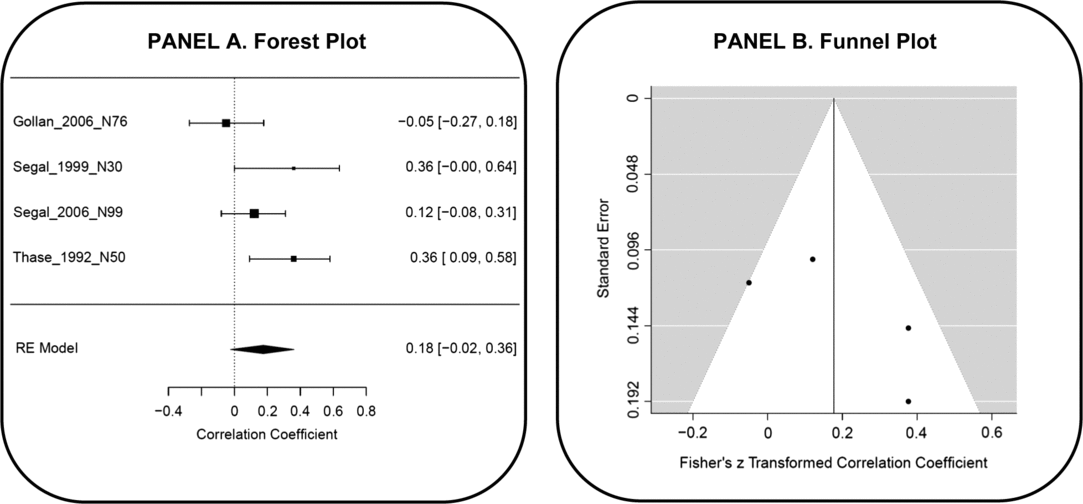
Seven studies examined responses to the Dysfunctional Attitudes Scale (DAS; Weissman, Reference Weissman1979) as a predictor of RR. Six studies examined DAS scores as a measure of ‘cognitive reactivity’, following mood provocation at the end of treatment (Chopra et al., Reference Chopra, Segal, Buis, Kennedy and Levitan2008; Fresco et al., Reference Fresco, Segal, Buis and Kennedy2007; Gollan et al., Reference Gollan, Gortner and Dobson2006; Segal et al., Reference Segal, Gemar and Williams1999, Reference Segal, Kennedy, Gemar, Hood, Pedersen and Buis2006; Thase et al., Reference Thase, Simons, McGeary, Cahalane, Hughes, Harden and Friedman1992). However, two of these (Chopra et al., Reference Chopra, Segal, Buis, Kennedy and Levitan2008; Fresco et al., Reference Fresco, Segal, Buis and Kennedy2007) were secondary analyses using the sample from Segal et al. (Reference Segal, Kennedy, Gemar, Hood, Pedersen and Buis2006) and were therefore excluded from meta-analysis. One further study (Evans et al., Reference Evans, Hollon, DeRubeis, Piasecki, Grove, Garvey and Tuason1992) was excluded from meta-analysis as it measured DAS before treatment and did not report relevant statistics; this study did not find pre-treatment DAS to predict RR. Meta-analysis results for the four included studies are displayed in Fig. 4. The pooled effect was not statistically significant; r = 0.18 (−0.02, 0.36), p = .08. There was no significant evidence of heterogeneity; Q = 6.81, d.f. = 3, p = 0.08; I2 = 56.0% (95% CI 0.0, 85.4). The regression (t = 1.40, d.f. = 2, p = 0.30) and rank correlation tests (Kendall’s tau = 0.33, p = 0.75) for funnel plot asymmetry were not statistically significant and the fail-safe N was 7.
Random effects meta-analysis: correlations between cognitive reactivity and relapse/recurrence.

Stressful life events
Participants who reported suffering from childhood maltreatment assessed using the Childhood Experience of Care and Abuse questionnaire (Bifulco et al., Reference Bifulco, Brown and Harris1994) were significantly more likely to experience depressive RR with an OR of 2.89 (Harkness et al., Reference Harkness, Bagby and Kennedy2012). In addition, experiencing a higher total number of dependent chronic stressors (OR = 1.34) (Harkness et al., Reference Harkness, Theriault, Stewart and Bagby2014) and experiencing a severe independent life event post-treatment also predicted greater risk of RR (OR = 1.03) (Harkness et al., Reference Harkness, Theriault, Stewart and Bagby2014); both of these predictors were measured on the Life Events and Difficulties Schedule (LEDS).
Personality factors
Greater neuroticism scores on the Eysenck Personality Inventory – Neuroticism and Extroversion Scales (Eysenck, Reference Eysenck1968) and greater scores of hopelessness on the Hopelessness Scale (Beck et al., Reference Beck, Weissman, Lester and Trexler1974) also significantly predicted RR (Evans et al., Reference Evans, Hollon, DeRubeis, Piasecki, Grove, Garvey and Tuason1992). A dependent personality style on the Millon Clinical Multiaxial Inventory-II (Millon, Reference Millon1987) and scoring low on the Pleasant Events Schedule (PES) (MacPhillamy and Lewisohm, Reference MacPhillamy and Lewinsohn1982) representing low perceived pleasure post-treatment also predicted RR (Gollan et al., Reference Gollan, Gortner and Dobson2006). Attributional style was not found to be significantly associated with risk of RR (Evans et al., Reference Evans, Hollon, DeRubeis, Piasecki, Grove, Garvey and Tuason1992; Gollan et al., Reference Gollan, Gortner and Dobson2006).
Other clinical and diagnostic factors
Quiring et al. (Reference Quiring, Monroe, Simons and Thase2002) found that as time to treatment entry (time between the onset of depressive symptoms and the time when treatment begins) increased, time taken to RR also significantly increased. A slower decrease in symptom scores (i.e. a longer time to treatment response) also significantly predicted a higher chance of RR (Thase et al., Reference Thase, Simons, McGeary, Cahalane, Hughes, Harden and Friedman1992). High levels of intake anxiety (pre-treatment) on the Beck Anxiety Inventory (BAI; Beck et al., Reference Beck, Epstein, Brown and Steer1988) predicted a shorter time to RR after completing treatment (OR = 1.08), but post-treatment anxiety levels did not predict RR (Forand and DeRubeis, Reference Forand and DeRubeis2013). Participants that presented symptoms of a sub-clinical psychotic experience measured by the Community Assessment of Psychic Experiences (CAPE; Brenner et al., Reference Brenner, Schmitz, Pawliuk, Fathalli, Joober, Ciampi and King2007) and sub-threshold bipolar symptoms measured on the Mood Disorders Questionnaire (MDQ) (Hirschfeld et al., Reference Hirschfeld, Williams, Spitzer, Calabrese, Flynn, Keck, Lewis, McElroy, Post, Rapport and Russell2000) were also found to be significantly more prone to RR with odds ratios of 3.85 and 1.16, respectively (Wigman et al., Reference Wigman, Van Os, Abidi, Huibers, Roelofs, Arntz, Kelleher and Peeters2014).
Chopra et al. (Reference Chopra, Segal, Buis, Kennedy and Levitan2008) found that levels of cortisol post-treatment interacted with patients’ number of prior episodes. Patients with high cortisol levels had similar rates of RR regardless of prior episodes, but patients with low cortisol levels with two or fewer prior episodes tended to have lower rates of RR.
Non-significant diagnostic and clinical history features included: age at onset of disorder; duration of current episode; insidiousness of onset; presence of precipitant; previous treatment with tricyclics; history of hospitalization; suicidal ideation; history of suicide attempts; history of alcoholism; history of substance abuse; Research Diagnostic Criteria (RDC) depressive sub-type; double depression; family history of depression; general level of functioning; biological functions (Evans et al., Reference Evans, Hollon, DeRubeis, Piasecki, Grove, Garvey and Tuason1992); and abnormal sleep patterns (Thase et al., Reference Thase, Simons and Reynolds1996).
Demographics
Thase et al. (Reference Thase, Simons, McGeary, Cahalane, Hughes, Harden and Friedman1992) found that unmarried participants were more likely to experience RR; however, Evans et al. (Reference Evans, Hollon, DeRubeis, Piasecki, Grove, Garvey and Tuason1992) did not find marital status to be a significant predictor. Other demographic characteristics that were not associated with RR included age, gender, race, employment status, education, socioeconomic status, and intelligence (Evans et al., Reference Evans, Hollon, DeRubeis, Piasecki, Grove, Garvey and Tuason1992).
Discussion
This study presents the first systematic review and quantitative synthesis of the literature on predictors of RR (relapse and/or recurrence) after CBT for depression. We specifically chose to review studies that investigated typical acute-phase CBT, which does not usually include intensive or lengthy continuation-phase interventions (e.g. MBCT). In the following section, we discuss key findings, limitations and recommendations for future research.
Several significant predictors were identified across studies; however, the majority were only tested in single studies and lacked replicated findings. This was particularly the case for most personality factors, demographics, stressful life events, and clinical and diagnostic factors. Three variables, however, were examined across multiple studies that reported sufficient data to enable meta-analysis. Residual depressive symptoms and prior episodes have been previously cited as the most robust predictors of depressive RR (Burcusa and Iacono, Reference Burcusa and Iacono2007; Keller et al., Reference Keller, Lavori, Lewis and Klerman1983; Kessing et al., Reference Kessing, Hansen, Andersen and Angst2004; Mueller et al., Reference Mueller, Leon, Keller, Solomon, Endicott, Coryell, Warshaw and Maser1999). Our meta-analytic results indicated statistically significant and moderate correlations (r = 0.34 and r =0.19) between each of these variables and the risk of RR. Furthermore, we found no evidence of potential publication bias, and the failsafe N calculations for each of these predictors (72 and 9) indicated that numerous studies with null findings would be needed to overturn these results. Indices of heterogeneity were high (I2 = 85.3%) for residual depressive symptoms but not for prior episodes (I2 = 0%). Given that both meta-analyses included common studies, the considerable difference in heterogeneity may be related to the way in which residual depressive symptoms were classified across studies (as opposed to other sources of variability present in the second meta-analysis, such as follow-up duration, diagnostic methods, study design).
A third commonly cited predictor of depressive RR is cognitive reactivity as measured by the DAS following a mood induction procedure (Segal et al., Reference Segal, Gemar and Williams1999, Reference Segal, Kennedy, Gemar, Hood, Pedersen and Buis2006). Several commentaries refer to this as an established fact (e.g. see Kuyken et al., Reference Kuyken, Dalgleish and Holden2007; Dimidjian et al., Reference Dimidjian, Kleiber, Segal, Kazantzis, Reinecke and Freeman2010), often citing one or two seminal papers with significant findings. Our meta-analysis does not support this assertion, as the pooled correlation between cognitive reactivity and RR was not significant, and there was no evidence of significant heterogeneity in the sample of included studies. This fits with emerging studies that suggest that mood reactivity may be more relevant than cognitive reactivity in the prediction of RR (Lethbridge and Allen, Reference Lethbridge and Allen2008; Rucci et al., Reference Rucci, Frank, Calugi, Miniati, Benvenuti, Wallace, Fagiolini, Maggi, Kupfer and Cassano2011; van Rijsbergen et al., Reference van Rijsbergen, Bockting, Burger, Spinhoven, Koeter, Ruhé, Hollon and Schene2013). It is possible that the mood induction task itself enables the identification of cases at high risk of RR, but the risk signals (e.g. high sensitivity to daily stressors, delayed return to euthymic mood) may be sub-optimally indexed by the DAS measure.
Limitations
A number of limitations are worth considering in relation to the primary studies, and also the present systematic review methods. As shown in Table 1, at least half of the reviewed studies applied arbitrary or unconventional operational definitions of relapse, which made it impossible to clearly disentangle predictors of relapse versus recurrence events.
A major limitation concerns statistical power. The small sample sizes across most of these studies means that they were highly likely to be underpowered to detect significant factors that may have a small to moderate effect on the risk of RR. For example, according to Cohen’s sample size estimation criteria (Cohen, Reference Cohen1992), a simple comparison of means (between cases that RR and those who do not) in a continuous predictor using ANOVA would require at least 26 RR cases to detect a large effect size with 80% power, and thus an overall sample of 85 if we assume a RR base rate of 30%. Using these criteria, 212 participants (64 RR cases) would be necessary to detect a medium effect size and 1310 participants (393 RR cases) to detect a small effect size. The largest number of subjects that experienced a RR event in the reviewed studies was 40 (Gollan et al., Reference Gollan, Gortner and Dobson2006), whilst the mean was only 19. We therefore conclude that not even the largest of these studies was sufficiently powered to detect a medium effect size, and the fact that many studies analysed multiple variables further reduces our confidence in their suitability to reliably detect significant predictors of RR. In this context, meta-analyses are especially important to weigh up the findings and uncertainty across multiple small studies. As argued by Borenstein et al. (Reference Borenstein, Hedges, Higgins and Rothstein2009), conclusions drawn from small meta-analyses including two (or more) studies are preferable to the idiosyncratic interpretations that people may be more likely to make when reading the results of studies that are not quantitatively pooled and synthesized. Furthermore, over half of the reviewed studies only reported significant results – there was no mention of variables that were non-significant predictors of RR in most of the studies. This potentially indicates increased risk of selective reporting.
The present review had several strengths including the pre-registration of the study protocol; searches across multiple databases, reference lists and direct requisition to corresponding authors; double rating of included studies; and quantitative meta-analyses of available data. However, this review was limited by the exclusions imposed on grey literature, publications in languages other than English, studies in children and young people, and studies which included a continuation-phase procedure or intervention. Furthermore, the small number of included studies did not allow further sub-group and moderator analyses.
Future research
Many studies that were deemed ineligible for this review were well-designed controlled trials with adequate longitudinal follow-up periods; however, these did not quantify RR events or rates at follow-up. Typically, trials of CBT tend to analyse follow-up outcomes using continuous outcome measures (e.g. mean depression severity ratings aggregated at a group-level), which mask RR rates and make it difficult to assess individual differences in long-term remission. It is advisable for future trials to report RR rates following conventional definitions to aid comparability. We recommend that a statistically reliable and clinically significant deterioration in depression symptoms should be classed as a relapse if it occurs within 12 months after the end of the acute phase of treatment, and classed as a recurrence if it occurs after 12 months (see Bockting et al., Reference Bockting, Hollon, Jarrett, Kuyken and Dobson2015; Delgadillo et al., Reference Delgadillo, Rhodes, Moreea, McMillan, Gilbody, Leach, Lucock, Lutz and Ali2018).
It is clear that there is a need for further research in this area, testing plausible predictors in studies that are designed using stringent a priori sample size calculations that would enable the detection of small to medium effect sizes (as evidenced in our meta-analyses) and expecting a typical base rate (30%) of RR events. Personality factors (e.g. neuroticism, hopelessness, perceived pleasure) predicted RR most frequently in the included studies, albeit in single studies. Thus, an implication for future research would be to investigate the extent to which such personality factors can be replicated as reliable markers of depressive RR following CBT.
Furthermore, detailed investigations of the mood reactivity hypothesis could be fruitful, for example including self-reported mood, cortisol levels, and brain imaging data after negative mood inductions as potential predictors of RR events. It is plausible that mood reactivity may interact with the presence, chronicity, perceived intensity or control of stressful life events to predict RR (Harkness et al., Reference Harkness, Theriault, Stewart and Bagby2014). Alternatively, it may be that the presence of residual depressive symptoms and prior episodes are broadly indicative of a kindling effect, whereby successive depressive episodes are triggered by progressively milder stressors irrespective of their intensity or controllability (Monroe and Harkness, Reference Monroe and Harkness2005). People with certain risk factors (e.g. early childhood adversity, trait neuroticism) may become highly sensitive to multiple stressors over time. They may therefore show elevated (residual) symptoms after therapy that become intensified with stressful events, thus precipitating a cycle of recurrence that in turn undermines their sense of hope and self-efficacy. Future longitudinal cohort studies could test these assumptions empirically by collecting data on potential predisposing (e.g. personality, trauma history), prognostic (e.g. prior episodes, residual symptoms after CBT, mood reactivity markers), activating (e.g. stressful life events) and mediating (e.g. self-efficacy, emotion regulation skills, delayed return to euthymic mood) variables.
Clinical implications
It is clear that depression is a highly refractory condition, with approximately one-third of patients having a clinically significant deterioration of symptoms after CBT. Accordingly, dedicating time to developing a comprehensive RR prevention blueprint and offering post-treatment booster sessions for at least 6 months is indicated as part of routine practice. Studies using monthly post-treatment tracking of symptoms show that the majority (78%) of clinically significant deterioration events occur within the first 6 months after therapy, so this is a critical period to monitor response to psychological care (Delgadillo et al., Reference Delgadillo, Rhodes, Moreea, McMillan, Gilbody, Leach, Lucock, Lutz and Ali2018). There are also well-established relapse prevention interventions that should be offered after patients have completed an acute-phase treatment, such as continuation-phase CBT (Vittengl et al., Reference Vittengl, Clark, Dunn and Jarrett2007) and MBCT (Piet and Hougaard, Reference Piet and Hougaard2011). As others have argued (Scott et al., Reference Scott, Palmer, Paykel, Teasdale and Hayhurst2003), adjunctive and continuation-phase interventions are costly, but gains in prevention tend to outweigh the costs of future episodes of care for people that experience RR, who are often more severely impaired with each subsequent episode. These continuation-phase treatments could be offered in a stratified care model to maximize cost-effectiveness, selectively targeting cases with well-established prognostic risk factors (residual depressive symptoms and/or >3 prior episodes). Cases without such risk factors could be monitored for up to 6 months through infrequent booster sessions or low-cost telephone contact, to detect early signs of deterioration which might trigger the use of continuation-phase treatments if necessary.
Conclusions
In summary, at least 30% of patients were found to experience RR (relapse and/or recurrence) after acute-phase CBT, confirming that depression is a refractory condition, particularly for patients with prior episodes and with residual depressive symptoms at the end of treatment. Evidence relating to these risk factors could be used to inform a stratified care model for RR prevention, prioritizing costly continuation-phase treatments for cases at high risk of RR.
Acknowledgements
This study was conducted as part of the first author’s MSc in Psychological Research Methods with Advanced Statistics at the University of Sheffield, submitted in 2017.
Financial support
This research received no specific grant from any funding agency, commercial or not-for-profit organization.
Conflicts of interest
The authors declare no conflicts of interest.
Ethical statements
The authors have abided by the Ethical Principles of Psychologists and Code of Conduct as set out by the APA.



Comments
No Comments have been published for this article.