Mass gathering medicine (MGM) is a subspecialty of emergency medicine that focuses on a “situation (event) during which crowds gather and where there is the potential for a delayed response to emergencies because of limited access to patients or other features of the environment and location.”Reference Arbon 1 These events have the potential to impact the full spectrum of public safety professionals, including law enforcement, fire services, emergency medical services (EMS), public health officers, health care facilities, facility staff and most importantly event attendees.Reference Ciottone 2 Previous literature has demonstrated that the presence of on-site physicians and nurses significantly reduces ambulance transport at mass gatherings by up to 89%.Reference Grange, Baumann and Vaezazizi 3 , Reference Lund and Turris 4 However, there is little evidence to support a particular staffing model at sporting or entertainment sites. Analysis of patient presentations and transports at various types of mass gatherings can help to inform these staffing models and improve medical preparedness.
Importance
Current MGM literature consists mainly of descriptive case studies of specific individual events.Reference Britten, Whiteley, Fox, Goodwin and Horrocks 5 - Reference Sabra, Cabañas and Bedolla 11 In this analysis, we investigate variation between patient presentations and ambulance transport rates across various event types, as well as the reasons for seeking medical care. We present our experience managing >200 mass gathering events of various types over a 6-year period at Gillette Stadium. By evaluating medical staffing, event attendance, patient presentation rates, and transport to hospital rates, we aim to better inform MGM strategies at similar venues to include staffing patterns, ambulance deployment models, and protocol development, as well as to enhance quality of care and decrease health care facility burden by decreasing transport to hospital rate.Reference Grange, Baumann and Vaezazizi 3 , Reference Lund and Turris 4
Methods
Setting
Gillette Stadium, home of the National Football League’s (NFL) New England Patriots, has a maximum spectator capacity of 68,756 and hosts 40-50 mass gathering events each year. These include NFL games, Major League Soccer (MLS) games, concerts and festivals, as well as a variety of other sporting and entertainment events. Depending on the attendance of the event, 2-5 first aid stations are open throughout the stadium. Each first aid station is staffed by a minimum of 3 providers including firefighters and EMS providers. With few exceptions, events with an anticipated attendance of greater than 30,000 are additionally staffed by physicians and nurses from an urban academic emergency department. This group of providers is the primary contact for all spectators and stadium staff requiring medical attention in the stadium or on the immediate grounds (excluding parking lots) during a mass gathering. A contracted private ambulance service provides all patient transports to hospital.
Design
We conducted a retrospective chart review of all patients seeking medical attention at Gillette Stadium during mass gathering events from January 1, 2010 through September 19, 2015. For the purpose of this study, we defined a mass gathering as any event with an attendance of ≥10,000 people; events with attendance of <10,000 were excluded from analysis. Encounter data were extracted from a prospectively populated patient care database for all patient encounters anywhere on the stadium property, including within and outside first aid stations. A separate database, maintained by the transporting EMS agency for all patients transported from the stadium to hospital, was also queried. Data abstracted included event type and date of event, date of birth, gender, chief concern, disposition, and a narrative description of the event and treatment. Previously validated criteria were used to define chief concerns.Reference Ranse and Hutton 12 The Gillette Stadium public relations office provided attendance data for the review period. Environmental data including precipitation, average temperature, and heat index were obtained from publicly accessible internet records. We reviewed all data manually for duplicate entries, which were eliminated. Data were recoded into a standardized format using predetermined fields, de-identified, and merged into a single Microsoft Excel® 2007 database (Microsoft Corp., Redmond, Washington).
Outcomes
Our primary outcome measures were patient presentation rates and transport to hospital rates. We defined the patient presentation rate as the number of episodes of care per 10,000 attendees. The transport to hospital rate was defined as the number of ambulance transports per 10,000 attendees.
In addition to analyzing these results for the data set as a whole, we analyzed variation in the parameter estimates according to predictors of interest, including event type, heat index, chief concern, patient age, and patient gender.
Analysis
Poisson regressions were used for univariate analyses and statistical significance assessed via the likelihood ratio χ2 test. A multivariate analysis was also conducted evaluating the effect of predictors of interest on presentation and transport rates. We used Stata® 14 (StataCorp LP, College Station, Texas) for all analyses. Our Institutional Review Board approved this investigation.
Results
Sample-Wide Rates and Proportions
During the study period, 232 events met our inclusion criteria. Their characteristics are displayed in Table 1. Total attendance at the included events was 8,260,349 people, generating 8157 medical contacts. The overall patient presentation rate was 10 presentations per 10,000 attendees (95% CI: 9.66-10.09). There were 1310 ambulance transports over the study period, for an overall transport to hospital rate of 1.6 transports per 10,000 attendees (95% CI: 1.50-1.67). Overall, 16% of all patients presenting for medical attention were ultimately transported to hospitals (Table 1).
Average Attendance, Patient Presentation Rate, Transport to Hospital Rate and Proportion of Patients Transported at Various Event Types

Abbreviations: NFL, National Football League; MLS, Major League Soccer.
a Per 10,000 patients.
b P<0.0001 for differences between groups.
c P=0.01 for differences between groups.
Variation in Rates and Proportions by Predictors of Interest
All outcomes of interest varied significantly by event type (Table 1). Inspection of these data reveals that concerts generated substantially more presentations than other event types. Both patient presentation rate (P<0.0001) and transport to hospital rate (P<0.0001) varied significantly by event type, with concerts generating the highest patient presentation rate (23 per 10,000) and transport to hospital rate (3.8 per 10,000).
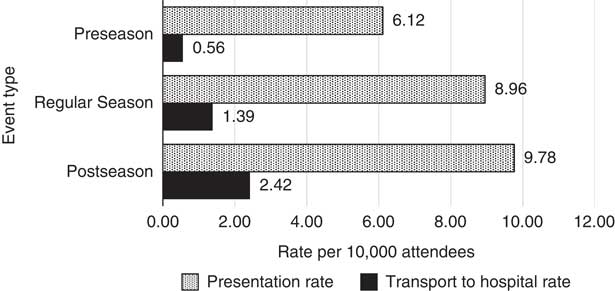
Comparing preseason (n=12), regular season (n=41), and postseason (n=9) NFL games, there was a non-significant trend towards increased patient presentation rate (PPR) in postseason games (6.12 vs 8.97 vs 9.78, respectively). There was likewise no significant overall difference in transport to hospital rate (TTHR) (0.56 vs 1.39 vs 2.42, respectively), although there was a trend towards increased transports as the season progressed. TTHR was significantly higher for postseason games when compared directly with either preseason or regular season NFL games (Figure 1).
Overall Patient Presentation Rate and Transport to Hospital Rate at Preseason, Regular Season, and Postseason National Football League (NFL) Games.

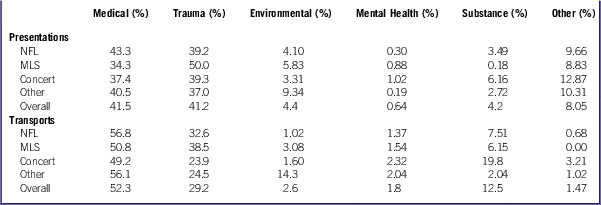
Reason for seeking medical attention varied significantly with event type (P<0.00001) (Table 2). Concerts accounted for a disproportionate rate of presentations for suspected drug and alcohol intoxication, accounting for 6.2% of all presentations and 19.8% of all transports at this event type. Similarly, postseason NFL games had higher rates of presentation and transport for intoxication compared to regular and preseason games (4.6% vs 3.8% vs 0.59% for presentations and 10.7% vs 6.9% vs 2.2% for transports, respectively).
Percentage of Patient Presentations and Transports for Various Conditions Stratified by Event TypeFootnote a

Abbreviations: NFL, National Football League; MLS, Major League Soccer.
a 9.7% of observations were missing chief complaint.
Attendees at NFL games were more likely to seek assistance for medical concerns (43.3% of all presentations) while concertgoers and MLS attendees were most likely to suffer injuries (39.3% and 50.0% of all presentations). Medical was the most common reason for transport in all event types.
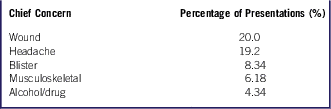
The most common reasons for seeking medical attention overall were wound care (20.1%), followed by headache (19.2%), blisters (8.3%), musculoskeletal concerns (6.2%), and alcohol or drug intoxication (4.3%) (Table 3).
The Top 5 Reasons for Presentation for Medical Care

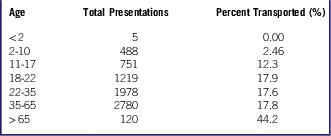
The average age of patients presenting for medical care was 31.8 years old, with a range of 0-93 years. The average transported patient was 35.5 years old with a range of 6-88 years. Overall, transported patients were significantly older (P<0.01). Further, transport rate increased predictably with age, with 44.2% of patients over 65 years of age being transported to hospital as compared with 2.5% of patients aged 2-10 years (Table 4). No patient transports occurred in the 5 patients under 2 years old presenting for medical evaluation.
Percentage of Patients Seen for Medical Evaluation and Ultimately Transported to Hospital, Stratified by AgeFootnote a

a 9.6% of observations were missing age.
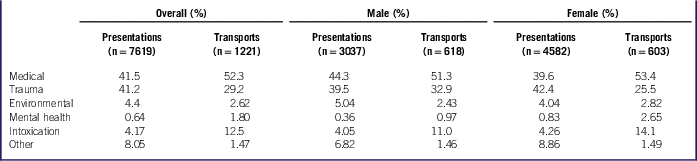
Female patients made up 60.1% of total medical contacts, with male patients accounting for 39.9%. The proportion of patients presenting for care and ultimately transported to hospital was greater for men as compared with women (20.3% vs 13.2%). Chief concern varied significantly by gender for both presentations (P<0.01) and transports (P<0.05) (Table 5). Men preferentially presented for medical concerns (44.3% of all presentations) whereas women were more likely to present for trauma (42.4% of all presentations). However, both men and women were most likely to be transported for medical concerns (51% and 53% of all transports, respectively). Rates of presentation for substance use or alcohol intoxication were not different for men and women (4.1% vs 4.3%); however, women were more likely to be transported due to intoxication (14% of transports vs 11% of transports).
Gender Variations in Reason for Presentation and TransportFootnote a

a 6.7% of observations were missing gender.
Across all events, heat index ranged from 14°F to 97°F with an average of 62.4°F. Overall patient presentation rates and transport rates were not affected by heat index. However, for cold weather events, as defined as a heat index of 40°F or less, transport rates decreased significantly with increasing temperature, with an incidence rate ratio of 0.79 per 5°F increase in heat index (P<0.0001).
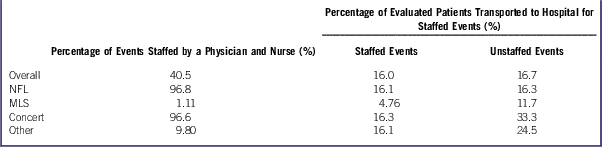
Physicians and nurses were part of the medical staff in just over 40% of all events, including 97% of all NFL games and 96% of all concerts. Overall, there was no significant difference in the rate of transports between events staffed by EMS and first responders only (16.7%) and those events at which physicians and nurses were part of the medical team (15.97%) (Table 6).
Percentage of Events Staffed by Physicians and Nurses, and Percentage of Patients Evaluated and Ultimately Transported to Hospital at Those Events

Abbreviations: NFL, National Football League; MLS, Major League Soccer.
LIMITATIONS
This was a retrospective analysis of data from an electronic documentation system that was employed without research specifically in mind, leading to several missing data points. Whenever possible, researchers entered missing information based on the case narrative. Similar difficulties related to documentation have been reported elsewhere as a persistent problem, despite attempts to standardize the record keeping at mass gathering events.Reference Feldman, Lukins, Verbeek, MacDonald, Burgess and Schwartz 7 , Reference Lund, Turris, Wang, Mui, Lewis and Gutman 13 - Reference Gutman, Lund and Turris 17
The reported attendance numbers for stadium events do not include stadium staff working at the event. Occasionally stadium employees seek medical attention and are included among medical contacts, possibly falsely inflating patient presentation rates. However, the number of staff presenting for medical attention is quite small and we do not believe it significantly affected our results.
There are a number of confounding factors that make comparing patient presentation rate and transport to hospital rate across events challenging. Weather patterns, availability of alcohol, and event duration differ between events. Considering this, displaying patient presentation rate as patients per hour rather than patients per event may be a clearer metric. Unfortunately, event duration was not captured in our current data set.
Gillette Stadium hosts a variety of events with lower attendance throughout the year. However, high variability in attendance and staffing models at these events made this data difficult to interpret in the larger context. As we chose to examine only those events with attendance of ≥10,000, our conclusions may not be generalizable to smaller events or other venues.
DISCUSSION
MGM involves the provision of medical care in unconventional environments under dynamic conditions and for varying durations. Due to the variable nature of mass gathering events, medical planning for each event must be approached individually and in accordance with a number of event-specific factors. The present study describes the on-site medical presentation and transport rates of patrons attending 232 multi-genre mass gathering events of varying attendance at Gillette Stadium over a 6-year period. This data demonstrates that concerts generate the highest patient presentation rates and transport to hospital rates, with NFL football games also generating significantly higher presentation and transport rates than other event types. Postseason NFL games trended towards higher patient presentation and transport to hospital rates, although this trend was not statistically significant. The majority of patient presentations were for minor illness or injury, consistent with previous findings.Reference Locoh-Donou, Guofen, Welcher, Berry, O’Connor and Brady 18 - Reference Milsten, Seaman, Liu, Bissell and Maguire 20
Several factors are likely to contribute to the higher presentation and transport rates at concerts. Previous literature suggests that warm weather, high humidity, alcohol and drug use, unseated and mobile crowds, audience age, crowd density, length of event and the “collective mood” of the audience may all play roles.Reference Feldman, Lukins, Verbeek, MacDonald, Burgess and Schwartz 7 , Reference Grange, Green and Downs 15 , Reference Arbon, Bridgewater and Smith 21 Gillette Stadium holds the majority of its concerts in the summer months, with longer days, higher temperatures and higher humidity than events occurring throughout the rest of the year. Our data did not demonstrate an overall correlation between heat index and patient presentation rate, which differs from previously published research.Reference Milsten, Seaman, Liu, Bissell and Maguire 20 , Reference Perron, Brady, Custalow and Johnson 22 , Reference Michael and Barbera 23 Although seasonal variation in expected temperature is certainly important and must be considered when developing stadium staffing models, the characteristics of the event itself seem to play a more important role.
However, we did note a relationship between heat index and temperature for cold weather events. For events with a heat index of below 40°F, we noted a decrease in transport rate of 21% for every 5°F increase in temperature. It is likely that as temperatures increase, patients are more likely to desire to return to the event. At very cold temperatures, they seem to favor transport to a hospital.
With specific regard to NFL games, patient presentation and transport rates were highest for NFL playoff games followed by NFL regular season games, with NFL preseason games having the lowest rates. No prior studies have made an association between criticality of game (eg, a playoff game compared with a regular season game) and presentation rates. Further analysis would be helpful to understand if this phenomenon and its determinants, particularly the possible impact of any increased stress level of event attendees. In particular, several studies have examined the risk of cardiac events amongst spectators at a variety of venues, although ambiguity still exists.Reference Schwartz, McDonald and Kloner 24 - Reference Marques-Vidal and Paccaud 28 A larger database and further analysis which would clarify a correlation, informing staffing models for more critical or emotionally charged events.
Alcohol consumption and drug use also play a role in presentation and transport rates. Up to 27% of patients treated at concerts admit to alcohol and/or drug use,Reference Erickson, Aks, Koenigsberg, Bunney, Schurgin and Levy 29 and in our data set almost twice as many patients presented for medical attention for intoxication at concerts compared with other event types. Likewise, 1 in 5 patient transports at concerts were for intoxication, as compared to only 7% at NFL games, the next closest event type. This suggests that measures to limit alcohol and drug consumption should be employed during these events. Likewise, presentations and transports for intoxication increased during postseason NFL games, and particular attention should be paid to these events. Several factors contribute to circumstances conducive to higher levels of intoxication, and further review comparing events with varying parking lot opening times (tailgate times), alcohol cut off times, open pit versus closed seating, and other potential safety measures would be valuable.
Unfortunately, we were unable to calculate overall patient presentation rate by gender as we do not collect baseline data for total attendance by gender. However, rates of transport to hospital were higher for males, with 20.3% of patient contacts resulting in transport, as compared with only 13.2% for women. Interestingly, while the presentation rates for intoxication were the same for men and women, women were more likely to be transported for this concern than men. Possible explanations for this discrepancy may be explained by the overall higher alcohol tolerance of the male population.Reference Frezza, di Padova, Pozzato, Terpin, Baraona and Lieber 30 Conversely, while males and females had similar presentation rates for trauma, males were more likely to be transported for traumatic concerns, suggesting more severe injuries in this demographic group.
The existing literature is mixed regarding any advantage of on-site physicians in decreasing transport to hospital rates.Reference Grange, Baumann and Vaezazizi 3 , Reference Lund and Turris 4 , Reference Alquthami and Pines 19 In our analysis, overall rate of transport to hospital did not decrease for events staffed by nurses and physicians. However, it is difficult to draw any definitive conclusions from this particular study, as our staffing model is primarily dictated by event type, and we were unable to appropriately compare events staffed by physicians and nurses to those that were not. While we did not demonstrate an overall decrease in rate of transport to hospital, on-scene physicians may still provide added benefit in the provision of advanced diagnostics, treatment, and improved patient satisfaction. Although we did not look at these metrics in our current analysis, this is a potential area for future investigation.
Ultimately, appropriate staffing models are only a small piece of the overall medical preparedness planning that is required for mass gathering events. Each event must be planned individually and carefully, taking into account the event-specific factors that will affect patient presentation rates and severity. These include expected attendance, population demographics (age, gender, medical co-morbidities, cardiac risk factors, tolerance for alcohol), crowd mobility, event genre, indoor versus outdoor seating, weather conditions (precipitation, temperature, humidity, heat index), presence of alcohol/drug use, and the emotional significance of the event.Reference Milsten, Seaman, Liu, Bissell and Maguire 20 , Reference Locoh-Donou, Yan and Berry 31 Furthermore, extrinsic factors such as the strength of the local health care system, distance to local hospitals and traffic patterns surrounding the event are equally important when considering the number of transports per event.
Finally, the public health burden of mass gathering events on the local community is poorly understood and necessitates study in order to mitigate unintended consequences. As an example, a recent study suggested a negative impact of marathons on health outcomes in cardiac arrest patients located proximal to the event.Reference Jena, Mann, Wedlund and Olenski 32 We would benefit from an understanding of the impacts of mass gathering events on local emergency departments, health care institutions, public safety systems, and community health, aiding in better community preparedness and resilience.
In conclusion, Gillette Stadium, similar to other large-capacity venues hosting multiple events of various types throughout the year, is a logistically complex operation, particularly with regard to medical staffing. Unlike venues hosting events of a singular type, the patient population at Gillette Stadium is dynamic from event to event, which further complicates planning. Weather, gender, event type, and age all play important roles in patient presentation and transport rates. All large-capacity multi-event type venues must have a comprehensive medical response plan, and it is our hope that our analysis, while representative only of our specific mass gathering venue, may be useful in developing response plans and staffing models for similar mass gathering venues.
Authors’ Contribution
E.G., J.M., and M.S.M. conceived the study. M.K. and K.M. provided the data. O.B. provided statistical advice, and S.A.G., J.M. and O.B. oversaw data analysis. S.A.G. and J.M. drafted the manuscript, and all authors contributed substantially to its revision. S.A.G. takes responsibility for the paper as a whole.
Conflicts of Interest
The authors declare that there are no conflicts of interest.