


1. INTRODUCTION
For many years, the Differential Global Navigation Satellite System (DGNSS) technique has been the dominant operational mode for precise positioning for navigation, geoscience and hydrography. The technique requires one or more reference GNSS receivers located at points of known coordinates (Rizos et al., Reference Rizos, Janssen, Roberts and Grinter2012). The positioning accuracy of the DGNSS technique is between 0·2 m and 5 m, changing by using a code or differential-carrier phase with floating-point cycle ambiguities (El-Diasty, Reference El-Diasty2016). Real Time Kinematic (RTK) GNSS employs a method of carrier phase differential GNSS positioning, whereby users can obtain centimetre-level position accuracy in real time (Langley, Reference Langley1998). Both differential and RTK GNSS techniques require at least two GNSS receivers, named as the base and rover receivers. The coordinates of base point are determined by static GNSS measurements, after processing the GNSS data with different software. The limitation of classical RTK techniques is the distance between the base receiver and the rover receiver because of the distance dependent biases, namely orbit, ionosphere and troposphere biases. New techniques have been developed to overcome this limitation using a network of GPS reference stations spread over a wide geographic area (Rizos and Han, Reference Rizos and Han2003). The Network RTK (NRTK) technique has been used in Turkey since 2008 and named as the Continuously Operated Reference System – Turkey (CORS-TR) (or TUSAGA-Active). The horizontal and vertical positioning accuracy is under 3-5 cm (Eren et al., Reference Eren, Uzel, Gülal, Yıldırım and Cingöz2009).
Classical RTK or Differential Global Positioning System (DGPS) methods are already used for special applications by using Ultra High Frequency (UHF) or High Frequency (HF) communications. At least two receivers are necessary in these techniques so that one is fixed on a reference point and the other is on the vessel. Sometimes it is not possible to find any known control point near the shoreline. In this case, new control points have to be established and the coordinates of these points have to be determined before hydrographic surveys. If geodetic satellite positioning techniques are used for this process, the error of the control point coordinates should not exceed 10 cm at 95% confidence level.
Compared to DGPS and RTK systems, PPP has several advantages. The important difference is that the PPP client is completely independent, since no base station or network of base stations is necessary. In addition to this, PPP can save a lot of time, resources and data volumes which usually have to be transferred between reference and rover. There is no need for simultaneous observations and no tight limit in range thanks to globally and regionally valid correction data (Huber et al., Reference Huber, Heuberger, Abart, Karabatic, Weber and Berglez2010).
The Precise Point Positioning (PPP) GNSS technique is of current interest in many scientific applications. PPP is a positioning technique aimed at the processing of measurements from a single GNSS receiver to compute a highly accurate position in a global reference frame which is made available through the International GNSS Service (IGS) orbit/clock combined products (Kouba, Reference Kouba2009; Yiğit, Reference Yiğit2014; Zumberge et al., Reference Zumberge, Heflin, Jefferson, Watkins and Webb1997). Achieving centimetre-level accuracy has required more satellites, good Position Dilution of Precision (PDOP) and other parameters, and more than twenty minutes of GNSS measurements (Alçay et al., Reference Alçay, Yiğit and Ceylan2013). The requirement of a dual-frequency receiver in PPP is for the elimination of the ionospheric effect of GNSS measurements for centimetre-level accuracy (Gao et al., Reference Gao, Zhang and Chen2006).
By means of different software packages and web-based software, the PPP-GNSS method has become useful for processing GNSS data. Magic GNSS by GMV, the Canadian Spatial Reference System (CSRS), Automatic Precise Positioning Service (APPS), Online GPS Processing Service (AUSPOS) and GNSS Analysis and Positioning Software (GAPS) are some examples of online GNSS data processing services. These services are used in academic software, such as Bernese, Gipsy, Gamit, etc. Online services are easy to use for everyone to process GNSS data on the web page. There are various scientific research studies using online services. In this study, the Automatic Precise Point Service (APPS) is selected to process GNSS data collected from seven points near the shoreline in Turkey.
2. PRECISE POINT POSITIONING (PPP) PRINCIPLES
Precise Point Positioning (PPP) has attracted much interest in recent years and has provided an alternative to precise relative processing (Anquela et al., Reference Anquela, Martin, Berné and Padín2013). PPP has been widely demonstrated to be capable of providing accurate position solutions at the sub-centimetre level for static positioning, using a dual-frequency GNSS receiver (Gao et al., Reference Gao, Zhang and Chen2006). The PPP technique has also been developed to potentially provide daily solution estimates with millimetre-level repeatability and accuracy for static positioning (Mohammed et al., Reference Mohammed, Moore, Hill, Bingley and Hansen2016; Yiğit et al., Reference Yiğit, Gikas, Alcay and Ceylan2014).
This technique uses PPP algorithms based on un-differenced carrier phase observations. The IGS combined orbit/clock products come in various flavours, from the Final and Rapid to the Ultra-Rapid. The Ultra-Rapid product, with a latency of only a few hours, should satisfy the more demanding needs of most real-time users (Kouba, Reference Kouba2009).
In the PPP method, the GNSS raw data was collected with a dual-frequency GNSS receiver. This data can be used to generate the so-called ionospheric-free linear combination, which removes the ionospheric error (Mohammed et al., Reference Mohammed, Moore, Hill, Bingley and Hansen2016). The ionospheric-free combinations of dual-frequency GNSS pseudo-range (P) and carrier-phase observations (φ) are related to the user position, clock, troposphere and ambiguity parameters, according to the following simplified observation equations (Kouba, Reference Kouba2009; Kouba and Heroux, Reference Kouba and Héroux2001):
 $$P =\rho +c\lpar dt-dT \rpar +T_{r}+\varepsilon_{P}$$
 $$\Phi =\rho +c\lpar dt-dT \rpar +T_{r}+N\lambda +\varepsilon_{\Phi}$$
where P is the ionosphere-free combination of L1 and L2 pseudo-ranges (2·54P1-1·54P2), Φ is the ionosphere-free combination of L1 and L2 carrier-phases (2·54 Φ 1-1·54 Φ 2), ρ is the geometrical range between satellite (Xs, Ys, Zs) and station (x, y, z), C is the vacuum speed of light, dt is the station clock offset from GPS time, dT is the satellite clock offset from GPS time, T
r
is the signal path delay due to the neutral-atmosphere (primarily the troposphere), λ is the carrier, or carrier-combination wavelength, N is the ambiguity of the carrier-phase ionosphere-free combination and
 $\varepsilon_{{\rm P}}$
,
 $\varepsilon_{\Phi}$
are the relevant measurement noise components, including multipath.
Geometric range ρ is a function of satellite (Xs, Ys, Zs) and station (x, y, z) coordinates according to:
 $$\rho =\sqrt {{(Xs-x)}^{2}+{(Ys-y)}^{2}+{(Zs-z)}^{2}}$$
Expressing the tropospheric path delay (Tr) as a function of the zenith path delay (zpd) and mapping function (M) and removing the known satellite clocks (dT) gives the following mathematical model in the simplest form given below:
 $$f_{P}=\rho +c\, dT+M\ zpd+ \epsilon_{P}- P=0$$
 $$f_{\Phi} =\rho +c\, dT+M\ zpd+N \lambda +\epsilon_{\Phi}- \Phi =0$$
Precise Point Positioning is a developing technique that is the study area of many researchers and scientists. Mohammed et al. (Reference Mohammed, Moore, Hill, Bingley and Hansen2016) examined the achievable repeatability and accuracy from PPP daily solutions when using GPS only (PPP GPS), GLONASS only (PPP GLO), and GPS plus GLONASS (PPP GPS + GLO) for static positioning. In Saka and Alkan (Reference Saka and Alkan2014), precise absolute positioning was introduced for enhancing the positioning accuracy using the dual frequency GPS data collected with only a single geodetic-grade GPS receiver in marine applications. El-Diasty (Reference El-Diasty2016) also used the PPP technique in hydrography. In another study by Van Bree and Tiberius (Reference Van Bree and Tiberius2012), the performance of real-time single-frequency precise point positioning was demonstrated in terms of position accuracy. Geng et al. (Reference Geng, Teferle, Shi, Meng, Dodson and Liu2009) studied ambiguity resolution in PPP with hourly data. Chen and Gao's (Reference Chen and Gao2005) studies investigated PPP using single-frequency data which will be of interest to a broad range of applications, as the majority of GPS users are using single-frequency GPS receivers.
The Global Differential GPS (GDGPS) is a complete, highly accurate, and extremely robust real-time GNSS monitoring and augmentation system. The GDGPS System is driven by a powerful software set, developed completely in-house at the Jet Propulsion Laboratory (JPL), and possessing many unique features and capabilities. The C++ software evolved from one of the world's leading GPS data processing and analysis software packages, JPL's GIPSY-OASIS and its real-time version Real Time Gipsy (https://gipsy-oasis.jpl.nasa.gov/index.php?page=home).
At present, Post-Processed PPP (PP-PPP) offers the most comparable accuracies to DGNSS positioning techniques. Free PPP post-processing services such as Automatic Precise Positioning Service (APPS) provides converged float solutions at the centimetre-level, thereby allowing PPP to offer a viable alternative to post-processed DGNSS solutions (Rizos et al., Reference Rizos, Janssen, Roberts and Grinter2012).
APPS uses GNSS-Inferred Positioning System and Orbit Analysis Simulation Software (GIPSY-OASIS) 6·4 version by the JPL for processing GNSS data. GIPSY-OASIS is used to routinely generate precise estimates of the GPS satellite orbit positions and clock offsets. The latencies of these products vary from <2 hours (near real time) to 14 days. The products of JPL's Precise Orbit and Clock Estimates for GPS Constellation in GIPSY Format are Ultra-Rapid, Rapid and Final. Ultra-Rapid has 5 cm, Rapid has 3·5 cm and Final has 2·5 cm accuracy (https://apps.gdgps.net/apps/apps_index.php).
Current PPP software implementations seem to add large amounts of process noise to ambiguity variances when cycle slips are detected. PPP also requires several corrections to be applied to account for centimetre-level variations in indifference observation biases. In addition, phase wind-up corrections, satellite antenna phase centre corrections, noon and midnight turns, solid earth tide corrections and ocean loading corrections are all necessary for accurate PPP solutions, but not considered for standard DGNSS techniques (Rizos et al., Reference Rizos, Janssen, Roberts and Grinter2012; Kouba and Heroux Reference Kouba and Héroux2001).
3. IHO HYDROGRAPHIC SURVEY STANDARDS
A principal aim of the International Hydrographic Organization (IHO) is to ensure that all the world's seas, oceans and navigable waters are surveyed and charted. IHO Standards for Hydrographic Surveys S44 was published over five editions by the International Hydrographic Bureau (IHB). The first edition of S-44 entitled “Accuracy Standards Recommended for Hydrographic Surveys” was published in January 1968 and the Foreword to which stated that “...hydrographic surveys were classed as those conducted for the purpose of compiling nautical charts generally used by ships” and “The study confined itself to determining the density and precision of measurements necessary to portray the sea bottom and other features sufficiently accurately for navigational purposes” (IHO, 2008). The second edition was published in 1982, the third in 1987 and the fourth in 1998. Throughout these revisions the basic objectives of the publication have remained substantially unchanged and this remains so with the fifth edition. In the S44/4 horizontal control part of chapter 2·2, “Primary shore control points should be located by ground survey methods to a relative accuracy of 1 part in 100,000. When geodetic satellite positioning methods are used to establish such points, the error should not exceed 10 cm at 95% confidence level” (IHO, 1998; Mills, Reference Mills1998).
4. EXPERIMENTAL TEST
The main purpose of this study is to determine the accuracy of the control point coordinates determined with the PP-PPP method near the shoreline in Turkey for hydrographic surveys. For this purpose, the processing of GNSS data of seven test points was carried out by the PP-PPP method in near real-time via the Automatic Precise Positioning Service (APPS).
In hydrographic surveying, the position of the survey vessel must be determined. Classical RTK and the differential GNSS method can be used for determining the position of the survey vessel. As stated above, for determining the coordinates of a point with these methods, at least two receivers are necessary. One of the receivers is set up on the control point, so the coordinates of this control point should be determined before hydrographic surveying. Normally, the control points are established and their coordinates are determined before the survey by GNSS or terrestrial measurements. Determining the coordinates of control points with classical GNSS methods or terrestrial surveying methods is a time consuming and costly process. In this study, the PP-PPP technique was used for determining the coordinates of control points to overcome this.
Turkey has complete coverage by the CORS-TR or TUSAGA-Active network which currently has 150 reference stations (four of them are in North Cyprus) for 24/7 RTK positioning applications, geodetic/cadastral surveys, research modelling the atmosphere, monitoring plate tectonics, earthquake prediction early warning systems and Geographical Information System (GIS) applications, etc (Gülal et al., Reference Gülal, Erdoğan and Tiryakioğlu2013) in the ITRF96 datum and 2005·0 epoch (Figure 1). For this study. the GNSS data were collected by Trimble NETR5 GPS receivers and TRM55971·00 antennae in the CORS-TR network at a 30 second data interval.
CORS-TR (TUSAGA-Active) network of Turkey.

In this study, seven test points which are located near the sea are selected from the CORS-TR network points. Coordinates and velocities of these points are known in ITRF96 datum and the 2005·0 epoch (Table 1). Three are located near the Black Sea, named as KARB, SINP and RZE1. Two of them are near the Aegean Sea named as AYVL and DATC. FINI and ANMU points are near the Mediterranean Sea (Figure 2).
Locations of test points.

Cartesian coordinates and velocities of control points (ITRF96, 2005·0epoch).

GNSS data of ANMU, AYVL, DATC, FINI, KARB, RZE1 and SINP network points were used between 30 October 2016 (DOY:303) and 8 November 2016 (DOY: 313) with ten days repeatability. The GNSS data of all points were divided into periods of one, two, three, four and six hours duration by using Translation Editing Quality Check (TEQC) software. One-hour to six-hour dual frequency observation data for three days was uploaded to the APPS service via the web page (http://apps.gdgps.net/) and static processing mode was selected for determining the coordinates. A 10° elevation mask was selected and Ultra-Rapid JPL combined orbit/clock products were used at the processing stage. The coordinates of these test points were calculated in the ITRF2008 datum by 2016·83, 2016·84 and 2016·85 epochs. ITRF96 to ITRF2008 conversions of the coordinates were processed by using the known coordinates and the velocity of the points given in Table 1.
The processing results obtained by APPS were at the observation epoch. These Cartesian coordinates were compared with the known coordinates of the control points. First, coordinate differences were calculated at the same ITRFyy datum and at the same observa-tion epoch. The positioning error of a point was calculated with the equation given below:
 $$\sigma = \sqrt {dX^{2}+{dY}^{2}+{dZ}^{2}}$$
The positioning errors of the test points were calculated for all time periods with ten days repeatability. The results of 304, 305, 306, 307, 308, 309, 310, 311, 312 and 313 DOY of GNSS data of 2016 year given below.
At the ANMU point, maximum positioning error was determined as 9·59 cm for a one hour period GNSS data in day 306 of GPS. The positioning error changes between 0·54 cm and 9·59 cm for one hour period given in Table 2. For two hours, maximum error is 5·62 cm in day 306.
The point positioning error (cm) of point ANMU.

At the AYVL point, the positioning error was determined as between 2·38 cm to 8·61 cm over a one hour period. Over two hours the minimum value is 0·62 cm and the maximum value was 3·48 cm (Table 3).
The point positioning error (cm) of point AYVL.

The maximum positioning error at the DATC point is 12 cm for a one hour period. The other results are higher values and maximum error for the six hour data period is 4·98 cm seen in Table 4. Root Mean Square (RMS) values for the Linear Combination (LC) of phase measurement residuals of DATC station is about 13·62 mm as found in a different study (Özdemir, Reference Özdemir2016). Values between 10 mm and 15 mm are high but are acceptable but can affect the PP-PPP processing results. The DATC test point is a ground point and it can be seen in Figure 3 that there is a building and a wall close by the point.
DATC test point.

The point positioning error (cm) of point DATC.

At the FINI point, the positioning error is under 9 cm for the one hour period. The maximum error is 3·08 cm for the two hour data collecting period on DOY 306. The other results are given in Table 5.
The positioning error (cm) of point FINI.

The positioning error is a maximum 7·77 cm for one hour data at the KARB point near the Black Sea. The other values are between 0·15 cm and 1·85 cm for the two to six hour data collecting periods (Table 6).
The point positioning error (cm) of point KARB.

Maximum error is about 10 cm for a one hour period at point RZE1. The error values for two hours change between 1·65 cm and 5·38 cm. The maximum error is 4·92 cm over a three hour period (Table 7). Similar to the DATC station, RZE1 station has a 12·22 mm RMS of LC measurement phase residuals (Özdemir, Reference Özdemir2016). This can affect the PP-PPP processing results.
The point positioning error (cm) of point RZE1.

The maximum positioning error at point SINP is 7·90 cm over a one hour period. The other results are between 0·31 cm and 3·38 cm and can be seen at Table 8.
The point positioning error (cm) of point SINP.

It can be seen from Table 9 that the positioning error has decreased from one hour data to six hour data. For one hour data, all test points have an error under 10 cm. For two hour data, ANMU, AYVL, FINI, KARB and SNP test points have fewer errors than for one hour data. But, DATC test point has 4·87 cm error in two hour period. When the processing time is increased, the positioning errors are decreased. Error values of the DATC test point are more than the error values of other points, but the positioning error of the DATC test point is less than 10 cm. The positioning error of the control points are given in cm in Figure 4.
The positioning errors of control points.

Mean positioning errors (cm).

The mean values of positioning errors of all GNSS processing results are given in Table 9. The maximum mean error for a one hour period is 6·79 cm at the DATC point. The others vary between 5·87 cm and 3·90 cm over an hour data collecting period. It should not be forgotten that these results are determined by the Ultra-Rapid IGS orbit/clocks used.
In Table 10, mean positioning errors of the seven test points at centimetre level, depending on the observation periods, are given. In Figure 5, these mean positioning errors are illustrated and it can be seen that the errors are under the IHO S44 hydrographic survey standards available in Turkey.
The mean positioning error (cm) of 7 test points.

Mean positioning errors of seven test points.
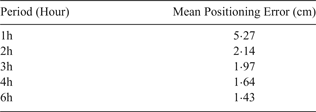
It can be said that the PPP results for one hour data accuracy meet IHO hydrographic survey standards, but it is clear that two hour GPS data is suitable for determining the coordinates of test points.
5. CONCLUSIONS
Precise Point Processing (PPP) has become a more practical and favoured method, as opposed to other positioning methods because of the processing procedure. Online processing tools are more user-friendly than other academic GNSS processing software.
In this study, seven different test points were selected from the CORS-TR network stations near the shoreline. The positioning error was determined and examined. The results showed the positioning error of one hour GNSS data with the PP-PPP technique met IHO S44 survey standards. However, two hour data showed better accuracy than the one hour solution. If the GNSS data collecting time is much longer, the accuracy gets better, as can be seen in Figure 5. From this point, it can be said that PP-PPP near real-time with Ultra-Rapid orbits/clocks is usable for determining control point coordinates under IHO S44 hydrographic survey standards.
It is our opinion that PPP is going to displace the other positioning methods such as RTK and DGNSS methods in the near future, removing the need for control points for hydrographic surveys.
ACKNOWLEDGMENTS
The authors wish to acknowledge the General Directorate of Land Registry and Cadastre for obtaining GNSS data from CORS-TR stations and the Automatic Precise Processing Service (APPS) and Jet Propulsion Laboratory for processing the GNSS data.



