1. Introduction
Recent empirical studies show that mining can have positive effects on local economies. The opening or expansion of a mine might, through a local demand shock, increase wages and employment in the extractive sector, and have contagious effects in other sectors such as manufacturing or services (Michaels, Reference Michaels2011; Jacobsen and Parker, Reference Jacobsen and Parker2016; Kotsadam and Tolonen, Reference Kotsadam and Tolonen2016). In particular, the study by Aragón and Rud (Reference Aragón and Rud2013) (hereinafter, AR), has become a point of reference in local resource curse scholarship, attributing major local effects to the ‘backward linkages’ generated by the Yanacocha mine in what is an impoverished region of the world economy. Located around 50 kilometers (km) outside the city of Cajamarca in the northern Andes of Peru, the Yanacocha gold mine was one of the largest in the world during its years of peak production. But if mining booms generate positive local effects, it follows that busts stand to do the opposite (Kotsadam and Tolonen, Reference Kotsadam and Tolonen2016; Allcott and Keniston, Reference Allcott and Keniston2018; Aragón et al., Reference Aragón, Rud and Toews2018). What lessons can be drawn from the Yanacocha case? Is the fostering of linkages the ‘silver bullet’ that transforms a resource curse into a blessing? By addressing this case, we contribute to the extensive literature on the phenomenon of the local resource curse (Cust and Poelhekke, Reference Cust and Poelhekke2015; Van der Ploeg and Poelhekke, Reference Van Der Ploeg and Poelhekke2017; Manzano and Gutiérrez, Reference Manzano and Gutiérrez2019). First, local economic effects in the nearby city of Cajamarca are time dependent, and second, we observe mere consumption effects rather than backward production linkages per se.
In this study, we discuss two key aspects related to the economics of non-renewable natural resources: the sustainability of economic growth and the generation of linkages with the local economy. Sustainability is fundamental to this area of study. If the rent resulting from non-renewable resource extraction is not allocated to a given form of capital investment, it will bring about impoverishing growth: the transformation of capital stock into short-run income and consumption flows (Hartwick, Reference Hartwick1977; Solow, Reference Solow1986; Atkinson and Hamilton, Reference Atkinson and Hamilton2003; Humphreys et al., Reference Humphreys, Sachs and Stiglitz2007). The issue of linkages is also complex. In his classic The Strategy of Economic Development, Hirschman (Reference Hirschman1958) observed that export-oriented staples generally did little to promote direct linkages – whether backward (in which local inputs are in demand) or forward (in which local inputs are supplied) – with the nearby economy, and that this phenomenon lay behind the unpopularity of mines, wells and plantations in developing economies. It is our contention that the question of the sustainability of economic growth relates to the question of linkages. Prospects for local sustainable development are good if, in one way or another, mining generates ‘the needed kind of linkages,’ by which we refer loosely to mine-driven economic transactions of the kind that create knowledge, coordination and other spillover effects (Hoff and Stiglitz, Reference Hoff, Stiglitz, Meier and Stiglitz2001; Rodrik, Reference Rodrik2004, Reference Rodrik, Aghion and Durlauf2005; Hausmann et al., Reference Hausmann, Hwang and Rodrik2007). Thus, we hope to advance the resource curse debate by gaining new insights into both the temporality of local effects and the linkage mechanisms at play at major mines.
Specifically, we seek to conduct a nuanced analysis of the local development experience associated with the Yanacocha mine. First, by showing that local effects depend on this mine's production cycle, we underline how analyzing the local economic impacts of extractive industries is contingent on sampled time. In this respect, we depart from the local resource curse literature on Peru, which thus far has focused on the period 1993–2007, the boom years (Arellano-Yanguas, Reference Arellano-Yanguas2011; Aragón and Rud, Reference Aragón and Rud2013; Ticci and Escobal, Reference Ticci and Escobal2015; Loayza and Rigolini, Reference Loayza and Rigolini2016; Orihuela et al., Reference Orihuela, Pérez and Huaroto2019). Second, by stressing that there is no evidence of meaningful (backward or forward) production linkages with the local economy, we contribute to a discussion on the ‘breadth and depth’ of mine-driven effects and linkages, and the role that policies and institutions might play in avoiding the enclave trap (Morris et al., Reference Morris, Kaplinsky and Kaplan2012; Arias et al., Reference Arias, Atienza and Cademartori2014; Phelps et al., Reference Phelps, Atienza and Arias2015; Atienza et al., Reference Atienza, Aroca, Stimson and Stough2016; Orihuela, Reference Orihuela2018). In this regard, we show that the local unskilled service sector expanded with the mine cycle, while local manufactures did not benefit.
Our assessment of the Yanacocha case problematizes local effects and the associated linkage quality of economic development, and differs from that of AR largely in terms of both the time period and the data sources sampled. First, to analyze the persistence of local effects we draw on AR's identification strategy, a difference-in-differences approach that involves exploiting mine production as a measure of a mine's activity. One drawback of AR is that they use 1997–2006 annual household survey data, and so do not factor in the mine's steadily declining production and eventual depletion between 2006 and 2017. In our specification, we extend the period of analysis by 10 years to exploit the spatial and temporal variation in the mine's activity (boom and bust periods), identifying households close to the city of Cajamarca (less than 100 km) as treated and comparing them to households farther away from the city (more than 100 km). AR find that a 10 per cent increase in the mine's activityFootnote 1 is associated with a 2.5 per cent increase in real income, in addition to further positive economic development impacts. We validate AR's results for the boom years, 1997–2006, and find a statistically significant drop of 1.9 per cent in real income for 2007–2016 for the same increase in gold production. In turn, household consumption increased by 1.9 per cent during the boom period and decreased by 1.8 per cent during the bust years, associated with a 10 per cent increase in mine production. The same is true for most of the tested development indicators. To be sure, local effects do not altogether disappear; rather, they display a cyclical character.
Second, we explore whether it is correct to refer to ‘backward linkages’ as the mechanism underlying local effects, with the aid of 1993, 2007 and 2017 population census data. Because we found national production census data to be of poor quality, we opted to analyze population censuses only. By exploiting the spatial and temporal variation in the population census data, we estimate the effect of the mine on production structure and employment. Specifically, we develop a second difference-in-differences specification, tracing the effects in 1993–2007 and 2007–2017 and comparing the city of Cajamarca with a sample of districts located at a distance from the city. The years in which the population censuses were conducted prove very helpful to the analysis: Yanacocha produced its first gold bar in 1993, gold production was at its peak in 2007, and the mine had been depleted by 2017. Our analysis shows that there is an increase in the share of the unskilled services sector (which includes transport, commerce, lodging and restaurants) as well as a fall in employment in the local manufacturing sector. Therefore, we conclude that it is more appropriate to refer to income shock (which might be described as ‘unskilled service linkages’) than to backward linkages as the underlying mechanism.
Furthermore, drawing on Molina (Reference Molina2018) and Kuramoto (Reference Kuramoto1999), we know that while some backward linkages with Yanacocha exist, these have mostly been established with firms located in Lima – the capital city with its 10 million inhabitants, one-third of the country's overall population – rather than with firms in the city of Cajamarca, whose population is below 200,000. Other studies have also found this to be the case of mineral-abundant Antofagasta in Chile, whose mines link mostly with Santiago-based firms (Arias et al., Reference Arias, Atienza and Cademartori2014; Phelps et al., Reference Phelps, Atienza and Arias2015; Atienza et al., Reference Atienza, Aroca, Stimson and Stough2016). In sum, by talking of income or consumption shocks rather than backward local linkages, we stress the non-productive quality of local economic effects, the apparent absence of significant learning and coordination spillovers, and the reinforcing effects of the income shock on the cyclical character of local economic development.
The remainder of the article is organized as follows. In section 2 we introduce the case of the Yanacocha mine, while in section 3 we set out the analytical framework. In section 4 we present the data and empirical strategy, in section 5 we discuss the main results related to local effects, and in section 6 we inquire whether there is evidence of backward linkages. Finally, in section 7 we conclude by highlighting the sustainability challenges to local economic development posed by natural resource extraction.
2. The Yanacocha gold mine
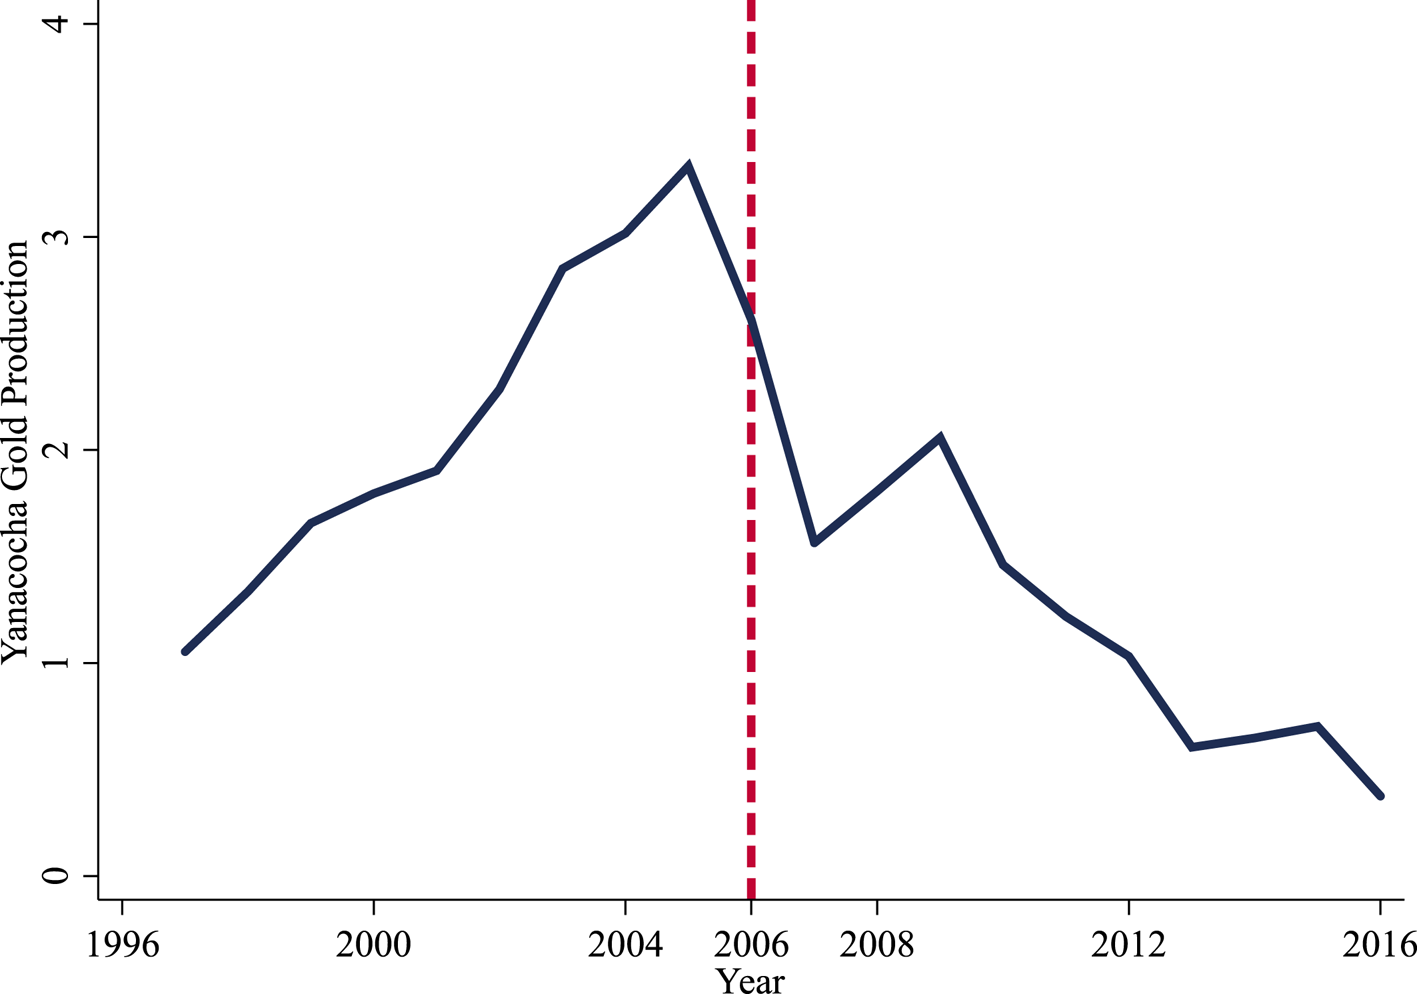
Peru's economy is based primarily on natural resources and its territory is ecologically diverse. The country's modern economic history is one of boom-and-bust commodity cycles involving different staples and sites. In addition, there are local resource economies distributed throughout the country in spatially differentiated ways (Thorp and Bertram, Reference Thorp and Bertram1978; Orihuela and Gamarra, Reference Orihuela and Gamarra2019). Gold cycles, in particular, are long-established in the northern Andes – Cajamarca has been producing gold since (pre-)colonial times (Thorp and Bertram, Reference Thorp and Bertram1978; Contreras, Reference Contreras1995) – and southern Amazonia. However, the large-scale ‘new mining’ that emerged with the 1990s liberalization began with Yanacocha. By 2006, it was the second largest gold mine in the world, producing around 45 per cent of Peruvian gold exports. But, as figure 1 shows, Yanacocha's production started to dwindle in the second half of the 2000s, and by 2016 Barrick Misquichilca (in the neighboring region of La Libertad) had displaced it as the country's largest gold mine.
Yanacocha gold production.

Yanacocha is only 48 km away from Cajamarca city, the capital of the region of the same name. The mine's workforce is composed of skilled workers (hired directly) and low-skilled workers (employed indirectly, through service contractors). Yanacocha originally developed a city–mining relationship system that, within the Peruvian context, was innovative for its time. While mining operations in Peru would traditionally establish satellite towns or mining camps for their workers, Yanacocha preferred to invest in roadbuilding to improve links with Cajamarca, allowing the city to serve as both its dormitory and its kitchen (Kuramoto, Reference Kuramoto1999; Vega-Centeno, Reference Vega-Centeno2011).
Cajamarca is the poorest region in Peru, with almost 50 per cent of the population below the poverty line (compared to 21 per cent nationwide). In 2016, almost 50 per cent of the region's inhabitants lived in rural areas, and 70 per cent of its total population worked in agriculture, which hints at the complexities of the local political economy. This backdrop of inequality and poverty in Yanacocha's host economy, along with the scale of the mine's industrial operations, its environmental impacts (which included a major mercury spill) and the concerns these triggered, and its overall influence on local and national politics of development, assured it considerable political visibility (Bury, Reference Bury2005; Triscritti, Reference Triscritti2013). The shareholders of Yanacocha were the US-based Newmont Mining Corporation, the Peruvian-owned Buenaventura, and the International Finance Corporation (IFC), a member of the World Bank Group dedicated to promoting private enterprise in developing countries. But as well as being a shareholder, IFC was also Newmont's main lender for the project (Jenkins et al., Reference Jenkins, Ishikawa, Barthes and Giacomelli2008; Aragón and Rud, Reference Aragón and Rud2013).
Yanacocha was virtually the first large operation in a mining country to arise out of a major structural reform program, and this salience, coupled with its location in a very poor agricultural region, prompted the IFC to take special interest in developing a local procurement policy with the explicit purpose of minimizing the risk of conflict with the local population (Jenkins et al., Reference Jenkins, Ishikawa, Barthes and Giacomelli2008; Aragón and Rud, Reference Aragón and Rud2013). This procurement policy, introduced by Yanacocha in the late 1990s following its expansion, encouraged local suppliers to hire local workers (Aragón and Rud, Reference Aragón and Rud2013: 5) for ‘non-critical services intensive in unskilled labor’ (Aragón and Rud, Reference Aragón and Rud2013: 3).
AR argue that Yanacocha's procurement policy increased backward linkages with the local economy. The authors explain that Yanacocha had little economic interaction with the regional economy during its first years of operation, as at that time the number of workers hired by the mine was small and few inputs were purchased locally (Kuramoto, Reference Kuramoto1999). However, AR maintain, the aforementioned introduction of the local procurement policy prompted a change in this trend. We are unable to explore in detail what exactly ‘local procurement’ entails in this instance, since no data is publicly available; in particular, we have no way of disentangling local procurement from gold production as treatments. Our statistical analysis is therefore based on the mine's gold production and does not take into account local procurement practices. But what can be asserted, based on the evidence collected by AR, is that the amount spent on the procurement policy is highly correlated with gold production.
3. Analytical framework
3.1 A general equilibrium framework for evaluating local effects
The local development experience related to Yanacocha can be analyzed with the help of a general equilibrium framework. AR adapt the model proposed by Moretti (Reference Moretti2010, Reference Moretti, Ashenfelter and Card2011), and treat a mining boom as a positive shock to local labor demand in the presence of imperfect worker mobility. Specifically, AR define the nearby city of Cajamarca as the treated local economy. Thus, AR define the local communities in relation to Yanacocha as the 120,00 people living in the city of Cajamarca and the adjacent area, rather than the rural area surrounding the mine, and we follow suit in our replication and extension analysis. Accordingly, we compare the mine's impacts on the city and its hinterland (within 100 km) with those in rural districts farther away (more than 100 km). In light of the rural character of the Andean host economy, as described in the previous section, it is very important to bear in mind when drawing lessons about how mining impacts ‘local communities’ that our evaluation is city-centered.
The general equilibrium framework assumes two competitive local economies that use labor-creating goods traded nationally (in our case, for instance, gold and manufactures) and non-traded goods (services, housing, agriculture traded in the domestic economy). In this framework, a positive demand shock – that is, the increase in mine production – leads to a rise in local purchases, driving the increase in both nominal wages in the local economy and the prices of locally-produced goods in the city of Cajamarca and the surrounding area (within 100 km), in comparison to the rural areas located farther away (more than 100 km). Because Yanacocha's production and its local procurement policy attract unskilled services, the direct nominal wage increase takes place in the unskilled service sector of the city. Thus, to the extent that there is mobility between sectors, the wages of workers employed in other sectors will rise, while the overall increase in local income will lead to a rise in the prices of non-traded goods: a local blessing. These constitute the core postulates of AR.
But what of the effect of increased mine production on other tradable industries, such as manufactures? AR do not engage in this discussion. Under Moretti's (Reference Moretti2010) framework, the way in which a mining boom will affect a city's manufactures is, in principle, unclear. On the one hand, citywide wage rises will curb the production costs of manufactures, while manufacture prices are not locally determined.Footnote 2 Therefore, the framework will predict crowding out effects of local manufactures – in essence, a local version of the Dutch disease (Corden and Neary, Reference Corden and Neary1982). On the other hand, the opening of a large gold mine may increase local demand for manufactures, depending on the geography of the industry supply chain. In conjunction, the new gold mine may result in greater local agglomeration, a virtuous circle for local multipliers that prompts varied industrial development. The net effect of a mining boom on manufactures, therefore, depends on interindustry multipliers and agglomeration economies being big enough to counteract the crowding-out effects of increased wages and local production costs more broadly (Bjørnland and Thorsrud, Reference Bjørnland and Thorsrud2016; Allcott and Keniston, Reference Allcott and Keniston2018).
We find that the aforementioned general equilibrium framework aids us in the pursuit of our research goals – to improve understanding of the sustainability or, rather, pro-cyclicality of local effects, as well as the ways in which they entail production linkages – while also helping to organize the discussion. If a mining boom constitutes a positive demand shock in the tradable sector, a mining bust will mean the opposite: in our case, the framework will predict cyclical effects in the city of Cajamarca, as a mine's life cycle will cover two subsequent demand shocks rather than one alone. Net demand effects during a bust, as explored by Kotsadam and Tolonen (Reference Kotsadam and Tolonen2016) and Aragón et al. (Reference Aragón, Rud and Toews2018), will depend on interindustry multipliers, agglomeration economies and the depth of the bust, among other factors. In particular, the Yanacocha bust that started in 2007 was smoothed by the gold price surge, which continued until 2012 (see figure A1 in the online appendix).
With regard to the ways in which the development experience involves linkages, Moretti (Reference Moretti2010, Reference Moretti, Ashenfelter and Card2011) notes that general equilibrium effects are largely contingent on the size of interindustry multipliers. In fact, Moretti's (Reference Moretti2010) initial study shows that local effects in the non-tradable sector are significantly higher for skilled jobs and, more broadly, that local multipliers are likely to vary across industries and skill groups. In other words, the very general equilibrium framework that is pivotal for the study of Yanacocha suggests that the quality of linkages matters because interindustry multipliers are not all the same. But before going any further, at this point it is worth being more explicit about what we mean by linkages.
3.2 Semantics of linkages
Linkages were long thought of as a remedy for underdevelopment. Singer (Reference Singer1950) pointed to the enclave nature of commodities production, while Innis (Reference Innis1956) contended that manufacturing development in Canada was in fact stimulated by staples. In turn, it has been argued that the ‘dependent development’ observed in Latin American political economies could have different configurations, from the (colonial) enclave model to industrial poles articulated with the domestic economy (Cardoso and Faletto, Reference Cardoso and Faletto1970). Which approach is correct? As the recent empirical literature illustrates, extractive industry experiences can resemble model enclaves as well as configurations that are more auspicious in terms of diversification (Morris et al., Reference Morris, Kaplinsky and Kaplan2012; Phelps et al., Reference Phelps, Atienza and Arias2015; Atienza et al., Reference Atienza, Aroca, Stimson and Stough2016). The difference between enclave and diversification seems to boil down to ‘linkages,’ but what exactly are they?
By introducing the concepts of backward and forward linkages, Hirschman had ‘industry and industrialization primarily in mind.’ However, drawing from the ‘staple thesis’ of Canadian economic historians, he proposed that the concept could also be applied to primary production (Hirschman, Reference Hirschman1958, Reference Hirschman1981). Focusing on the income dimension, he later labeled consumption linkage ‘the somewhat roundabout mechanism through which certain import-substituting industries are called into life by the staple,’ subsuming forward and backward linkages into the concept of ‘production linkage’ (Hirschman, Reference Hirschman1981). Similarly, fiscal linkage, which results from the primary industry taxes that enable government expenditure, was another indirect way in which commodities could generate changes in production: government expenditure funded by staples could ‘irrigate’ economic development elsewhere. Taking Hirschman's (Reference Hirschman1981) lead, we conceptualize linkages as the direct and indirect productive relationships with the domestic economy that an economic activity creates.
Given that Yanacocha initiated a local procurement policy, AR suggest that backward linkages are the mechanism underlying the local effects produced by the mine. We do not entirely agree with this interpretation. First, in the short term, mine production can generate both Hirschmanist backward production linkages and straightforward income and consumption shock effects. Second, the available evidence on Yanacocha's local procurement policy points fundamentally to market relationships of a non-productive nature: subcontracted unskilled services and demand for locally supplied inputs, whether imported or actually produced locally. Put together, these effects do not seem to make the case for either direct (associated with backward linkages) or indirect (associated with consumption and fiscal linkages) productive transformation. Third, depending upon the magnitude of the mine's impact, even the existence of backward linkages might not be good enough in the long term, because the quality of linkages matters: there may be production linkages that are entirely dependent on the mine, on the one hand, and backward linkages that ultimately lead to new economic development, on the other. The former type of linkage will disappear with the bust. Contemporary development economics stresses learning, as well as the coordination spillover effects of economic growth in general and of industrial change in particular (Hoff and Stiglitz, Reference Hoff, Stiglitz, Meier and Stiglitz2001; Rodrik, Reference Rodrik2004, Reference Rodrik, Aghion and Durlauf2005; Hausmann et al., Reference Hausmann, Hwang and Rodrik2007). In turn, resource development studies argue that the quality of linkage development matters for diversification and that public policy and institutions can play an important role in fostering their breadth and depth (Bloch and Owusu, Reference Bloch and Owusu2012; Morris et al., Reference Morris, Kaplinsky and Kaplan2012; Orihuela, Reference Orihuela2018).
In sum, although we employ AR's general equilibrium framework, our interpretation of the mechanisms underlying the predicted effects differs. We contend that it is more conceptually accurate to speak of backward linkages only in cases of economic exchanges with manufactures and skilled services. While linkages and their effects are varied and complex, it is problematic to treat backward linkages and typical income/consumption shocks as synonymous. Therefore, if the multipliers linking a mine with manufactures and skilled services are small, weak backward linkages should be inferred. Conversely, if backward linkages are strong, there will be an increase in the labor force in the manufacturing and skilled service sectors, associated with high interindustry multipliers. The increase in the non-qualified labor force that occurs with the crowding out of local manufactures resembles the enclave model posited by Hirschman (Reference Hirschman1958). Overall, the likelihood of local sustainable development is higher when proper (backward, consumption or fiscal) linkages occur rather than short-term income/consumption shocks.
Now, having examined the concepts related to linkages, we employ AR's general equilibrium framework (but for a complete boom-and-bust cycle) and expect to find the following:
• For the duration of the positive demand shock, positive effects in nominal income, real income and the related economic development indicators will be observed in the city of Cajamarca and its immediate surrounding areas, because the large Yanacocha mine rents housing and subcontracts unskilled services there. Conversely, during the bust, the exogenous negative demand shock will counteract the positive impacts. The net effect is indeterminate, and will depend on interindustry multipliers, agglomeration economies and the depth of the bust.
• In the presence of strong backward linkages, an increase in skilled services and manufacturing employment will be observed, which might give rise to knowledge and coordination spillover effects and thus to local development that outlasts the mine cycle. In the presence of weak backward linkages, only an increase in unskilled services will be observed, but this will fade with the bust.
4. Data and methods
4.1 Data and main variables
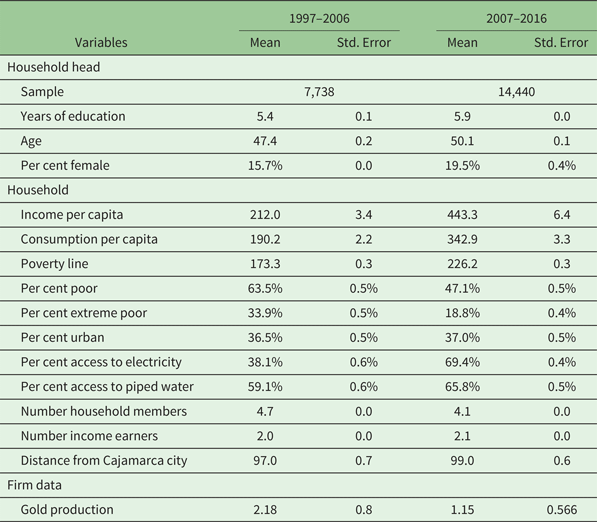
We use several datasets for our analysis. Our first main specification uses repeated cross sections of the Peruvian National Household Survey (ENAHO), which covers 22,178 households distributed across 171 districts for the period 1997–2016, and in so doing we extend AR's original analysis (1997–2006) by 10 years. The main outcome variable is income but, as with AR, we perform impact evaluations on other indicators of household welfare (such as consumption, poverty, sickness and local prices); all this is presented in the online appendix because of space constraints. Our other data source is the Ministry of Energy and Mining's yearly information about mining production. Table 1 presents summary statistics of the main variables and other controls.
Summary statistics of household survey data

Notes: The mean and its standard error are calculated using sample weights and clustered by primary sampling unit. Income, consumption, and poverty line are measured in Peruvian soles. Gold production produced is measured in millions of ounces. In the first period of analysis, the average exchange rate was US$1 = 3.2 soles, while during the second period the average rate was 3.1 soles to the dollar.
Our treatment is the same as that of AR: households located within 100 km of the city of Cajamarca. In turn, our control group is composed of households located more than 100 km away. To measure the activity of the mine, we utilize data on Yanacocha's gold production, measured in ounces. The other indicators of the mine's activity that AR use, such as demand for local inputs and the number of workers, are not publicly available, so we only take into account mine production.
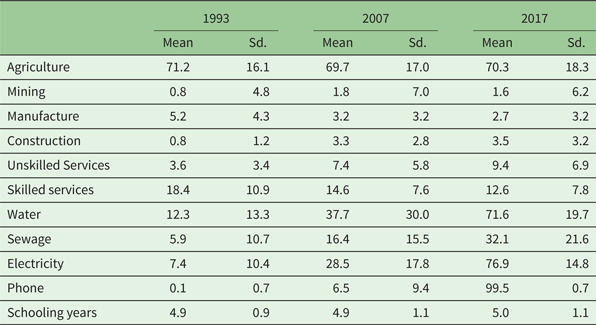
For our second econometric strategy tracing linkage formation, we use population censuses, given that the industrial census data is subject to certain shortcomings.Footnote 3 Population censuses make for a suitable alternative because they enable mapping of the sectoral composition of employment, in addition to the number of employed workers. Moreover, population censuses were conducted in 1993, 2007 and 2017, which allows for a quasi-experimental setup. Table 2 presents the summary statistics. As can be seen, agriculture was the main activity over the last 25 years, representing 70 per cent of the occupied population on average. Most significantly for our discussion, manufacturing and skilled services decreased their share over the years, while that of construction and unskilled services increased. Mining employment, as can be expected, increased slightly during the boom period and decreased marginally during the bust. This preliminary breakdown of the data is quite revealing about the possibilities of linkage formation around Yanacocha.
Summary statistics of population census data

Notes: Measurements of sectorial shares are based on population, while measurements of access to basic services and years of schooling are based on households.
Source: Population and housing censuses (INEI).
4.2 Identification strategy for estimation of local effects
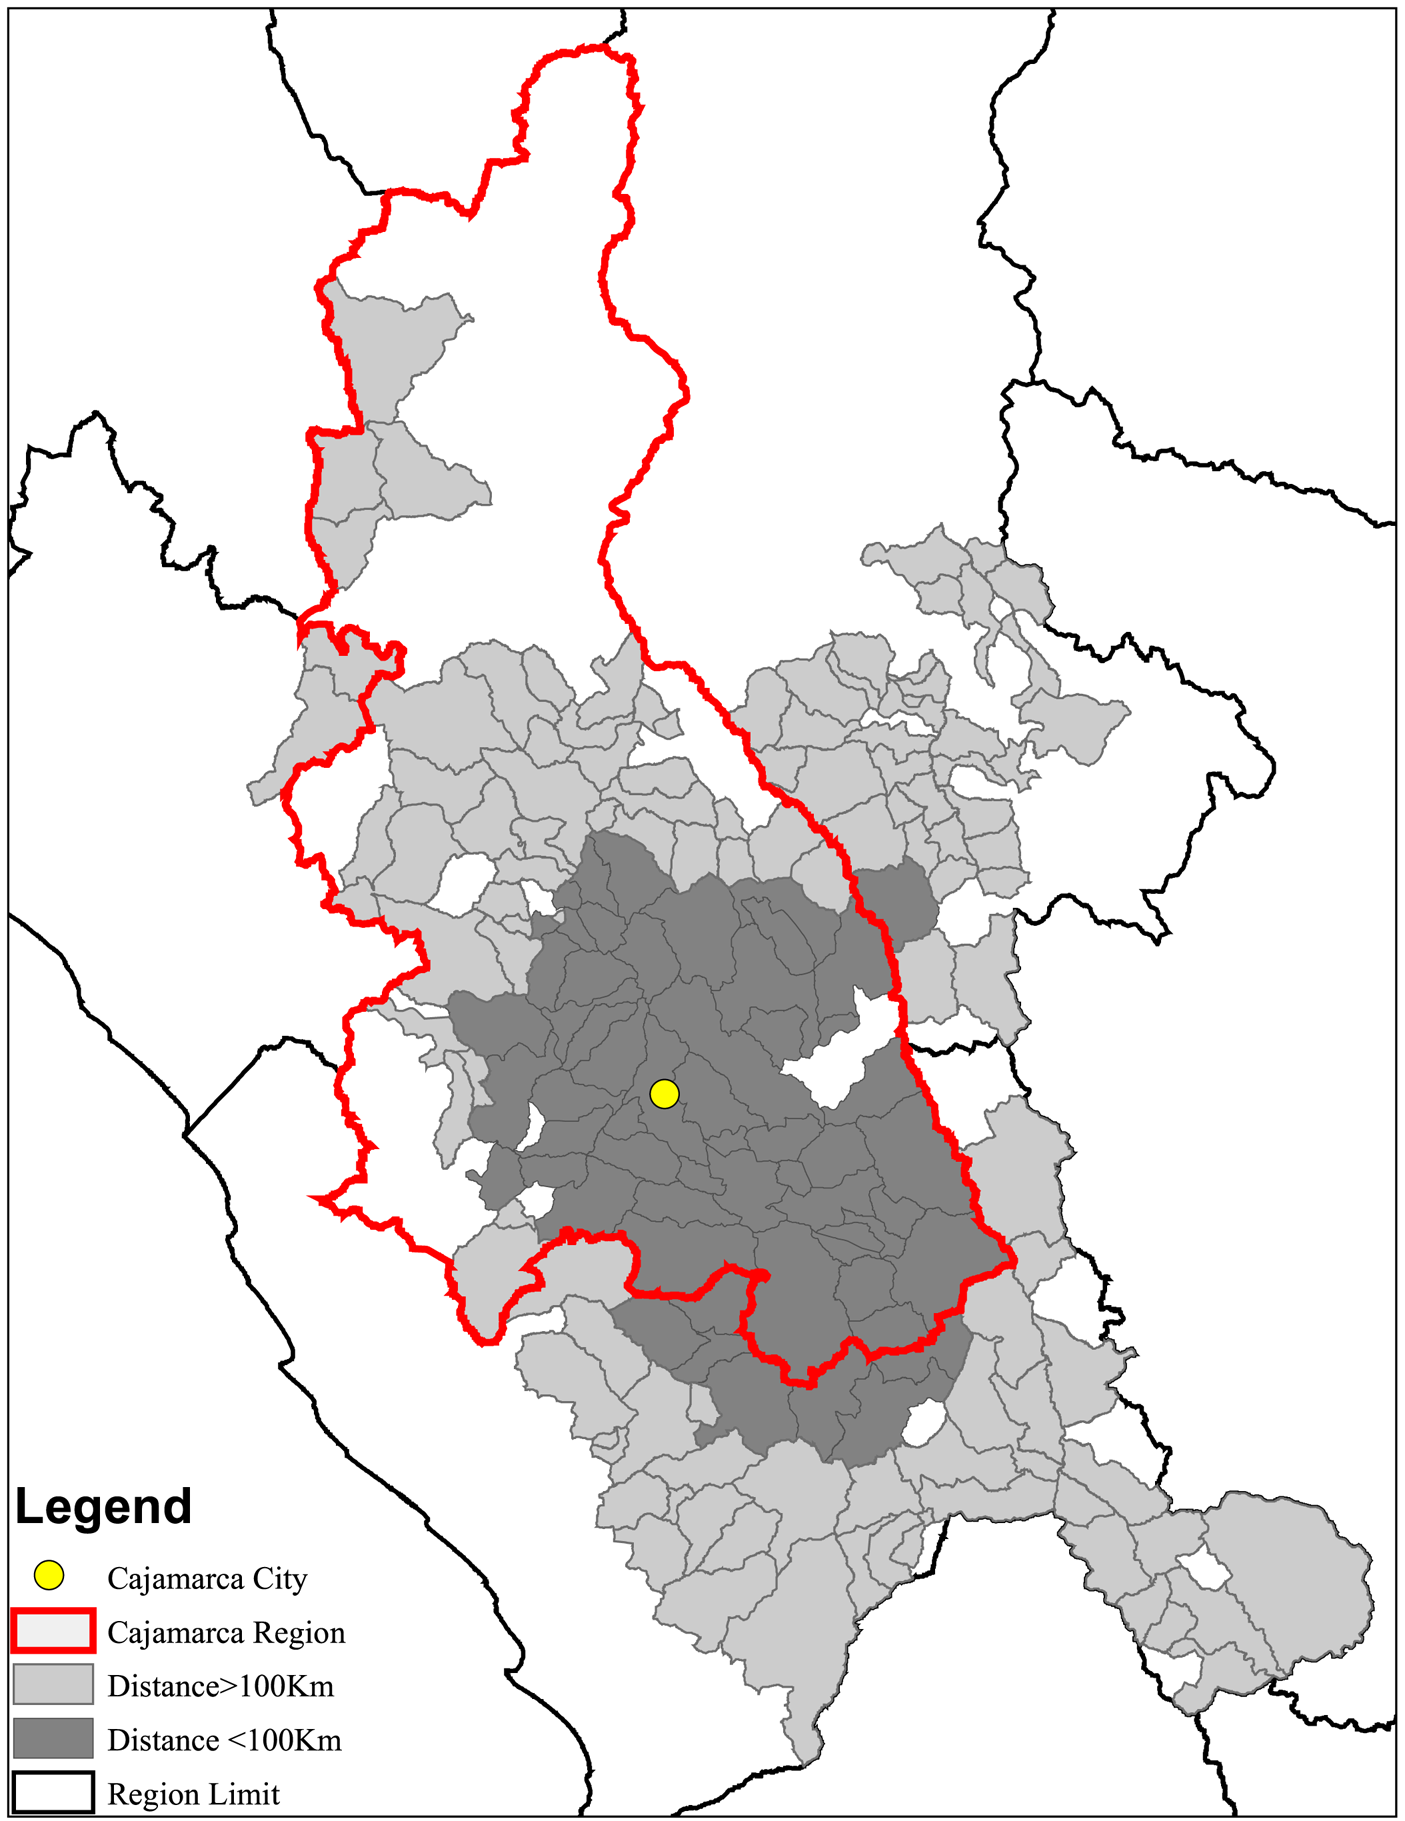
We replicate AR's identification strategy for the 1997–2016 national household survey data, using a difference-in-differences procedure in which we employ the activity of the mine as the treatment and compare households located close to the city of Cajamarca (less than 100 km; see figure 2) to households located farther away (more than 100 km). However, we modify AR's identification strategy to capture the effects that take place during the bust years, and compare these with the effects during the boom period. Our main equation takes the following form:

where Y hdt is the outcome variable of household h in district d in year t. Here, following AR, the outcome variable we use is a measurement of living standards (income, poverty, consumption). M t is a measure of the mine's activity, gold production. This variable is interacted with distd, which is the measure of distance, defined as a dummy equal to one if the district in which the household is located is less than 100 km from Cajamarca city, and zero otherwise. The main difference in relation to AR's identification strategy is the use of the Boom and Bust variables. Boom is a dummy variable that takes the value of one from 1997 to 2016, and Bust is another dummy variable equal to one from 2007 to 2016. As such, β Boom and β Bust are the parameters of interest: β Boom is the initial impact (the key finding of AR) and β Bust is the change in β Boom during the bust period in comparison with β Boom. We also include year (η t) and district (α d) fixed effects, a vector of household characteristics X hdt in each regression, as well as sample weights and clustering standard errors at the district level.
Districts in the sample, by distance from the city of Cajamarca.

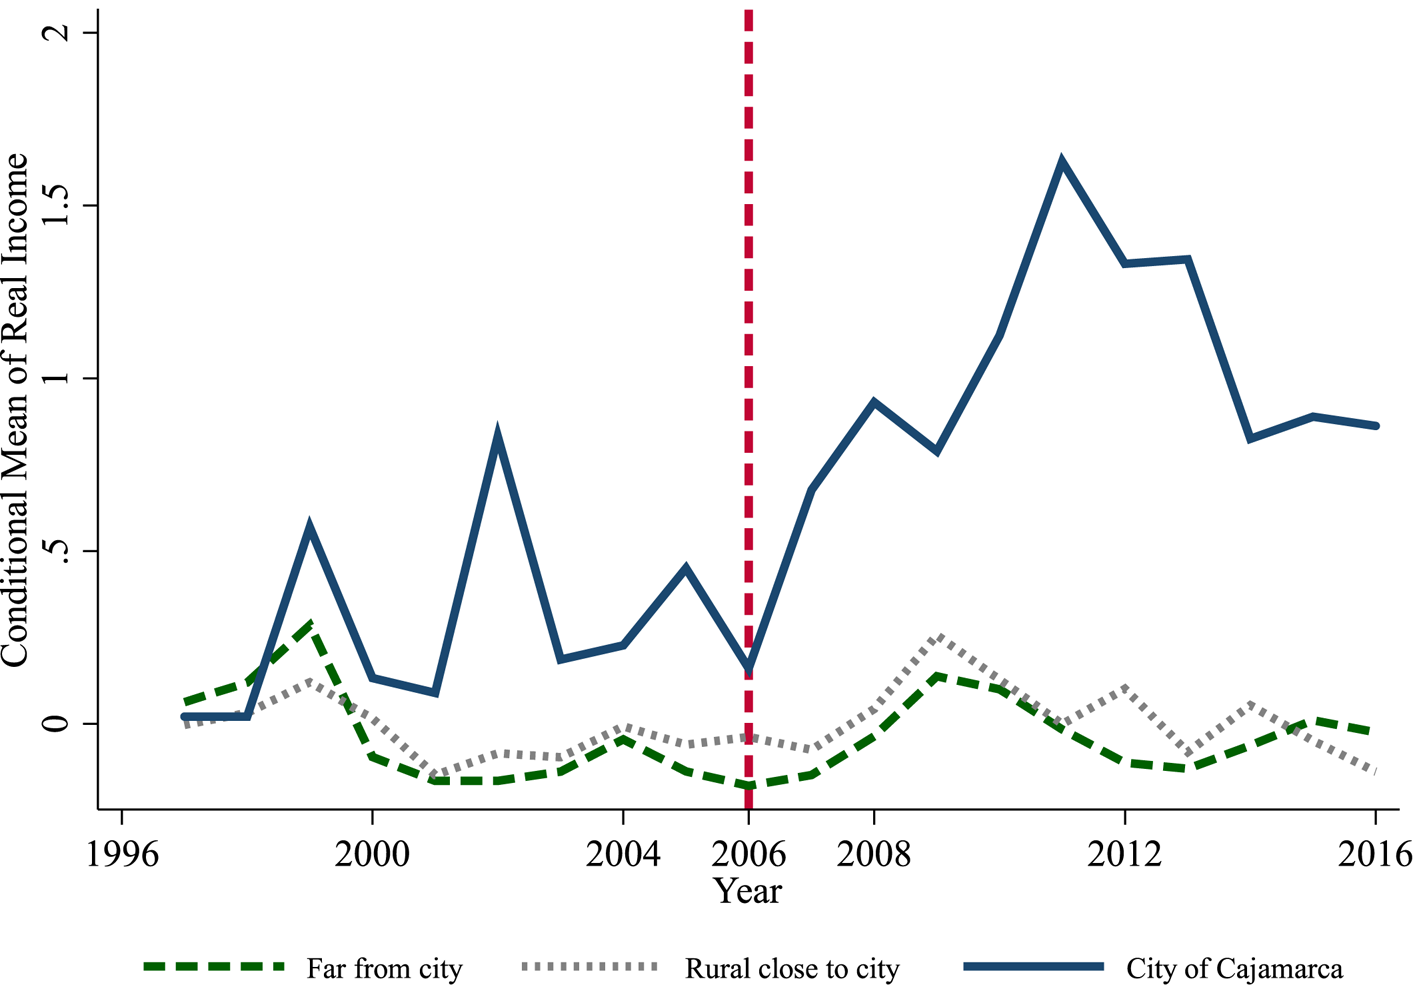
Figure 3 presents the conditional mean of real income per capita for both treated and control households. As can be seen, during the boom period, the income level of households located close to the mine increases in comparison with that of households located farther away. For our extension of the period of analysis, AR's central finding – that is, sizable local effects in the city of Cajamarca – might seem to hold true at first sight. However, on closer inspection, the gap between real income trends can be seen to vary over time and to narrow towards the end of the period. In 1997–2006, the real income of households close to the city overtook that of households farther away, and in 2006–2010, the income gap from the previous period continued to hold. Thereafter, the picture becomes more complex: the income gap expanded in 2010–2013, when production fell but the value of production and fiscal transfers remained high because of the gold price surge (figure 1 and figure A1 in the online appendix), and then the gap closed sharply in 2013–2016, when gold production continued to fall and its price dropped.
Conditional mean of real income.
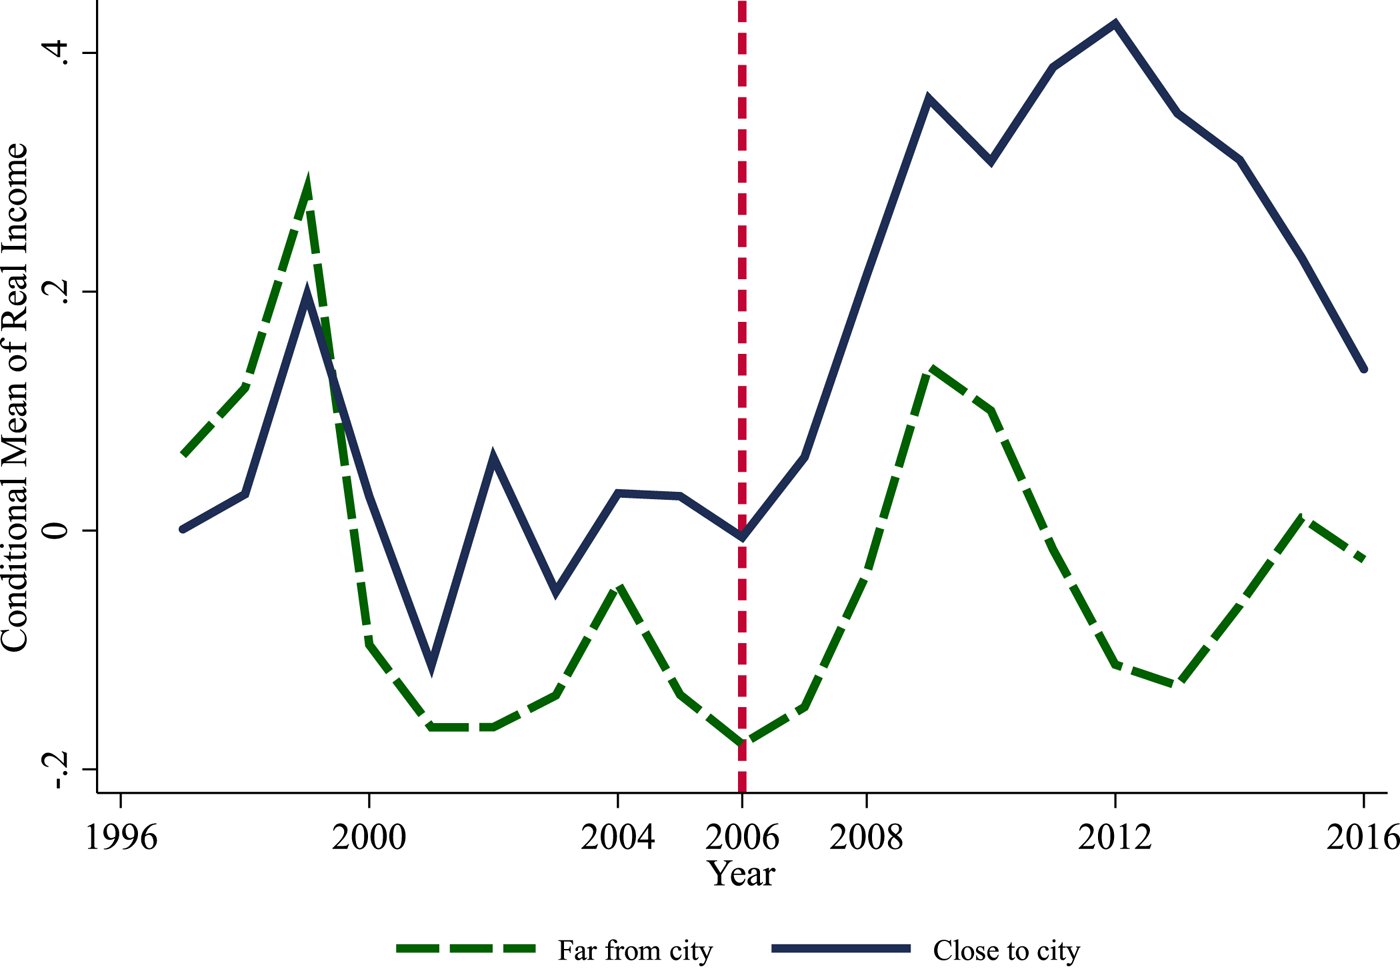
Figure 4 is also revealing, with the caveat that the data is merely provided for indicative purposes, as household surveys are not representative at the city level. Income appears to be volatile for both populations. In fact, the considerable rise in income within Cajamarca city took place during the first part of the bust, and was followed by a sharp fall. When the sample for the city and its immediate surrounding area, the treatment group, is divided into the categories of ‘urban’ (the city of Cajamarca itself) and ‘rural’ (the hinterland within 100 km of the city), it can be seen that income in this rural category and in the faraway group actually moved together. In other words, it is the city that appears to benefit the most from the local effects. The income effects peaked in 2012, half a decade after production had started to fall (see figure 1). The complete picture for the extended period of 1997–2016 suggests that evaluations of local effects are sensitive not only to sampled time, but also to the choice of treatment and control group. Indeed, an argument can be made for comparing Cajamarca with a similar northern Andean city in which there is no mining, but no such ideal comparison exists.
Conditional mean of real income, by location.

4.3 Identification strategy for estimation of backward linkages
To inquire into whether local effects on income and prices are indeed due to the presence of backward linkages or linkages of other types, we conduct a second estimation at the district level, based on the 1993, 2007 and 2017 population census data. This allows us to compare district level outcomesFootnote 4 and analyze two time periods, which coincide with those we analyzed in the previous identification. Moreover, the years in which these population censuses were conducted coincide with key points in the trajectory of the mine: 1993 is one year before Yanacocha started operations, 2007 corresponds to the start of the bust period, and 2017 was the year of the mine's final depletion. The basic equation is as follows:

where d denotes a district, Y d represents a given outcome variable, and distd is the dummy variable that indicates whether a district is influenced by the mine or not. We include district fixed effects, α d, and a set of district-level socioeconomic characteristics, X d. Variables T 07 and T 17 represent two dummy variables that indicate the year of the census. T 07 takes the value of one for the 2007 and 2017 censuses while T 17 takes the value of one just for the 2017 census, with the 1993 census being the baseline for our estimations. The specification allows us to capture the causal impact of the mine's influence during the boom period β Boom, as well as the relative change in the bust period β Bust. Finally, εit is the idiosyncratic error term.
5. Main results for local effects
5.1 Effects on income and consumption
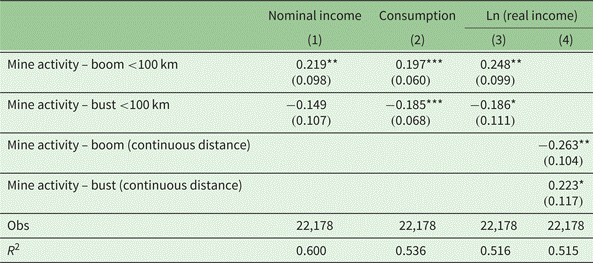
Our first step is to report estimates for our parameters of interest for a set of variables related to income and consumption. Table 3 presents estimates for β Boom and β Bust, for nominal income (column 1), consumption (column 2), and real income (columns 3 and 4). Note that all estimates for β Boom are positive and significant (as with those of AR), which suggests that mine activity did have a positive impact on households within 100 km of the city of Cajamarca, in comparison to households located 100 km away or more. Note also that we use continuous distance in column 4, as in AR, according to which the estimation of β Boom is negative and significant. However, β Bust estimates indicate that these positive effects reversed partially during the bust period, whereby three of the four estimates are significant. Returning to figure 3, it can be seen that the real income of households near the mine increased until 2011, but during the last five years it fell while control group income rose. As the difference in coefficients (table 3) indicates, income was still greater at the end of the period than at the beginning. Local effects, given their cyclical character, had certainly not disappeared by 2016.
Effect of Yanacocha's activity on real income

Notes: All regressions include year and district fixed effects. The full set of control variables includes the household head's education, age and gender, and dummies indicating the household head's industry of occupation and type of job, as well as household access to water, electricity, number of household members and income earners, and an indicator of urban household. Gold production is measured in millions of ounces. The measure of continuous distance is expressed in hundreds of km.
***Significant at the 1% level, **significant at the 5% level, *significant at the 10% level.
In the online appendix, tables A1 and A2 present estimates for other measures of household welfare, such as poverty and local prices. According to the theoretical framework, during a boom, poverty should fall and local prices should increase due to the expansion of the mine. Conversely, when the mine scales down, the effects ought to be the opposite. Estimates of β Bust confirm that the impacts on poverty and prices fade during the bust (although in the latter case, the results are only statistically significant for potato prices). As to health, the probability of being sick increases during the bust period. Thus, complementary statistical analysis can be seen to reinforce the main argument.
5.2 Effects differentiated by occupation and location
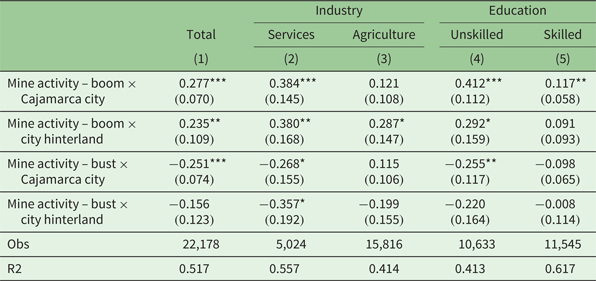
Central to AR's discussion is the question of who benefits from the mine's activity, and the authors find that the impacts are greater in the city (unskilled services) than in the immediate hinterland (agriculture). Table 4 reports estimates of β Boom and β Bust for each zone and for service/agriculture and unskilled/skilled workers. The results display the same pattern as that observed in table 3: positive effects during the boom in the city of Cajamarca, which benefits in terms of services and unskilled employment; and, to a large extent, a reversal of these effects with the bust. In the hinterland within 100 km of Cajamarca city, bust coefficients are all negative but almost all lack statistical significance – except for services, which show a sizable fall. In the city's hinterland, the effect on agriculture is positive and significant at the 10 per cent level during the boom, and negative and non-significant during the bust. Thus, economic activity in the immediate rural vicinity of the city also experiences boom and bust, but is not as dependent on the mine cycle as the city of Cajamarca itself.
Effect of Yanacocha's activity by occupation and education

Notes: All regressions include year and district fixed effects and the same control variables as the baseline regression (see notes for table 2). Cajamarca city is a dummy equal to one if the household is located in Cajamarca city. City hinterland is equal to one if the household is located outside Cajamarca city but within 100 km. The omitted category is households located farther away than 100 km. Skilled workers are defined as those with more than the median of five years of schooling. Standard errors are clustered at district level.
***Significant at the 1% level, **significant at the 5% level, *significant at the 10% level.
5.3 Alternative explanations: fiscal windfall, mines and geographical effects
AR's main contention regarding the centrality of backward linkages implies that fiscal windfalls do not constitute a relevant determinant of local effects. Local government expenditure is highly dependent on the so-called canon minero, a fiscal transfer that regional and local governments in producing regions receive as a proportion of the total taxes paid by mining companies. Under the canon minero, as AR explain, there are three sequential rounds of distribution. First, a portion is distributed between the districts where a mine is located. Second, another portion goes to the districts in the province where the mine is located (including the producer districts that received a transfer in the previous round). Finally, the remainder is allocated to all the districts in the region where the mine is located (including the producer districts that received transfers in the previous two rounds). Under this rule of redistribution, districts located within Cajamarca province, the city of Cajamarca, and its immediate rural areas receive a larger share of the canon relative to the other districts in the region of Cajamarca. Furthermore, the regional government – located in the city – also receives a share of mining taxes, further boosting the economy of Cajamarca city. Fiscal rules restrict canon minero revenue to public investment expenditure, which means spending on infrastructure (including temporary construction workers) rather than the municipal payroll.
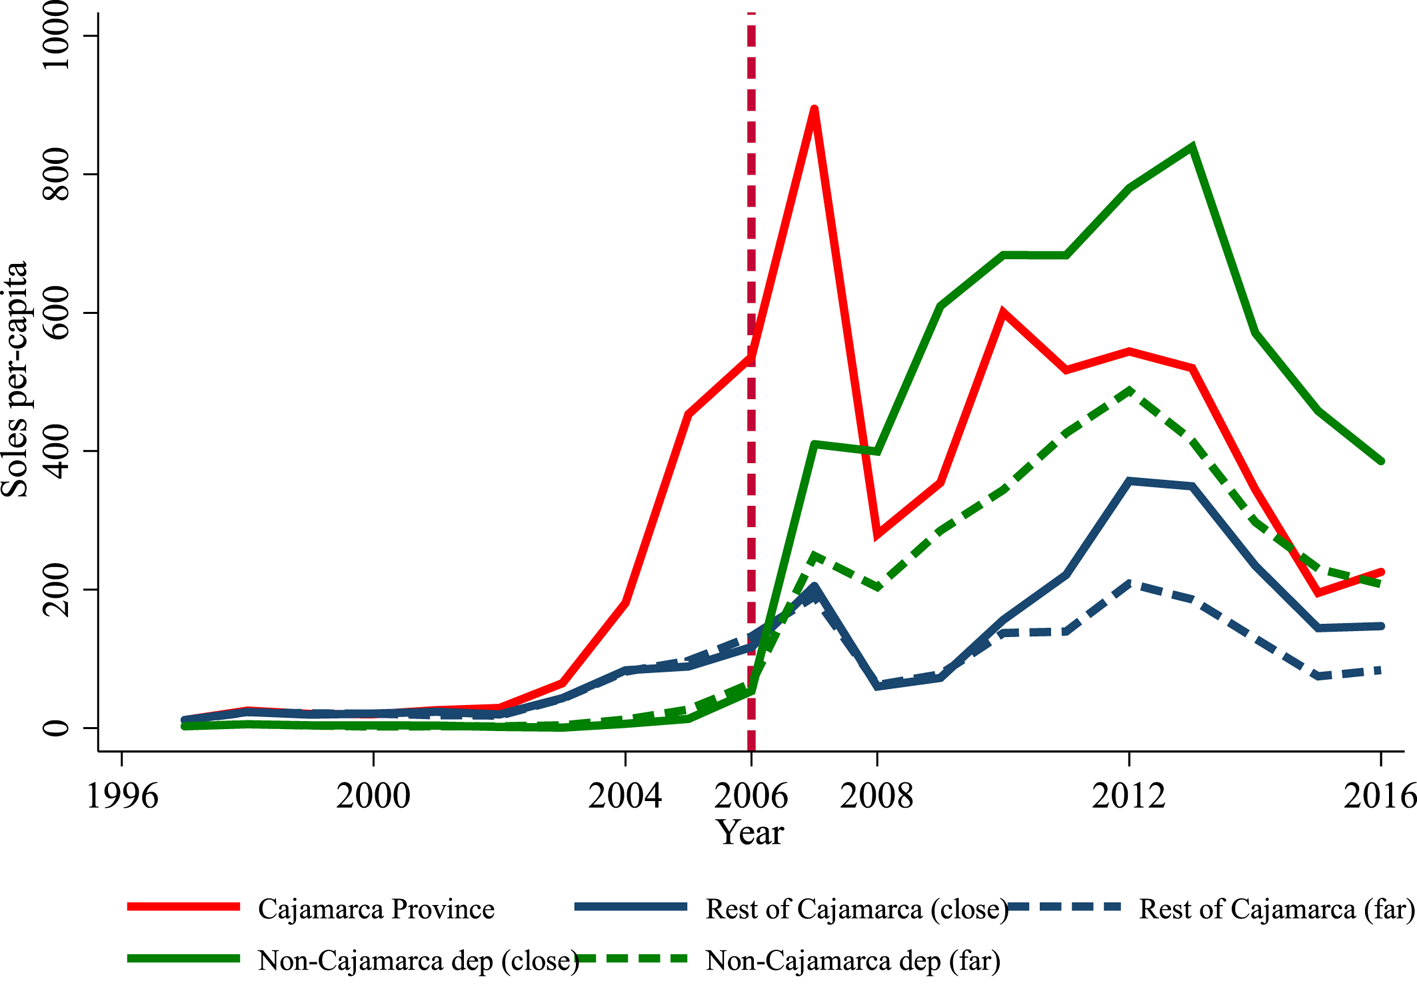
The evolution of revenue windfalls, then, is conditioned primarily by canon minero rules, tax breaks, the extraction rate and metal prices. Figure 5 shows that these transfers started to grow significantly only after 2002. In particular, the districts within the province of Cajamarca received considerable fiscal windfalls. However, from 2006–2013, nearby municipalities located in La Libertad matched and surpassed these windfalls, since this region became the largest gold producer in the northern Peruvian Andes. Yanacocha accounted for almost 80 per cent of the combined gold production of Cajamarca and La Libertad in 2001, but only 25 per cent in 2016, while mines in La Libertad made up 55 per cent (see online appendix). Thus, with so many direct (production) and indirect (fiscal) effects across different northern Andean regions, analyzing local economic effects using a Cajamarca region-only sample is prudent.
Average mining fiscal transfers per capita, by location.

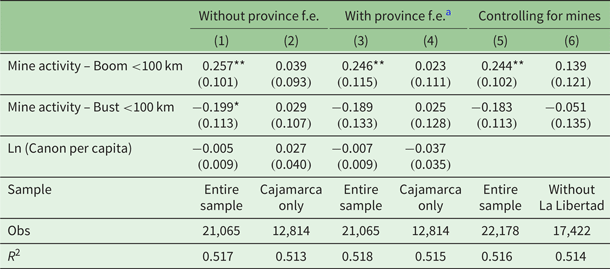
To rule out the possibility that the positive impacts are due to canon minero transfers and/or the influence of other mines, we repeat the initial regression but add the log of canon per capita and include fixed effects for the province of Cajamarca to control for the faster growth in canon transfers for the districts therein. We also include dummy variables for those districts (and provinces) where mines were opened between 1997 and 2016. Finally, we run regressions, excluding La Libertad districts from the sample. The results are shown in table 5. The most significant outcome is that using a Cajamarca-only sample causes the coefficients to fall sharply and the significance to disappear. With regard to real income, on the other hand, there is too much variation to draw any conclusions. In addition, as with AR, the canon per capita proves not to be significant in explaining variation in income levels; thus, more resources for infrastructure projects does not appear to translate into higher family income among the sampled population, which makes sense since the fiscal impact on economic wellbeing is indirect and complex.
Effect of Yanacocha's activity on real income, controlling for the revenue windfall (Canon Minero) and other mines

Notes: f.e.: fixed effects. All regressions include year and district fixed effects and the same controls as the baseline regression (see notes for table 2).
a These province fixed effects refer to parametric trends, which are year fixed effects interacted with an indicator of household living in Cajamarca province. Robust standard errors are in parentheses. Standard errors are clustered at the district level.
**Significant at the 5% level, *significant at the 10% level.
To conclude, the argument for the local effects of Yanacocha needs to be qualified. We show that the estimation of local effects is contingent on sample time, as volatility is high and the depletion of the mine caused local effects to fade. Concurrently, we find that the positive impacts are limited almost entirely to the urban economy, primarily in terms of the service sector and unskilled workers. Finally, we observe that the results are not robust to restricting the control group to Cajamarca region districts.
6. Tracing backward linkages in employment data
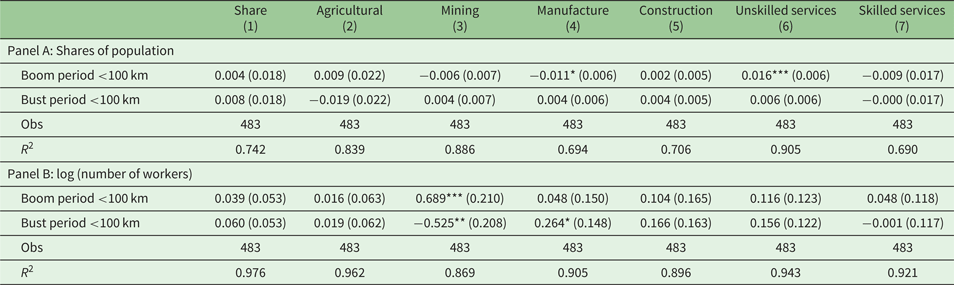
Finally, we examine whether it is appropriate to identify backward linkages as the mechanism underlying the local effects studied. Since the analysis is now at the district level, we use a set of control variables based on housing and population census data, such as the household head's education, age and gender, as well as other sociodemographic characteristics (see notes for table 6 for more details). The results are shown in table 6, in which panel A shows the population breakdown, and panel B the log number of workers, organized by sector. In panel A, it can be noted that the share for the unskilled services sector (which includes transport, commerce, lodging and restaurants) increased during the boom, offset by a decrease in the share for manufactures (of low significance). The evidence thus suggests that the mine generated economies of agglomeration based on the provision of unskilled services rather than purchases of manufactures and/or skilled services. Indeed, the manufacturing sector is found to diminish, to the advantage of the unskilled service sector.
Impact of Yanacocha on productive structure

Notes: Regressions include household head's education, age and gender, as well as household access to water, electricity, number of household members and income earners, and an indicator of urban household, besides district fixed effects. Robust standard errors are in parentheses.
***Significant at the 1% level, **significant at the 5% level, *significant at the 10% level.
In sum, there is no evidence of local backward linkages. However, these findings do not mean that there are no backward linkages or linkage opportunities with the Peruvian mining industry. In a recent study, Molina (Reference Molina2018) documents cases of Peruvian companies (domestic suppliers) that successfully integrate into the mining value chain. These companies manage to develop goods (machinery) and services (consulting), and thus become local suppliers to mining firms. However, such success stories are almost entirely restricted to companies based in Lima; very few of the domestic providers integrated through backward linkages with the mine are located in the nearby area.
Looking at the number of employees, in panel B, it can be seen that demand for labor (in the form of direct employment by the mine) was most evident during the boom, but fell almost to the initial 1997 levels during the bust. Therefore, the findings on employment share are indicative of limited and non-significant industrial development, and of few connections with other economic activities; rather, the data analysis indicates an increase of limited significance in manufactures during the bust. Including a series of control variables and removing fixed effects at the district level does not affect these results (see table A3, online appendix).
Putting all the evidence together, we conclude that the effects that Yanacocha established were related not to production, but to consumption and services. According to our analytical framework, if the multipliers linking a mine with manufactures and skilled services are small, then weak backward linkages exist. Conversely, if there is an increase in the labor force in manufacturing and skilled services, associated with high interindustry multipliers, then the backward linkages are strong. Having stated that the likelihood of sustainable economic development is higher when actual production linkages – rather than short-term income shocks – take place, we are skeptical about the prospects of the local low-skill service economies that have emerged in the city of Cajamarca.
7. Conclusion
The short-run effects of a booming mine might offer little indication of how to tell or make a blessing from a curse, as local effects are likely to have a cyclical character. However, while our assessment differs from that of AR, primarily in respect of the sampled data, we find that inquiring further into linkages is enlightening for the debate on resource-based development. Our evidence supports the view that the local effects of mines, especially in impoverished regions, are cyclical, and that the type of market relations generated between a mine and the local economy matter in this regard, the caveat being that in the present case we classify a city with a population of 200,000 as the local communities. This point is central to qualifying the lessons from the case study, given the rural character of the Andean host economy. Further, our results prove not to be robust to changes to the sampled population: restricting the analysis to districts in the Cajamarca region renders the identified local effects non-statistically significant. In any case, and despite agglomeration dynamics, local effects in the city of Cajamarca are likely to vanish, because they seem to result from straightforward income and consumption shock mechanisms rather than proper backward production linkages.
Moreover, our findings problematize the purported merits of local procurement policy. Large-scale mining companies most likely carry out local procurement to create tangible economic benefits – the explicit goal of the IFC-promoted procurement policy in Yanacocha – rather than to finance long-run public goods and self-sustaining economic activities. So long as short-term-oriented local procurement leads to an immediate improvement in the political conditions for mining operations, mining companies have no need to concern themselves about the long-term economic prospects of the local communities surrounding their mines. For the local procurement policies practiced by the extractive industries to have any long-term impact, they would need to allow for the incubation of economic activities that bring about knowledge, coordination and other spillover effects.
We contend that the resource curse debate should be advanced by exploring the extent to which multipliers and linkages generate spillovers, stressing that impact evaluations of mines are contingent on sampled time. We contribute to the local resource curse literature by showing that time and place are key for empirical assessments of the resource curse thesis, and that there is no strong evidence for backward linkages with local communities in the case of the large Yanacocha gold mine. While we find it more conceptually accurate to reserve the concept of backward linkages for effects of a productive nature, the empirical evidence reveals that unskilled services is the one sector that clearly benefits, in contrast to local manufactures and skilled services. Therefore, it is mere consumption effects rather than proper backward production linkages that have taken place. To return to the questions that overarch our research, one could argue that Yanacocha, its gold now depleted, seems to exemplify impoverishing local growth rather than sustainable economic development. In the region of Cajamarca, there is evidence of consumption boom and bust among city-based households, but few signs to suggest that a new local production base has been created to replace the depleted natural capital.
Supplementary material
The supplementary material for this article can be found at https://doi.org/10.1017/S1355770X19000330
Acknowledgements
We are grateful to Carlos Archer Pérez and Osmel Manzano, APE conference participants, and anonymous referees for very useful comments.