Introduction
The relationships of the Antarctic biota and the degree to which they are isolated from other Southern Hemisphere landmasses is of interest for biogeographic questions examining the origins of these taxa (dispersal, both recent or ancient, versus vicariance) (e.g. Muñoz et al. Reference Muñoz, Felicisima, Cabezas, Burgaz and Martinez2004, Sanmartín & Ronquist 2004, Stevens et al. Reference Stevens, Greenslade, Hogg and Sunnucks2006, Convey & Stevens Reference Convey and Stevens2007) as well as for identifying introduced organisms (e.g. Frénot et al. Reference Frénot, Chown, Whinam, Selkirk, Convey, Skotnicki and Bergstrom2005). Critical to any molecular examination, however, is accurate taxonomic identification, and although several papers on moss distribution and taxonomic affinities have been published (e.g. Cardot Reference Cardot1907, Ochi Reference Ochi1979, Seppelt & Kanda Reference Seppelt and Kanda1986, Seppelt & Green Reference Seppelt and Green1998, Ochyra et al. Reference Ochyra, Lewis Smith and Bednarek-Ochyra2008), the taxonomic status of some of these species remains unsatisfactory (e.g. Seppelt & Green Reference Seppelt and Green1998, Seppelt et al. Reference Seppelt, Smith and Kanda1998, Spence & Ramsay Reference Spence and Ramsay2002). This is largely because, in the Ross Sea region, diagnostic capsules have only been observed or collected for a single Antarctic species, Hennediella heimii (Hedw.) Zand. (Seppelt et al. Reference Seppelt, Smith and Kanda1998). Without sporophytic features, particularly peristome characteristics, some species may be very difficult to identify unequivocally (Ochi Reference Ochi1979, Seppelt et al. Reference Seppelt, Smith and Kanda1998). This problem is exacerbated by the morphological plasticity induced by the harsh Antarctic environment (Nakanishi Reference Nakanishi1979).
The taxonomic identification of Southern Hemisphere populations of the ‘silver’ Bryum complex, especially the morphologically similar taxa B. argenteum Brid. (e.g. Ochyra et al. Reference Ochyra, Lewis Smith and Bednarek-Ochyra2008, Seppelt et al. Reference Seppelt, Türk, Green, Moser, Pannewitz, Sancho and Schroeter2010) and B. subrotundifolium Jaeg. (e.g. Seppelt & Green Reference Seppelt and Green1998, Green et al. Reference Green, Kulle, Pannewitz, Sancho and Schroeter2005) have been confused, highlighting the particular difficulties with taxonomic identification of these mosses (see also Adams et al. Reference Adams, Bardgett, Ayres, Wall, Aislabie, Bamforth, Bargagli, Cary, Cavacini, Connell, Convey, Fell, Frati, Hogg, Newsham, O’Donnell, Russell, Seppelt and Stevens2006). Some small environmental forms of B. pseudotriquetrum (Hedw.) P.Gaertn., B.Mey. & Scherb., are also remarkably similar in morphological characteristics to B. argenteum (Ochyra et al. Reference Ochyra, Lewis Smith and Bednarek-Ochyra2008). Spence & Ramsay Reference Spence and Ramsay(2002) transferred B. subrotundifolium to the genus Anomobryum. However, Ochyra et al. Reference Ochyra, Lewis Smith and Bednarek-Ochyra(2008) refuted this and considered this taxon as a synonym of B. argenteum var. muticum. A key distinguishing feature between the two distinct varieties of B. argenteum is the retention of chloroplasts in all leaf cells in var. muticum (previously B. subrotundifolium), giving the plants a yellow/green colouration, while in var. argenteum the distal half to one third of the leaf becomes achlorophyllose, giving the plants a silver/green colouration (see Ochyra et al. Reference Ochyra, Lewis Smith and Bednarek-Ochyra2008). Thorough morphological comparisons of vegetative specimens (Seppelt & Kanda Reference Seppelt and Kanda1986, Seppelt & Green Reference Seppelt and Green1998), have previously recorded B. a. var. muticum and B. a. var. argenteum from continental Antarctica, sub-Antarctica, New Zealand and Australia and the recent treatment by Ochyra et al. Reference Ochyra, Lewis Smith and Bednarek-Ochyra(2008) describes an almost entirely overlapping distribution between the two varieties. Clearly, the taxonomy within this group remains confused.
We focused our study on the taxa B. a. var. argenteum and B. a. var. muticum. We adopted a molecular systematic approach to unravel the taxonomic and biogeographic issues of these mosses and to ask the question: Do the Antarctic populations represent a genetically distinct taxon (suggesting isolation) or are they similar (mixed) to non-Antarctic populations (suggesting recent gene flow)? We utilized sequence variation of two nuclear markers, ribosomal (nr) internal transcribed spacer (ITS) regions and a fragment of the phytochrome 2 (phy2) gene; this approach avoids problems associated with both single gene phylogenies and environmentally driven morphological plasticity.
Materials and methods
Plant material
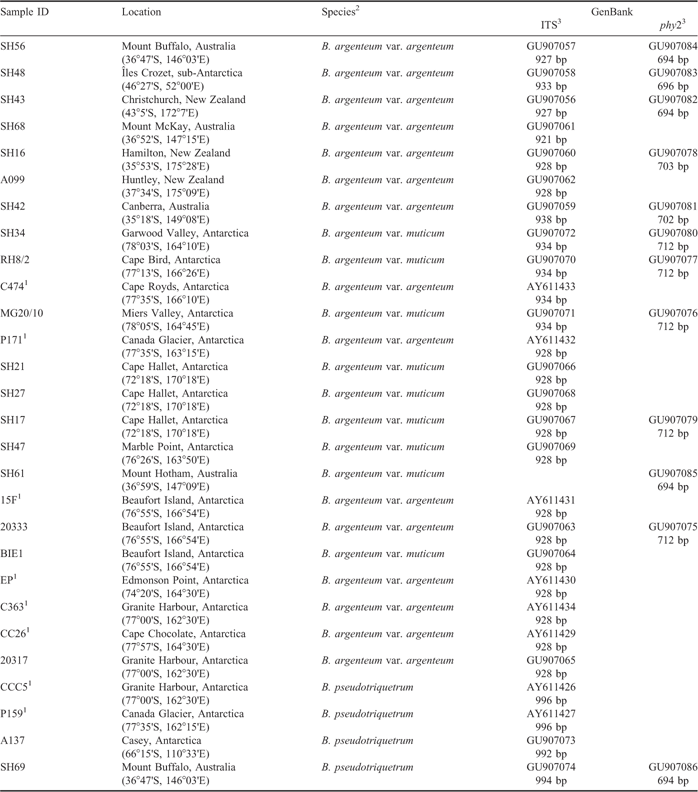
Specimens for DNA analyses were collected from Antarctica, New Zealand, and Australia (Table I). The samples were placed in paper envelopes and air dried as soon as possible after collection, transferred to sealed plastic bags and stored at -74°C until DNA extraction. Voucher specimens are deposited in the University of Waikato herbarium (WAIK), and the Australian Antarctic Division herbarium (ADT - now located in HO).
Moss samples from continental Antarctica (Victoria Land), sub-Antarctic (Îles Crozet), Australia and New Zealand used in this study. Sample ID numbers relate to those used in Figs 1 & 2, collection localities, species identifications and GenBank accessions with sequence lengths obtained for each specimen.

1Sequences from Skotnicki et al. (Reference Skotnicki, Mackenzie, Clements and Selkirk2005)
2Species names based on original taxonomic identification, such that Bryum argenteum var. argenteum = specimens originally identified as Bryum argenteum, and Bryum argenteum var. muticum = specimens originally identified as Bryum subrotundifolium.
3Sequence lengths for fragments prior to addition of gaps for accurate alignments; not all specimens were run with phy2 given the lower resolution compared to ITS
Molecular analyses
Total genomic DNA was extracted from 100–500 mg of clean, dried, herbarium or frozen moss material using a CTAB extraction technique (Rogers & Bendich Reference Rogers and Bendich1985). PCR amplification and sequencing of the ITS region from the moss samples utilized the primer combination ITSHP5 [5′-GGAAGGAGAAGTCGTAACAAGG-3′] (LMS, Smithsonian Institute) and ITS4 [5′-TCCTCCGCTTATTGATATGC-3′] (White et al. Reference White, Bruns, Lee and Taylor1990). Amplification and sequencing of a portion of the phy2 gene employed the primers; phy2(forward) [5′-GGCATGGAAATGATGTGTTG-3′] and phy2(reverse) [5′-CATCACTGTACCCATCTCG-3′] (McDaniel & Shaw Reference McDaniel and Shaw2005). PCR was performed in 0.5 ml thin-walled microcentrifuge tubes using 1–10 ng of template DNA, 1 X PCR buffer (Roche), 1.5 mM MgCl2, 0.5 μM of each primer, 0.25 mM each of dATP, dTTP, dCTP, dGTP (Boehringer Mannheim) and 1 unit Taq DNA polymerase (Roche) in a total volume of 20 μl. Amplification was performed using a Biometra T1 thermocycler (Whatman Biometra) with the following protocol: 5 m at 95°C, followed by 29 cycles of 30 s at 95°C, 30 s at 50°C and 45 s at 72°C. PCR products were electrophoresed on a 1.0% agarose (SeaKem LE) minigel and visualized with ethidium bromide. Where multiple amplification products were generated in a single reaction, products c. 1 kb were excised individually and purified using a Perfectprep gel cleanup kit (Eppendorf).
Purified PCR products were quantified with a Nanodrop spectrophotometer (NanoDrop Technologies). Forward and reverse sequences were generated using BigDye™ Terminator chemistry (Perkin-Elmer Applied Biosystems) for all sequences. This ensured sequence information was obtained for the entire ITS region, including the 5.8S ribosomal gene. The products of these reactions were then separated on a capillary ABI3730 genetic analyser (Applied Biosystems Inc) at the Allan Wilson Centre Genome Service, Massey University. All sequences generated here were verified using GenBank BLASTn searches. Sequences were aligned and edited using Sequencher (Gene Codes ver. 4.2). Trees were built in Geneious ver. 4.7 (Drummond et al. Reference Drummond, Ashton, Cheung, Heled, Kearse, Moir, Stones-Havas, Thierer and Wilson2009) from these alignments.
Results
ITS
ITS sequence data included the ITS1 and ITS2 regions, the 5.8S rDNA gene and a flanking region of the 18S rDNA gene. Sequenced fragments ranged from 921 to 938 bp in length for B. a. var. argenteum and B. a. var. muticum samples, and from 992 to 996 bp for the outgroup B. pseudotriquetum samples (Table I). The majority of the genetic variability is clustered in the ITS regions, and the introduction of sizeable gaps was required to align sequences from all three taxa.
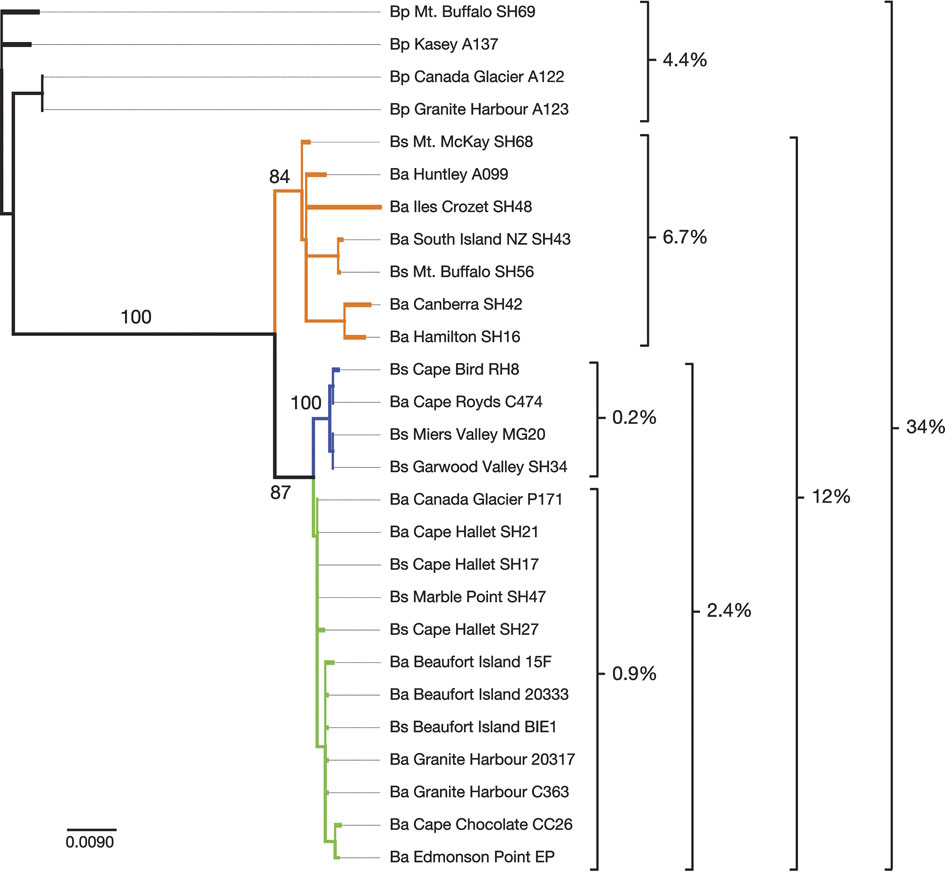
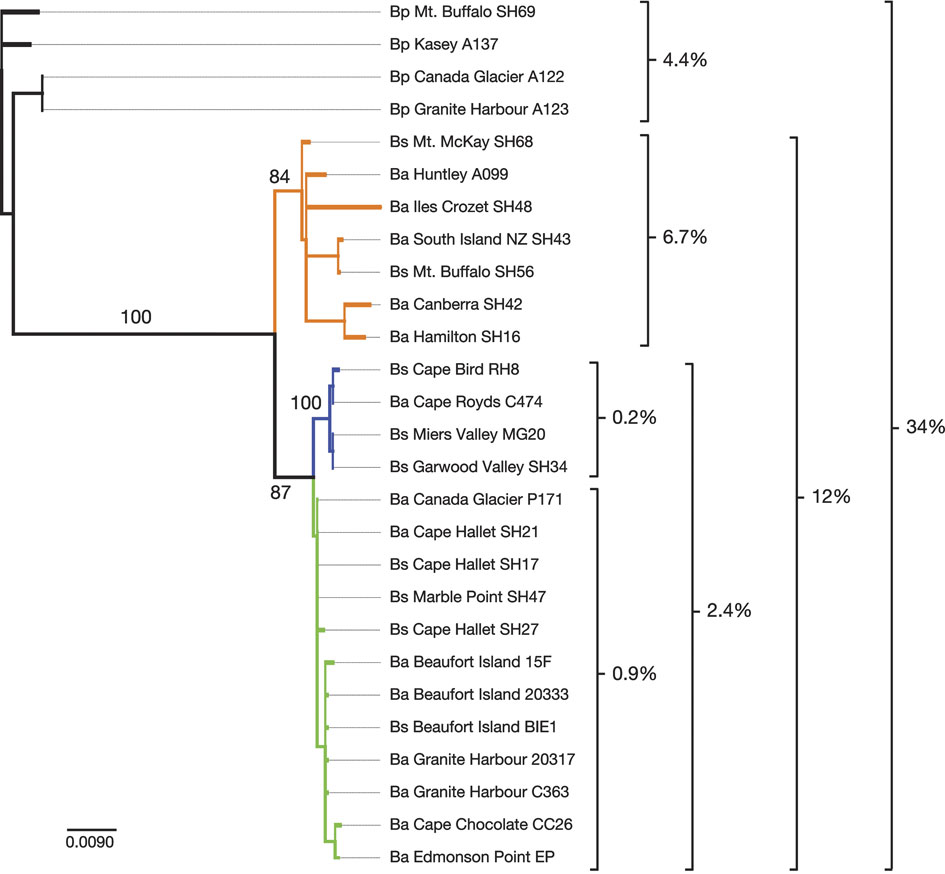
The phylogenetic reconstruction from the ITS alignments consistently recovered a clear separation of Antarctic Bryum samples from Australasian and sub-Antarctic samples (Fig. 1). Additionally, within the Antarctic group there is a discrete, well-supported grouping of samples from the most southern and Ross Island localities. Closer inspection of the sequence variability underlying the tree structure reveals a considerable difference in the sequence divergence observed between the samples from continental Antarctic and the non-Antarctic samples. Across all the B. a. var. argenteum and B. a. var. muticum samples the variability is 12%, with an average similarity of 96% between any two samples. However, within the non-Antarctic samples 6.7% of sites are variable, while only 2.4% are variable in the Antarctic sample set. Furthermore, the majority of the variability seen within the Antarctic sample set is accounted for by differences between samples from Ross Island and southern McMurdo Dry Valley sites (Cape Bird, Cape Royds, Garwood Valley, Miers Valley) compared to the continental samples from lower (more northern) latitudes. Sequence variability in the southern sites is only 0.2%, and for the samples from lower latitudes in continental Antarctica is 0.9%.
Neighbor Joining tree derived from a 1128 bp ITS alignment (including gaps). The tree is rooted using Bryum pseudotriquetrum samples as an outgroup. Clades are colour coded; orange for non-Antarctic specimens, blue for southern Antarctic specimens, and green for northern Antarctic specimens. Percentage consensus support values from 100 bootstrap replicates are indicated adjacent to relevant branches. Specimen labels include a morphologically based taxonomic identifier (Bp = Bryum pseudotriquetrum, Ba = Bryum argenteum, Bs = Bryum argenteum var. muticum (previously Bryum subrotundifolium), followed by sample location and sample identification code (see Table I). A scale bar is given, in number of substitutions per site. The percentage of variable sites in subsets of the data is indicated highlighting the low variability in the Antarctic samples.
phy2
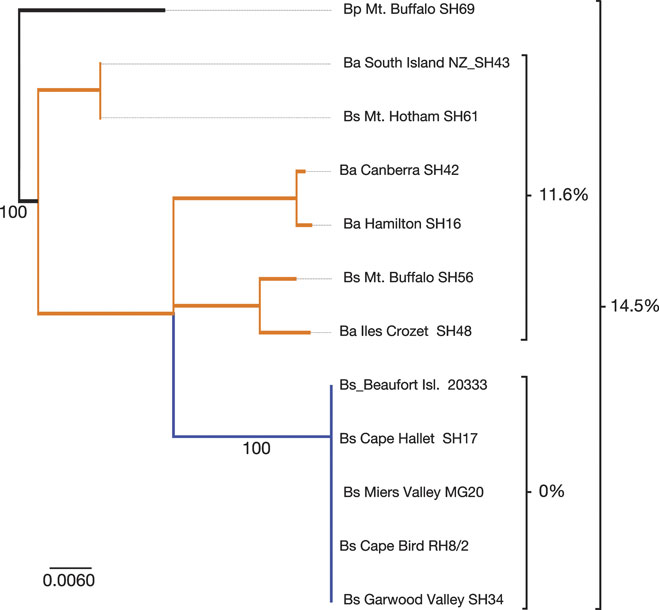
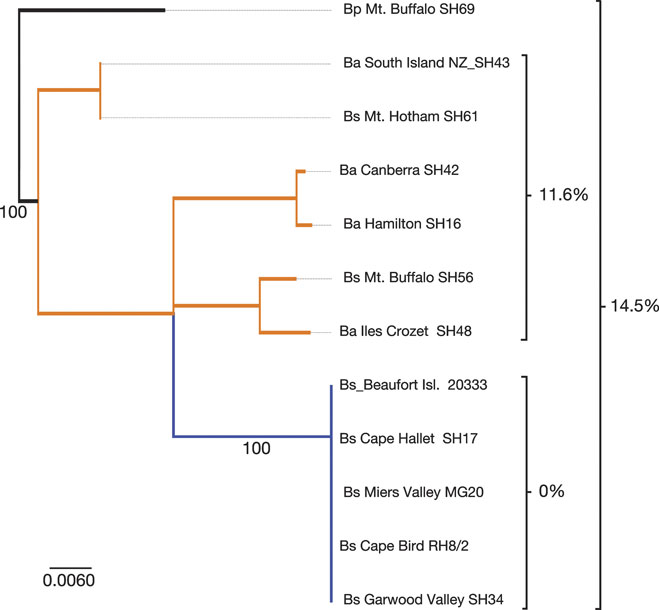
Alignments of phy2 were 715 bp in length, including gaps (Table I). The resulting phylogenetic reconstruction supports the Antarctic/non-Antarctic split seen for ITS (Fig. 2). There is no division between southern (including Ross Island) and northern Antarctic samples. The variability across the B. a. var. argenteum and B. a. var. muticum phy2 sequences is 12.9%. However, B. a. var. muticum samples from continental Antarctica have identical phy2 sequences.
Neighbor Joining tree derived from a 715 bp phy2 alignment (including gaps). The tree is rooted using Bryum pseudotriquetrum as an outgroup. Clades are colour coded; orange for non-Antarctic specimens, blue for Antarctic specimens. Percentage consensus support values from 100 bootstrap replicates are indicated adjacent to relevant branches. Specimen labels include a morphologically based taxonomic identifier (Bp = Bryum pseudotriquetrum, Ba = Bryum argenteum, Bs = Bryum argenteum var. muticum (previously Bryum subrotundifolium), followed by sample location and sample identification code (see Table I). Scale bar indicates number of substitutions per site. The percentage of variable sites in subsets of the data is indicated.
Discussion
Bryum argenteum var. argenteum is recorded (based on morphology) as having a cosmopolitan distribution including (but not confined to) the Maritime Antarctic and Antarctic Peninsula south to Alexander Island, Edward VII Peninsula, and in Victoria Land south to about 80°S. Bryum argenteum var. muticum has an almost identical range, but excludes Edward VII Peninsula (Ochyra et al. Reference Ochyra, Lewis Smith and Bednarek-Ochyra2008). Both ITS and phy2 sequence data show a clear separation of Antarctic and non-Antarctic samples. Furthermore, taxonomic identification of the specimens based on morphological characters that separated B. a. var. argenteum from B. a. var. muticum in our specimens from Antarctica, Australia and New Zealand, is not supported by either molecular marker used here.
The ITS phylogeny (Fig. 1) illustrates a close sister relationship of the Antarctic and non-Antarctic samples, while the phy2 data (Fig. 2) indicates that the Antarctic samples (suspected to all be B. a. var. muticum) form a clade nested within the B. a. var. argenteum lineage. In either case, the data support a close relationship of all these Bryum specimens, with clear separation between continental Antarctic populations and populations from lower (more northern) latitudes.
The continental Antarctic populations are characterized by low genetic variability, compared to samples from lower latitudes, indicative of a lower DNA substitution rate and a probable persistence in refugia, at least since the Holocene and likely to have been isolated in Antarctica since the Pleistocene. This result can be partly explained due to a lack of sexual reproduction (and hence longer generation time) in these mosses in the Antarctic environment (Seppelt et al. Reference Seppelt, Green, Schwartz and Frost1992) in conjunction with isolation in refugia. Populations restricted to a mode of vegetative reproduction will accumulate fewer substitutions than those able to reproduce sexually. This is concordant with an explanation for the same phenomenon observed in the Antarctic moss Ceratodon purpureus (Hedw.) Brid. (Skotnicki et al. Reference Skotnicki, Ninham and Selkirk2000).
Levels of genetic variability in the ITS sequence data are consistent with those reported by Skotnicki et al. Reference Skotnicki, Mackenzie, Clements and Selkirk(2005) and Stevens et al. Reference Stevens, Hunger, Hills and Gemmill(2007). However, with a larger sample size we have identified a split in the Antarctic populations that separate the most southern localities from those at lower (more northern) latitudes in Victoria Land. This is similar to the genetic breaks identified for other Antarctic organisms in the same region and which have been used to infer the presence of ancient (Holocene–Pleistocene) glacial refugia (e.g. Stevens & Hogg Reference Stevens and Hogg2003, McGaughran et al. Reference McGaughran, Torricelli, Carapelli, Frati, Stevens, Convey and Hogg2010). The genetic variability seen in the ITS sequences of the Antarctic specimens results largely from the comparison between northern and southern samples, with very little variation evident within each group (see Fig. 1). When sample size of the northern and southern populations is taken into account, the genetic variation observed is similar (0.1–0.4%), indicating similar constraints in both regions. It is possible that these two lineages represent separate colonization events from discrete refugia within Victoria Land.
There are currently very few molecular studies on Antarctic bryophytes leading to an assumption of recent dispersal and colonization in Antarctica. Here, we suggest the level of molecular divergence shows a clear signal of isolation across the Holocene and most probably into the Pleistocene for B. a. var. muticum and it is likely that this variety is endemic to Victoria Land, continental Antarctica. It is also apparent that B. a. var. argenteum does not occur in Victoria Land and is restricted to the non-Antarctic localities included in the present study. These restricted (and non-overlapping) distributions for both varieties are in contrast to previous morphological work that suggested largely overlapping cosmopolitan distributions (see Ochyra et al. Reference Ochyra, Lewis Smith and Bednarek-Ochyra2008). Morphologically, the extreme variants of both varieties are readily identifiable (Ochyra et al. Reference Ochyra, Lewis Smith and Bednarek-Ochyra2008). However, they are connected by a continuous range of morphological variants. The molecular evidence we have presented unequivocally refutes the separation of the two taxa in Victoria Land. To clarify this taxonomic dilemma it is essential for future work to examine the ‘silver’ Bryum group in a worldwide context, only then can we ultimately assign the Antarctic taxon to B. a. var. muticum, another taxon (not studied here) or be considered as potentially an Antarctic endemic taxon. A promising avenue of further study will also be a molecular clock analysis of this group with much wider geographic sampling along with other Antarctic and non-Antarctic (e.g. South American) bryophytes to examine biogeographic hypotheses (e.g. Convey & Stevens Reference Convey and Stevens2007, Convey et al. Reference Convey, Gibson, Hillenbrand, Hodgson, Pugh, Smellie and Stevens2008, Reference Convey, Stevens, Hodgson, Hillenbrand, Clarke, Pugh, Smellie and Cary2009). This will allow the hypothesis of a slower rate of molecular evolution, refugial populations and persistence in Antarctica to be directly tested, and allow the timing of colonization events to be examined at regional and continental-wide scales.
Acknowledgements
The authors thank the editors and two anonymous reviewers for comments on this manuscript. We are particularly grateful to Allan Green and Rod Seppelt for providing samples, assistance in the field, numerous enlightening discussions, and most of all for providing the inspiration and tireless support of this project. We were also assisted by Rhodri Harfoot, Sarah Hunger, Katrin Walbert, Louise Hathaway, and Catherine Beard either in the field, lab, or providing samples. For financial and/or logistical support we are grateful to David Penny and to Bryan Gould for his generous support of the Waikato University Antarctic Programme; Australian Antarctic Division project 2355 (MS), and Antarctica New Zealand (K024). This paper forms a contribution to the Latitudinal Gradient Project (LGP, Question 2 - role of large-scale ice structures) and to the SCAR EBA research programme.