I. INTRODUCTION
Nowadays, broadband power amplifiers (PA) are key components in defense and national security applications because of their flexibility to be used in nearly any communication, counter-communication, radar, radar jamming and digital data systems [Reference Skolnik1], and wireless communication to meet the performance demanded by modern digital modulation schemes such as Code Division Multiple Access (CDMA), Wideband Code division Multiple Access (WCDMA), Global System for Mobile (GSM), Orthogonal Frequency Division Multiplexing (OFDM), and Coded Orthogonal Frequency Division Multiplexing (COFDM) used in today's congested radiofrequency (RF) bands [Reference Hwi-Jae and Hyung-Yun2, Reference Ormondroyd, Maxey and Alsusa3], Industrial, Scientific and Medical (ISM) band, and test equipment that often require multi-decade [Reference Biggs, Henley and Clarkson4] frequency range coverage. Wide-bandgap (WBG) technology such as GaN and SiC [Reference Sayed and Boeck5] offers the demand for such kind of amplifiers because of its high breakdown voltage, high operating temperature, and high power density. As a result, easy impedance matching, relaxed operating conditions, high power, and small size reduce design effort.
Not only is transistor selection the most important point in broadband PA design but also the design approach itself during which optimum performance is achieved. In the past articles, the authors [Reference Sayed and Boeck6–Reference Medley and Allen8] tried to achieve high power, broadband performance based on WBG technology either using a feedback network for improving stability and compensating for the gain at low frequencies [Reference Sayed and Boeck5] or to extend the broadband performance up to 3.4 GHz based on the GaN High Electron Mobility Transistor (HEMT) transistors [Reference Sayed and Boeck6]. Bandwidth could be again extended to 8 GHz in [Reference Sayed, Al Tanany and Boeck7] using the same die transistor (not the package device as in [Reference Sayed and Boeck6]). The disadvantage of the design in [Reference Sayed, Al Tanany and Boeck7] was the power loss because of harmonic truncation in matching network synthesis.
In this paper, an efficient technique that considers the harmonics and their optimum impedances over the operating bandwidth is introduced. In-band harmonics, especially in multi-decade PA design in many cases causes trade-off between optimum performance (e.g. second-harmonic impedance at a certain frequency f can either decrease or increase the fundamental power at 2f, depending on their optimum impedances). Furthermore, out-of-band harmonics cause power losses at higher frequencies, resulting in PA performance reduction. Negative-image modeling at input and output transistor sides was also developed to include all harmonics (up to third-order harmonics) in matching network synthesis. To verify this approach, an ultra-broadband, 0.3–8 GHz, 10 W linear PA was designed for this purpose. Moreover, a miniaturized Wilkinson combiner was developed to cover the same bandwidth, thereby extending the output power of the combined amplifier to 17–20 W. The new technique could improve the broadband power performance by at least 1–2 W compared with [Reference Sayed, Al Tanany and Boeck7].
This paper is organized as follows: Section II focuses on the features of WBG technology. Section III describes design requirements concerning transistor selection. The proposed technique is described in detail in Section IV. The designed amplifier based on the new approach has been fully characterized and reported in Section V. Finally, Section VI summarizes and concludes the work.
II. WBG TECHNOLOGY
The number of RF power transistor technologies is continuously increasing. Figure 1 presents the frequency-power capabilities of various semiconductors such as Si, GaAs, and the WBG materials SiC and GaN [Reference Sayed and Boeck5].
Power-frequency range of semiconductor materials.

Owing to their physical properties, mainly the high breakdown field and high thermal conductivity, SiC and GaN show superior performance in the microwave frequency range especially at high-power levels. Although still immature and difficult to process and with a high substrate cost the superior inherent possibilities with these WBG technologies still make them the most interesting candidates for future high-frequency and high-power applications.
III. DESIGN REQUIREMENTS
In [Reference Sayed and Boeck5, Reference Sayed and Boeck6], the transistor was selected based on WBG technology to cover the bandwidth up to 2.4 and 3.4 GHz, respectively. To extend the bandwidth up to 8 GHz to include other wireless communication systems and satellite applications, the suitable one among RF transistors in the market was a die from Cree, CGH60015D with an output power of 10 W for broadband applications with considerable gain up to 6 GHz. Furthermore, the operating DC voltage ranged from 28 to 48 V, which results in a simple matching procedure with a low return loss at the output. Since the transistor area is 1 mm2 with a chip thickness of 100 µm, which is quite small for high-power transistors, the transistor has been mounted on a golden flange in such a way that the transistor can be finally either screwed or soldered to the main heat sink. Class A is recommended for linear applications, so the transistor was tested at different DC bias points for linearity considerations and acceptable efficiency at the same time. At a quiescent point V D = 36 V and I D ≅ 0.4 I DSS were selected for a highly linear operation.
IV. DESIGN APPROACH
In this section, an efficient technique for optimizing broadband performance is described. The goal of this approach is to achieve optimum power, gain, and broadband performance based on the selected transistor. The procedure for the suggested approach can be summarized in the following steps:
1. Select the operating point for the class of operation.
2. Decide the highest frequency of operation at which maximum available gain (MAG) is required.
3. Perform a load-pull analysis at certain frequency f (highest frequency, f h is recommended) for achieving the output power at 1 dB compression P opt (Z s = 50 Ω). All harmonic impedances are set to 50 Ω in this step.
4. Set the optimum load impedance Z opt (Z 1 = Z opt) and repeat step 3 at 2f. By considering the second harmonics, the extracted output power, (@ Z opt,1) is increasingly compared with that obtained in step 3. Re-tune the fundamental impedance Z opt,1 again, resulting in higher performance (@ Z opt,2).
5. Set Z 1 = Z opt,2 and repeat step 4 at 3f to achieve the optimum output power (P 1dB). Re-tune the fundamental impedance again resulting in higher performance (@ Z opt,3).
6. Step down the frequency and repeat steps 3–5 for extracting the maximum P 1dB and the corresponding Z opt_f, Z opt_2f and Z opt_3f at f, 2f, and 3f, respectively ((f h + 1)/2 < f ≤ f h). Note the reduction in degrees of freedom as the frequency goes down.
7. At f h/2, the degrees of freedom will be reduced by 2 where Z opt1 at f h represents Z opt2 at f h/2 etc. Figure 2 shows an example of the frequency spectrum up to 30 GHz and describes the combinations between frequencies, their harmonics, and degrees of freedom in steps of 1 GHz.
8. Once the optimum impedances over the whole bandwidth are extracted, the next step is to develop an image model for the transistor output network to fit the extracted load-pull data.
9. An output matching network (OMN) synthesis with the goal that the input impedance of the matching network, which is terminated on the output side to 50 Ω agrees with the corresponding input impedance of the developed model.
10. Insert OMN at the output and start source-pull analysis with the goal of achieving flat gain over the operating bandwidth.
11. Develop a negative-image model for the transistor input network to fit the extracted optimum input impedances.
12. Design an input matching network (IMN) so that both Z in of the transistor and that based on the model agree with each other. In the same manner, in this step the design considered the harmonic impedances, too.
13. Refine the design performance with a fractional variation at the input side in order to achieve minimum gain ripple and high stability in the whole bandwidth.
The procedure will be described in detail in the following sections.
A) Load-pull analysis for maximum P 1dB compression
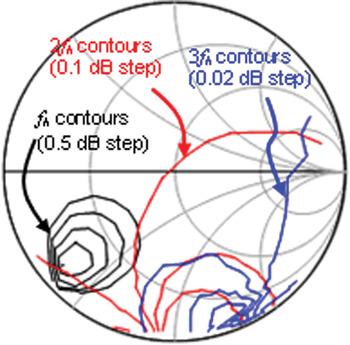
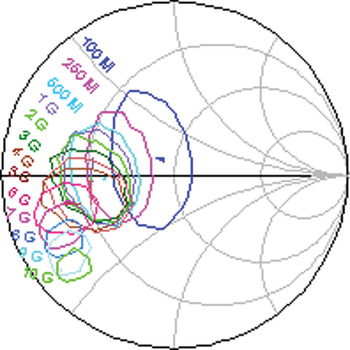
This section introduces a systematic load-pull analysis based on a large signal model from the manufacturer. Bond wire models have been attached to the die. At V D = 36 V, I D = 600 mA, Z s = 50 Ω, and f h = 10 GHz, a load-pull analysis procedure was carried out as discussed in step 3. Extracted load-pull contours for maximum P 1dB output power at 10, 20, and 30 GHz with different contour steps are constellated on the Smith chart in Fig. 3. The diagram shows that not only fundamental optimum impedance Z opt1 but also all other harmonic impedances such as Z opt2, Z opt3, etc., are equally important for maximum power. Moreover, contradictions between optimum fundamental and harmonic impedances constraint the degrees of freedom as the frequency goes down as described in Fig. 2. To explain this, for example, the optimum impedance of the second harmonic Z opt2 at f = 9 GHz contradicts to Z opt3 at f = 6 GHz, thereby reducing the optimum output power unless both impedances are very close to each other. To reduce the complexity of the procedure, the priority is given for the second harmonic optimum impedances in this case because they possess high-power levels, which directly affect the overall performance. Figure 4 shows load-pull contours with 1 dB step in the frequency range from 100 MHz to 10 GHz. From the diagram, two important issues can be observed. The first one is the decreasing real values of the optimum impedances with increasing frequency and at the same time the imaginary part is decreasing with frequency. The second point is the reduction of 1 dB contours with increasing frequency. Unfortunately, both points cause some difficulties in the matching procedure.
Frequency spectrum description based on the suggested approach.

Load-pull contours for f h = 10 GHz, 2f h and 3f h.

Load-pull contours with 1 dB step in the frequency band 100 MHz–10 GHz.

B) Negative-image modeling
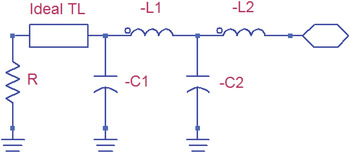
To achieve a broadband performance with low loss in the intervals where there are no extracted optimum impedances, a negative-image model [Reference Medley and Allen8] was developed to fit the extracted optimum impedances, interpolate and extrapolate all other values over the whole frequency range. In fact, the negative-image model and the non-linear device model of the manufacturer are applicable to these tasks. However, the huge advantage of the negative-image model can be twofold: first, it can be used even for “reconstruction” of a given non-linear “black box” model, e.g. from the manufacturer. This was not the application in this work. Second, the computation time for matching network design and optimization can be considerably reduced because the negative-image model is linear and the device model is non-linear. Therefore, the big advantage of using the negative-image model in this work was considerable time saving during matching network design, simulation, and optimization. This is mostly true for broadband designs as given here. In its simple form, a negative-image model is a mirror of either the input or the output network of the transistor. To fit the extracted optimum impedances at the output, the transistor output network has been imaged by (– C) and R which are equivalent to drain-source capacitance and drain-source resistance, respectively. An inductance (–L) was used to mirror the transistor pads. A second LC section was added to improve the model and achieve good agreement with the extracted data. Furthermore, an ideal transmission line has a characteristic impedance of 12.7 Ω and an electrical length of 7.9° at f = 520 MHz is added to fit the load-pull data at low frequencies. Figure 5 shows the equivalent circuit for a negative-image model used for this purpose. The model parameters have been extracted based on computer optimization. Table 1 depicts the extracted values of the model parameters.
Negative-image model.

Extracted model parameters.

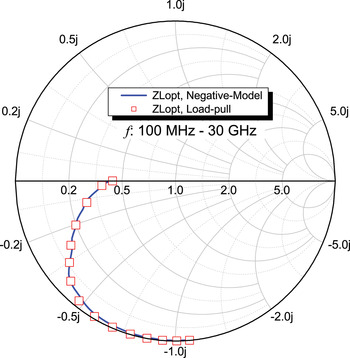
The extracted optimum load impedances for maximum output power at 1 dB compression (symbols) and their corresponding data based on the model (solid line) are constellated on the Smith chart (Fig. 6) in the frequency range from 100 MHz to 30 GHz. Excellent agreement between extracted load impedances and the modeled data can be observed.
Extracted optimum output impedances based on load-pull simulation (symbols) and their corresponding values based on negative-image model (solid line) in the frequency range from 100 MHz to 30 GHz.

C) OMN design
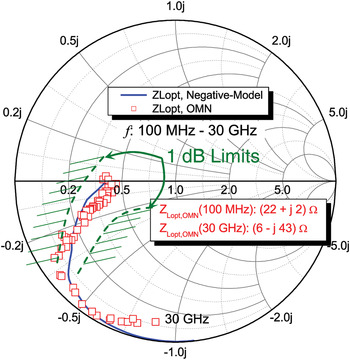
In order to synthesize for the OMN, the results of Figs 4 and 6 have to be considered to achieve broadband matching with a very low power loss. To start the procedure, the input impedance of the suggested network has to fit the corresponding Z in based on a negative-image model, given in Section IV-B. A two-section band-pass structure with a tapered line using a microstrip technique [Reference Shastry and Ibrahim9] was suggested and optimized such that both input impedances are as close as possible to each other. The proposed topology based on multi-sections helped in the design to cover broadband performance and reduce power loss. The first section and the other stubs are designed to match the second- and third-harmonic impedances. Fundamental optimum impedances could be matched using a tapered line [Reference Shastry and Ibrahim9]. The trace of the extracted optimum impedance was moved in the anticlockwise direction, whereas the expected trace based on the transmission line technique is in the clockwise direction, which makes the matching optimization procedure very sensitive resulting in additional nodes over the frequency. The goal of the optimization process in this case is to reduce the node area, resulting finally in a low transmission loss. Furthermore, to improve the procedure, 1 dB contour limits were added to the goal analysis to make sure that the power loss from the matching network is still within the limits. Figure 7 shows the modeled and the resulting Z L after matching enclosed in 1 dB limits area over the frequency range (100 MHz–30 GHz).
Modeled (solid line) and resulting (line with symbols) load impedances within 1 dB contour limits in the frequency range (0.1–30 GHz).

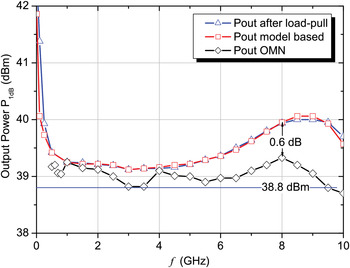
Figure 8 summarizes load-pull optimum 1 dB output power (triangle symbols), model verification (square symbols), and the matching performance (diamond symbols) in the frequency band (100 MHz–10 GHz). The diagram shows an excellent agreement between the modeled and extracted P out over the whole bandwidth; however, a matching loss of 0.6 dB up to 8 GHz can be observed.
1 dB output power based on load-pull technique (triangles), negative-image model (squares), and after adding matching network (diamonds).

D) Source-pull analysis for maximum flat gain
In Section IV-A, load-pull analysis was performed at Z s = 50 Ω because the optimum output power is roughly independent from the source impedance. Now, a source-pull simulation is applied with the goal of flat gain performance of 8–9 dB for the whole PA design over the operating bandwidth. The bonded die was attached to OMN on the output side and optimum input impedances looking into the transistor input side are extracted based on the source-pull technique. The next step is to model the extracted optimum input impedance based on the negative-image model in the same manner as that given in Section IV-B with the exception that the resulting model has a series RC equivalent circuit.
E) IMN design
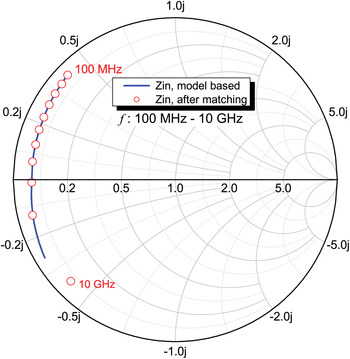
In this section, an IMN was designed to achieve an overall flat gain and improve the stability performance of the implemented amplifier. The main key for synthesizing the network with low loss is to fit the model input impedance to the corresponding input impedance of the matching network over the whole bandwidth. In addition, a structure of two band-pass sections based on the microstrip technique was proposed for IMN design. R s║C s branch was added near the transistor to improve the amplifier stability. Both values of either R s (13 Ω) or Cs (1 pF) are selected so that the maximum stable gain (MSG) is close to the MAG over the operating bandwidth. Further improvement at low frequencies was achieved by adding a shunt stub with a compensation network (R p║C p) to reduce the gain in the low-frequency band and consequently improve stability. Figure 9 shows input impedance tracing based on the model (solid line) after inserting the matching network. Good agreement between both impedances over the frequency range (0.1–10 GHz) is achieved.
Optimum input impedances based on negative-image model (solid line) and after adding IMN (symbols).

Since the main design goal for broadband PA is to meet the requirements in the frequency range from 0.3 GHz for Digital Video Broadcasting - Terrestrial (DVBT) and Terrestrial Trunked Radio (TETRA) applications toward wireless standard systems, GSM, UMTS, CDMA, WiMAX, and satellite applications up to 8 GHz, the optimum PA performance is specified for these applications.
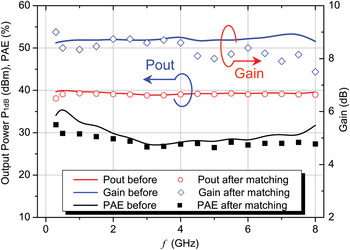
PA gain and output P 1dB power before and after adding IMN is presented in Fig. 10. The diagram shows a very broadband gain and power performance with gain of 8–9 dB and Min. 1dB output power of 38.8 dBm in the frequency range (0.3–8 GHz). Maximum gain loss of 1 dB and power loss of 0.8 dB at low frequency (caused by gain compensation) can also be observed.
PA gain and 1 dB output power performance before, after IMN versus frequency.

V. FABRICATION AND BROADBAND PERFORMANCE
The last step in the design procedure before fabrication is to simulate the whole PA structure based on a 2D momentum simulator with fractional tuning at the input side for further gain flatness improvements.
Based on Rogers material RO4003 with a dielectric constant of 3.38 and a dielectric thickness of 0.51 mm, the prototype was fabricated and the die (CGH60015D) of 1 mm2 and 0.1 mm thickness was bonded to the IMN and OMN using 25 µm gold wires as recommended by the manufacturer. The gold-plated ground layer of the die was mounted on a golden flange, which can be fixed easily to the main heat sink. Figure 11 illustrates the PA prototype and the bonded die used in the design. In the next section, broadband small signal, power, and linearity performance of the designed PA will be introduced and discussed.
PA prototype: (a) schematic diagram of the designed PA, (b) fabricated design using microstrip material from Rogers, and (c) the bonded die from Cree.

A) Small signal performance
Small signal performance of the implemented amplifier was done at V D = 36 V and I D = 600 mA. Figure 12 illustrates the simulated and measured small signal gain, input and output return losses in the frequency range (0.1–9 GHz). The figure shows an ultra-broadband performance with a gain of 8.5 ± 0.5 dB, output return loss of less than −8 dB (except for 0.9 GHz) over the bandwidth (0.3–8 GHz). Input return loss was not one of the design goals in this work because a driver stage with output power of 3–4 W is needed to increase the overall gain. The measured input return loss of −5 dB in the frequency range (1.5–8 GHz) can be observed. Very good agreement between simulations and measurements which reflects the design accuracy can also be observed.
Simulated (solid lines) and measured (symbols) small signal gain, input, and output return losses versus frequency.

B) Power performance
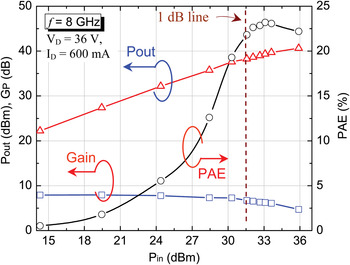
In this section, power performance of the implemented amplifier was done at V D = 36 V and I D = 600 mA. To measure power performance in the compression and saturation regions, one needs a driver stage of ~3–4 W output power to establish the measurements. Such a specification that covers the operating bandwidth does not exist in the market. The solutions were either to use multi drivers with different frequency ranges or to design an exact replica of the designed PA, which in this case was the simplest way to do. Furthermore, as will be discussed later, a combined PA structure was built based on the designed PA's and a broadband Wilkinson combiner that was designed for this purpose. The designed PA achieved 8 dB gain, greater than 38 dBm P out-1dB, 40 dBm (10 W) P max, 23% power added efficiency (PAE), and covers the frequency range (0.3–8 GHz). Figures 13 and 14 show the PA power performance, representing output power (P out), gain, and PAE with sweeping input power at 0.3 and 8 GHz, respectively. At 1 dB compression point, an output power (P out-1 dB) of 38.9 dBm and power gain (Gain-1 dB) of 7.4 dB at an input power level of ~31.5 dBm were measured at 300 MHz as shown in Fig. 13. P out-Max of 42 dBm and PAE-Max of 36% were also achieved as shown in the figure. Figure 14 illustrates the PA power measurements at 8 GHz. At an input power of ~31.5 dBm, a 1 dB compression point is measured and at this point P out-1 dB of 38 dBm and Gain-1 dB of 6.5 dB are obtained. P out-Max of 40 dBm and PAE-Max of 23% are also achieved.
Measured PA power performance versus input power at 300 MHz.

Measured PA power performance versus input power at 8 GHz.

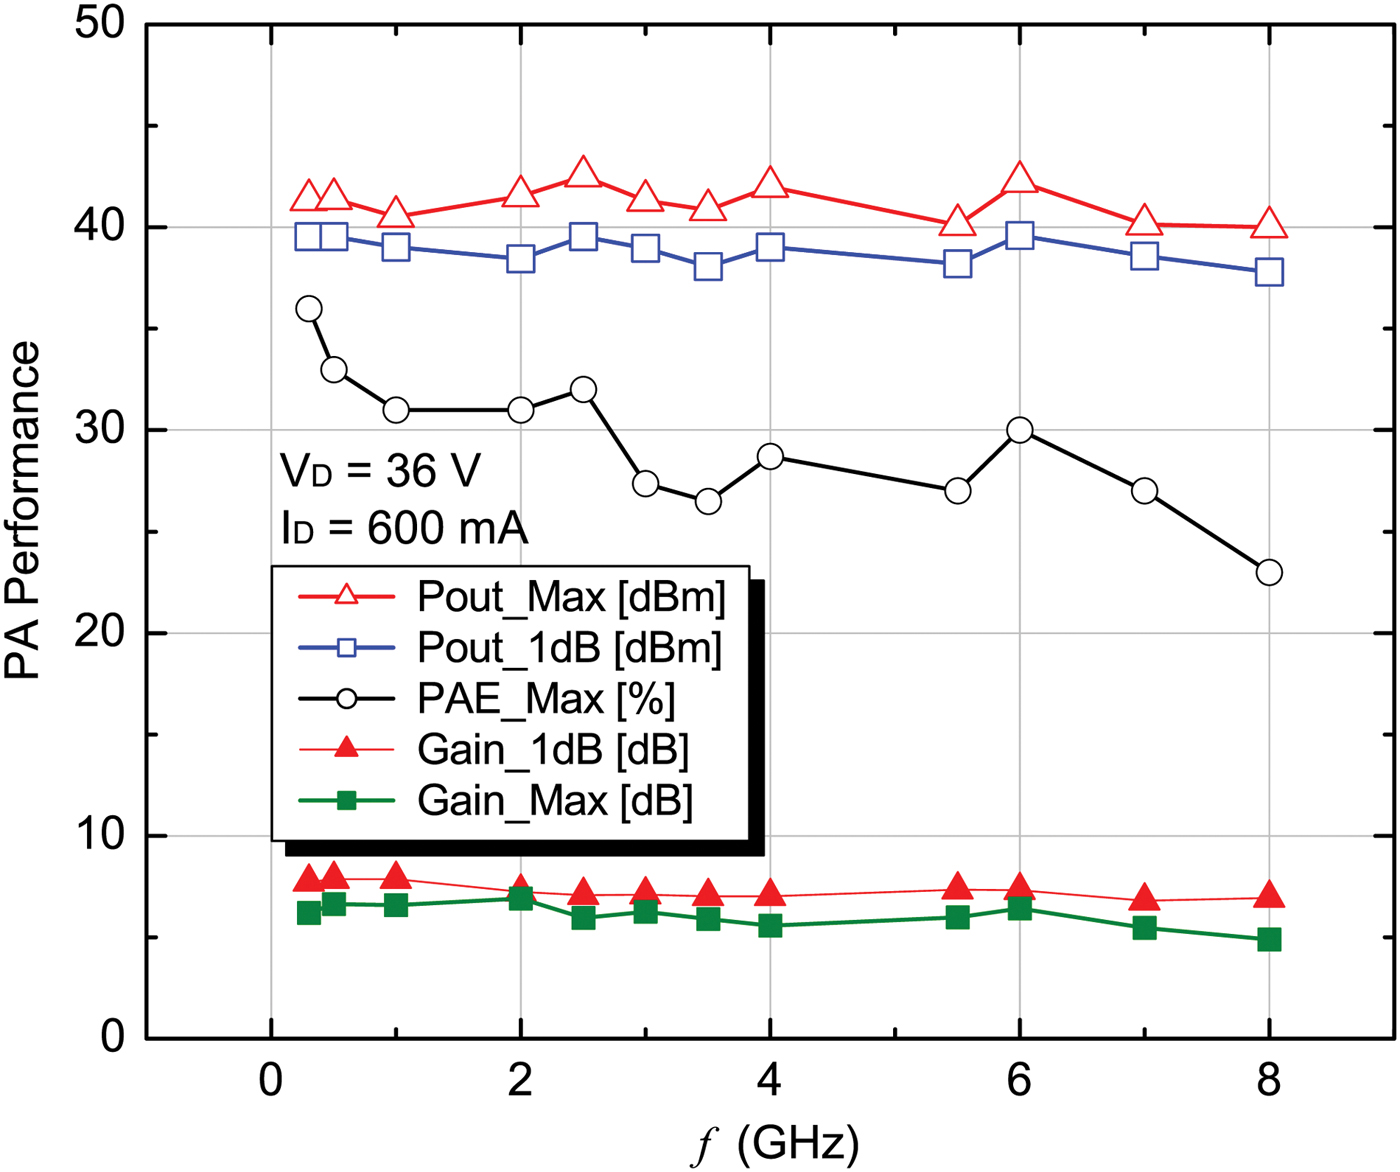
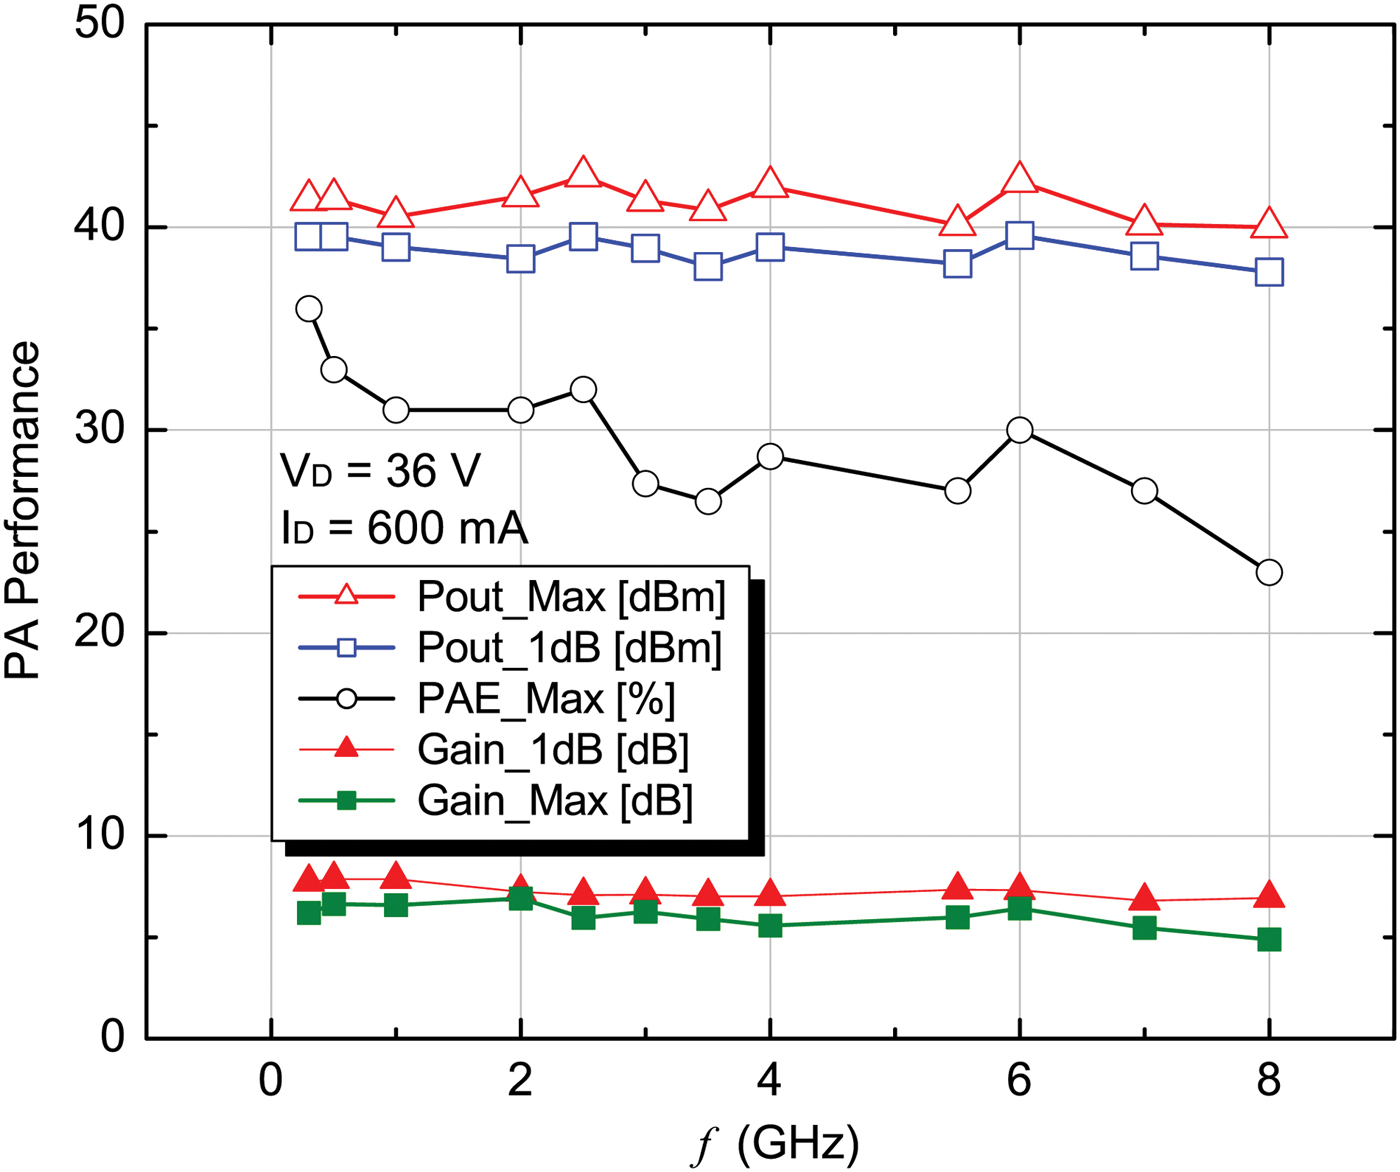
Extraction procedure for PA power performance has been conducted over the operating bandwidth and depicted in Fig. 15. The figure shows an excellent broadband power performance regarding the gain flatness (Gain-1 dB: 6.5–8 dB), the output power at 1 dB compression (P out-1 dB: 38–38.9 dBm). However, the extracted maximum output power (P out-Max) values lie between 40 and 42 dBm over the operating bandwidth. PAE-Max was also extracted over the bandwidth as shown in Fig. 15. The efficiency performance of the implemented PA shows 23–33%, which can be accepted for the class A PA.
Measured PA broadband power performance.
C) Linearity performance
Linearity performance of class A PA is very important and has to be characterized too. This section introduces the PA linearity performance based on a two-tone technique, AM/AM and AM/PM based on modulated signals. Figure 16 shows the resulted output power/tone for the fundamental (P1), second (P2), and third-harmonics (P3) versus the input power at 6 GHz and a frequency spacing (f s) of 100 kHz. On the bottom corner of Fig. 16, a screen shot of two-tone characterization at an input power level tone = 20 dBm is included. The power diagram shows a linear dynamic region (low power level – 22 dBm/tone), resulting in an accurate extraction for both second- and third-order intercept points. At high input power levels >22 dBm/tone, both second and third harmonics started their compression performance; consequently, the two-tone measurements in this quasi-linear region result in inaccurate output intercept points (OIP). From the diagram, output second-order intercept points (OIP2) and output third-order intercept points (OIP3) of >64 and 46 dBm were extracted. The two-tone technique was repeated over the whole bandwidth to prove the linearity-broadband performance. Figure 17 presents the extracted OIP2 and OIP3 in the frequency band (0.3–8 GHz) with a tone spacing of 100 kHz.
Measured fundamental (P1), second- (P2), and third- (P3) harmonics versus input power/tone at 6 GHz and frequency spacing (f s) = 100 kHz, on the bottom corner: a spectrum analyzer (PSA) screen shot at an input power level = 20 dBm/tone.

Extracted OIP3 over the frequency band with frequency spacing of 100 kHz.

The diagram shows OIP3 values of 6–7 dB above the 1 dB compression and minimum OIP2 value of 64 dBm over the bandwidth, which is accepted for most RF power applications. The implemented PA was characterized at different frequency spacing (10 kHz–5 MHz) and the corresponding results show almost constant performance of ≥45 dBm among the measured OIP3 values.
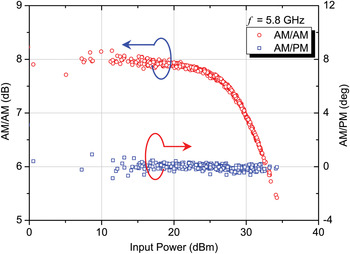
An input of 10 MHz modulated signal was used to characterize PA memory effects based on AM/AM and AM/PM conversions. Figure 18 illustrates AM/AM and AM/PM conversions at 5.8 GHz for WiMAX applications. The results show good linearity performance and maximum amplitude difference of ±0.5 dB and maximum phase difference of ±4° can be observed.
AM/AM and AM/PM conversions of the designed PA at 5.8 GHz based on modulated input signal of 10 MHz.

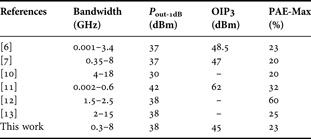
The PA performance based on the suggested approach was compared with linear, multi-octave bandwidth PA's. Table 2 introduces the comparison with this work from the bandwidth, output power, linearity, and efficiency points of view.
Summary of published PA performances.
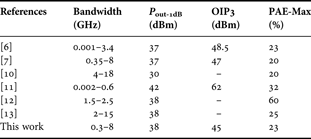
Compared with other PA performances, this work has higher P out-1 dB and PAE-Max (compared with [Reference Sayed, Al Tanany and Boeck7]), ultra wideband (compared with [Reference Sayed, Al Tanany and Boeck7, Reference Wright, Lees, Benedikt, Tasker and Cripps12]). Linearity performance based on OIP3 with ≥45 dBm over the bandwidth can also be accepted.
VI. BROADBAND WILKINSON COMBINER AND POWER MODULES
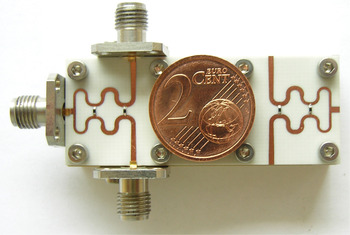
Output power of the designed PA's can be extended. Since the two designed amplifiers have the same power performance, a symmetrical 50 Ω broadband Wilkinson combiner was developed for this purpose. The Wilkinson combiner was analyzed based on a multi-section technique and synthesized using microstrip technology on ADS [Reference Dib and Khodier14]. The combiner has been miniaturized and implemented on Rogers RO4003 as shown in Fig. 19 and its corresponding performance is presented in Fig. 20.
Prototype of the designed broadband Wilkinson combiner.

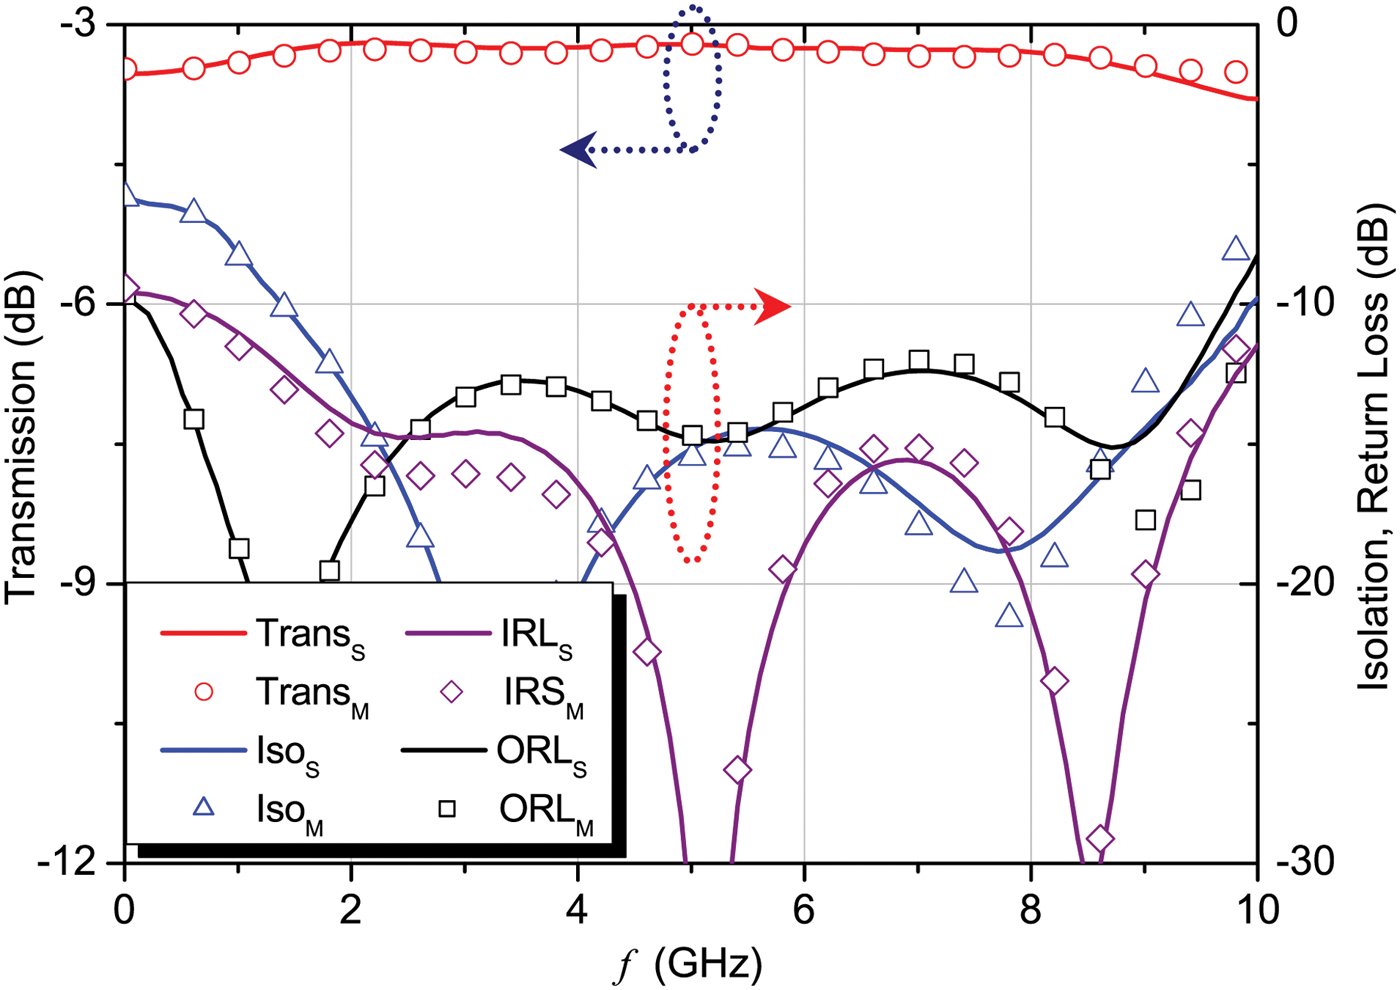
Measured (symbols) and simulated (solid lines) transmission, isolation, and return losses of the designed Wilkinson combiner.
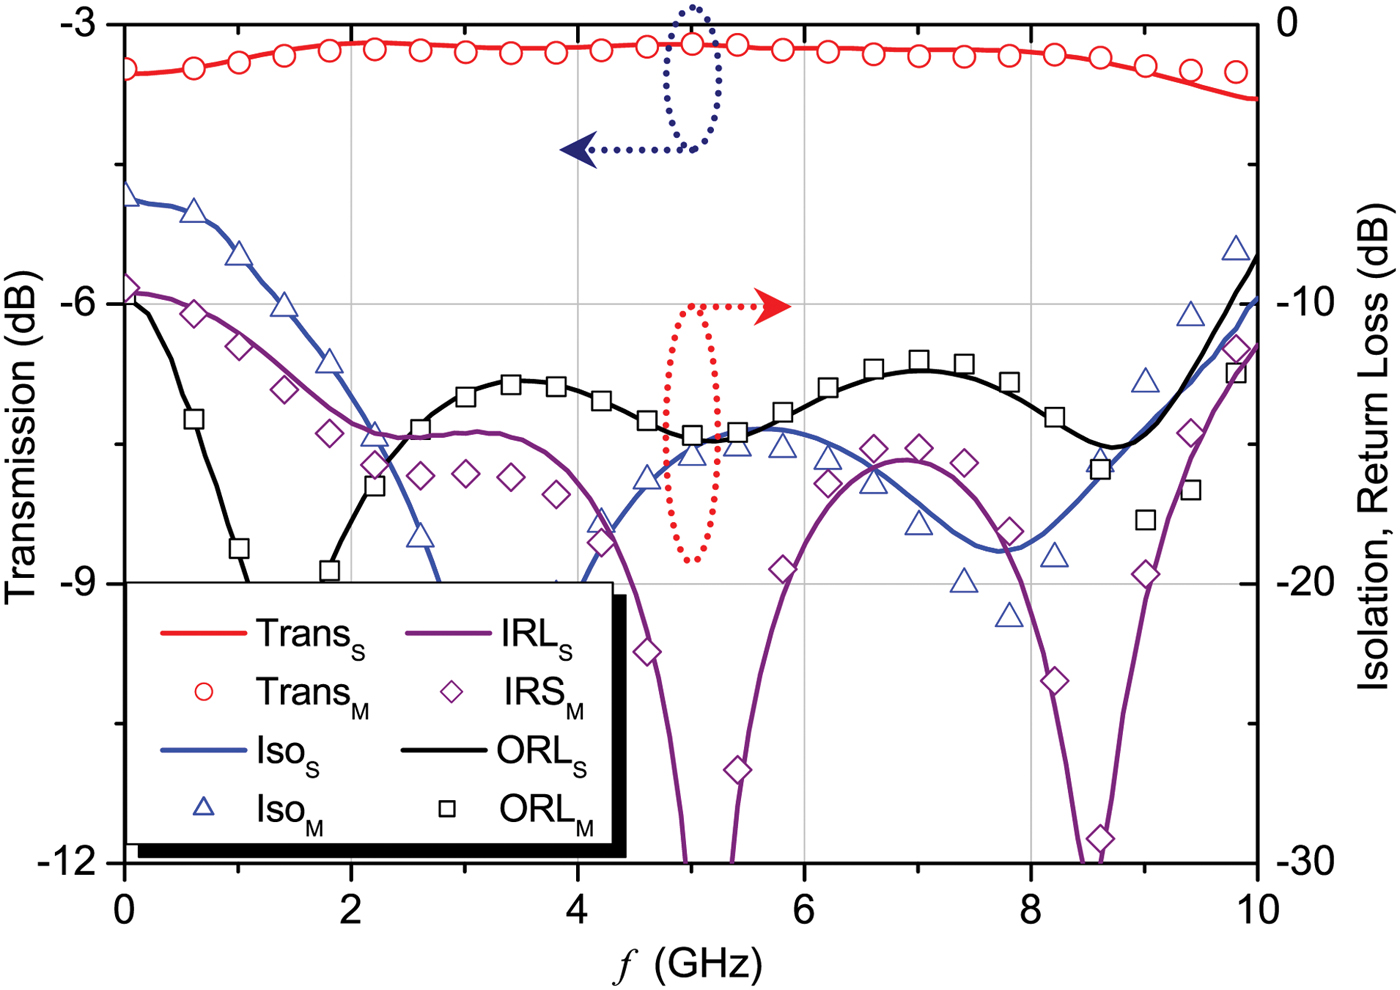
The combiner performance showed very good input and output return losses of less than −10 dB up to 9 GHz, port-isolation of −6 dB in the low-frequency band, and −10 dB up to 9 GHz. In addition, a very low transmission loss ≤0.5 dB over the operating bandwidth 0.1–9 GHz is achieved. Since the design was synthesized and optimized based on a 3D High Frequency Structure Simulator (HFSS) simulator, excellent agreement between simulations and measurements is obtained.
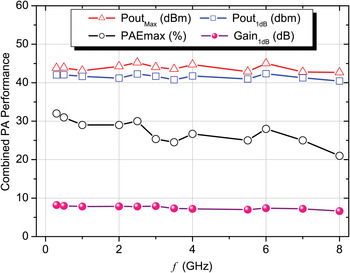
The combined broadband PA module for extending the output power was mounted and measured in the frequency range (0.3–8 GHz). Figure 21 presents the broadband 1 dB and the saturated output power performance of the combined PA at V D = 36 V and I D = 600 mA for each transistor. The diagram shows P 1dB and maximum output power of 40.5 dBm and 42.7 dBm at 8 GHz, respectively. Gain at 1 dB compression point ≥6 dB and PAE values >21% over the operating bandwidth can also be achieved. The results show a significant broadband performance based on the combined power module.
Measured power performance of the combined PA module over the frequency band 0.3–8 GHz.

VII. CONCLUSIONS
In this paper, an efficient technique for optimizing high power, linear broadband PA performance based on source-, load-pull technique up to third-harmonics of the highest frequency limit was demonstrated and discussed. The approach has been verified by designing a broadband, 0.3–8 GHz, 10 W linear PA based on GaN HEMT die from Cree. The implemented amplifier achieves a saturated output power of ≥10 W, linear gain of 8.5± 0.5 dB, and PAE-Max of ≥23% over the whole bandwidth. Linearity performance based on two-tone technique for OIP2 and OIP3 was accomplished and minimum values for OIP2 and OIP3 of 64 and 45 dBm, respectively, over the bandwidth have been achieved. AM/AM and AM/PM have also been characterized using a modulated signal of 10 MHz bandwidth at 5.8 GHz for WiMAX applications and the results show good linearity performance. Finally, a broadband Wilkinson combiner, which covers the same frequency band with very low loss was also designed for extending the power based on two identical amplifiers. The combined PA performance shows 17–20 W output power in the operating bandwidth.
Acknowledgement
The authors thank GloMic GmbH, Berlin for helpful discussions and advice, and for supporting this project.
 Ahmed Sayed was born in Cairo, Egypt, in 1970. He received the Bachelor degree in communication systems from Helwan University in 1992 and the M.Sc. degree in microelectronics and communication systems from Cairo University in 1997, and the Ph.D. degree from the Berlin Institute of Technology in 2005. His research activities focused on power amplifier (PA) design based on wide-bandgap (WBG) technology. Since 2005, Dr Sayed has been with the Microwave Engineering Group, Berlin Institute of Technology, Germany, and has participated in several projects in broadband, linear, and efficient PAs. In 2010, Dr Sayed joined the GloMic company in Berlin where he developed high-efficiency PA ballets (ballets, means RF design without DC control) for UMTS and LTE applications.
 Sebastian Preis was born in 1985 in Berlin, Germany. He received the B.E. degree in communication systems from the University of Applied Science Berlin, Germany in 2009 and the M.Sc degree in computer engineering from the Berlin Institute of Technology, Germany in 2011. Currently, he is working toward his Ph.D. degree with the Berlin Institute of Technology.
His main research areas are efficiency and bandwidth enhancement techniques as well as characterization of GaN-based PAs. He also focuses on the design of PA's in the high power class for various communication standards.
 Georg Boeck received the doctoral degree from the Berlin University of Technology, Berlin, Germany, in 1984. In the same year he joined Siemens Research Laboratories in Munich, Germany, where his research areas were fiber optics and GaAs electronics.
Since 1991, he has been the head of the Microwave Engineering Research Laboratory at the Berlin University of Technology. Since 2008, he has been with the Ferdinand-Braun-Institut (FBH) in Berlin, Germany, where he is the head of the business area microwave power modules. In 2009, he was a co-founder of GloMic GmbH. His main areas of research are PAs, microwave devices, circuits, and systems up to and beyond the 100 GHz range.
Prof. Boeck has authored or co-authored more than 270 technical papers and one book. He served as IEEE Distinguished Microwave Lecturer during the years 2006–2008, as Associate Editor of the Journal “IEEE Microwave and Wireless Components Letters” in 2008 and 2009 and as Guest Editor of the “IEEE Journal of Solid State Circuits” in 2012. He is a member of several technical program committees, a member of the editorial board of the Journal “Frequenz”, and a Steering Committee member of the IEEE Radio Frequency Integrated Circuit Symposium. He was the chairman of the IEEE-conferences “GeMIC 2010” and “PRIME 2010”.