




No CrossRef data available.
Article contents
Parasitism and growth in the earthworm Lumbricus terrestris: fitness costs of the gregarine parasite Monocystis sp.
Published online by Cambridge University Press: 01 November 2004
Abstract
Parasites inflict fitness costs on their hosts, but often the exact reduction in fitness is not well understood. We investigated the influence of infection by the gregarine genus Monocystis sp. on growth and female investment (cocoon production) of its earthworm host, Lumbricus terrestris. Earthworms (n=81) were observed in a laboratory setting for 8 months, after which parasite load was determined. The results revealed a significant negative relationship between parasite load and growth, yet no association to cocoon production was found. Although the exact nature, strength, and evolutionary consequence of reduced growth are still unclear, the results are the first indication for a clear, albeit weak effect of Monocystis on host fitness.
Keywords
Information
- Type
- Research Article
- Information
- Copyright
- 2005 Cambridge University Press
INTRODUCTION
The precise relationship between a host and its parasite is a result of numerous evolutionary processes because parasites often represent a significant selective pressure. Infection of Lumbricus terrestris by Monocystis sp. is a well-known host--parasite system, yet relatively little is known about the costs incurred and a consensus on the pathogenicity of Monocystis infection is yet to be reached.
Recently, Reinhart & Dollahon (2003) showed that L. terrestris coelomocytes (i.e. the main effector cells in earthworm immunity) are capable of recognizing Monocystis in vitro as ‘non-self’. Goldova & Breza (1999) claim Monocystis to interrupt reproduction and cause host death. Pižl (1985) reported that herbicide application was associated with increased Monocystis levels indicating the earthworm's immune system was adversely affected – indirectly suggesting that Monocystis is likely not a harmless symbiont. Sims & Gerard (1985) maintain that, in rare cases, infection may spread to the testes and the worm may become castrated. However, in the same reference they report that gregarines typically have low fitness effects on their hosts and ‘pathological conditions are rare’. Bush et al. (2001) concurred stating that members of the Gregarinidae rarely harm their invertebrate hosts and conclude the association is an old and benign one. Farmer (1980) referred to Monocystis as ‘completely non-pathogenic’. Our previous studies in this system also failed to show short-term effects on host copulation rate or growth (Field, Schirp & Michiels, 2003). Alone the commonness of infection (97%, see below) is suggestive of a parasite with limited effect. On the other hand the extreme variability in the intensity of infection (Field et al. 2003, 2004) could be interpreted as resulting from a balanced polymorphism in host resistance due to a presumed trade-off between resistance costs (Webster & Woolhouse, 1999; Adamo, Jensen & Younger, 2001; Rolff & Siva-Jothy, 2003; Schmid-Hempel, 2003), and infection costs.
L. terrestris is an obligatory outcrossing, simultaneous hermaphrodite which lives in vertical burrows (Edwards & Bohlen, 1996), whose biology has been thoroughly studied during the past century particularly in behaviour and immunology (Grove, 1925; Cooper et al. 1969; Bilej et al. 1995; Kauschke et al. 1997; Nuutinen & Butt, 1997; Butt & Nuutinen, 1998; Michiels, Hohner & Vorndran, 2001) and recently has been promoted as a model for studying innate immune responses from an evolutionary perspective (Cooper & Roch, 2003). Selection pressures, such as soil contamination and predation, are also well studied (Cikutovic et al. 1993; Meier et al. 1997; Hanna & Weaver, 2002) yet those resulting from parasitism by Monocystis are virtually unstudied.
The seminal vesicles of L. terrestris, where self-sperm is stored, almost universally contain cysts of the protozoan genus Monocystis sp. In a recent metapopulation study, combined parasite prevalence was 97% (n=198) and ranged from 87–100% within populations (n=14; S. Field, unpublished observations). Worms typically become infected by ingestion of contaminated soil particles. For details on the parasite life-cycle see Schmidt & Roberts (2000), Bush et al. (2001) and Field et al. (2003). Although common, horizontal transmission is not required to complete the parasite's life-cycle as it can be completed within the seminal vesicles of a single host.
This is the first study to examine the long-term effects of Monocystis infection in L. terrestris. Traditional studies that attempt to determine parasite-induced fitness costs involve infection of parasite-free individuals followed by controlled observation of correlated fitness traits. Since parasite-free individuals cannot be obtained from the field and are difficult to raise in the laboratory in large numbers (S. Field, personal observation), we assessed fitness costs by correlating growth and fecundity with naturally occurring variation in parasite load. Although a correlative approach like this cannot offer a clear cause-and-effect relationship, it is an initial investigative step.
MATERIALS AND METHODS
In September 2002, ninety-six sexually mature (clitellum present) L. terrestris of Canadian origin were obtained from a commercial supplier, isolated and placed into their own burrow within the set-up (Fig. 1). To recreate the characteristic vertical burrows of L. terrestris, worms were placed in PVC cable boxes (45×3×1·5 cm) filled with garden soil (salt <1·5 g/l, pH=5–6·5, nitrogen: 100–300 mg/l, phosphate: 100–300 mg/l, potassium: 100–400 mg/l). The bottom ends of the tubes were secured with duct tape punctured with small holes, which allowed water to enter. A square hole (3×1·5 cm) was cut into the bottom of a plastic, wide-mouthed (9 cm diameter) bottle (Roth, 750 ml) and was securely attached to the top of each ‘burrow’ to prevent escape above. These plastic bottles were lined with a 1 cm layer of packed soil to provide a foraging surface for the earthworms. The top of the bottle was open and allowed free exchange of air at the surface. The artificial burrows were then placed in 1 of 4 large plastic Tupperware® containers (50×33×21 cm), each with 24 holes (3×1·5 cm) in the lid. Into each plastic container 4 cm of Seramis® (Effem GmbH, Germany) was then placed and saturated with deionized water. Tubes were then buried into the Seramis® which allowed moisture to enter the burrow column (Fig. 1). These 4 units were placed in a climate chamber at 14 °C with a 12 h dark:light cycle. Since previous studies showed a decrease in survivorship following decreased cocoon production (Butt & Nuutinen, 1998) and parasite load can only be determined from living specimens, it was decided a priori that the study would end as soon as cumulative cocoon production began to plateau. Worms were fed strips of frozen lettuce ad libitum.

Fig. 1. Schematic drawing of the study set-up from above (left) and from the side (right). Plastic bottles at the top of the artificial burrows were 9 cm in diameter and provided a foraging surface, yet were high enough to prevent escape from the top. Four such boxes were arranged in 2×2 and their position was rotated weekly. Earthworms were fed frozen lettuce and the surface sprayed with deionized water daily (see Materials and Methods section).
Before data were collected, earthworms were allowed to acclimate to their new environment for 2 months (Sept. and Oct.), followed by an observation period of 8 months. Soil was removed and exchanged monthly, during which earthworms were weighed, the soil sieved for cocoon production, and the worms returned to their burrow with fresh soil. Collected cocoons were isolated and placed into 24-well culture plates, which were half filled with moistened cellulose where hatching could be recorded. Fifteen worms died during the course of the study; 5 during the initial 2-month phase and the remaining 10 died sporadically throughout the rest of the study. Since dead worms were only recovered once per month, and were typically fully disintegrated when discovered, it was not possible to obtain data on parasite load in these individuals. As a result, these individuals had to be excluded from the analysis. Growth was calculated as final worm mass minus the mass on day 1 of the study (initial mass).
After the final month (June 2003), cocoons were collected as described and worms were weighed and frozen at −80 °C before dissection and parasite determination. Sporocyst concentration was determined by removing the seminal vesicles, homogenizing them, and counting them using a haemocytometer (Assistant; Thoma model). For a detailed description of the parasite determination protocol see Field et al. (2003, 2004). Measures of parasite load are reported as concentration (sporocysts/μl) to correct for seminal vesicle size.
For statistical analysis parasite load was log-transformed to achieve a normal distribution and parametric tests were used when the underlying assumptions were met. Data collected during the adjustment period were not included in analyses. Means are reported as

unless otherwise stated. Box & Whisker plots show the median (mid-line), mid-quartile range (box), and range (whiskers) excluding outliers (shown separately). For t-tests the Levene's test of equal variance was used to decide whether equal or unequal variances had to be assumed (different calculations for t). Correlations are indicated as Pearson (r) or Spearman (rs). For some analyses individuals were separated into 3 parasite infection categories representing the lowest 25% (n=20), middle 50% (n=41), and highest 25% (n=20), (i.e. similar to Box & Whisker plot divisions). Statistical analyses were carried out using SPSS® (v11.5).
RESULTS
All individuals (n=81) were infected with Monocystis. As expected, parasite load varied greatly ranging from 2·61×105–4·01×107 parasite sporocysts per individual (

sporocysts/individual).
Mean worm mass increased steadily until the end of the study for all parasite categories (Fig. 2A). Mean growth across the study period was 2·25±1·35 g (n=81) and ranged from −1·19 to 5·35 g. There was a significant negative relationship between parasite load and growth (rs=−0·24, n=81, P=0·035; Fig. 3) and this relationship remained significant when correcting for initial mass (partial correlation r=−0·26, n=81, P=0·02). Furthermore, there was a significant negative relationship between parasite load and final mass (r=−0·26, n=81, P=0·021).

Fig. 2. Earthworm growth and female investment during the study period. Following the study, individuals were separated into 3 classes according to parasite load that represent the lowest 25% (□) (n=20), middle 50% () (n=41), and highest 25% () (n=20). (A) Mean earthworm mass increased steadily throughout the study. A t-test (D.F.=38) showed that the lowest and highest parasite categories did not differ in the beginning (P=0·43) but were statistically different at the end of the study (P=0·02). (B) A similar increasing pattern can be seen with respect to female investment (i.e. cocoon production): however, none of the categories were statistically significant (all months; P>0·14). Diamonds correspond to outliers.

Fig. 3. Relationship between parasite load and growth. Growth was calculated as final – initial mass and parasite load is the natural log-transformed sporocyst concentration (no./μl) in the seminal vesicle fluid. A significant negative relationship exists suggesting a cost of infection by Monocystis sp.
Mean cocoon production increased progressively until the sixth month of the study, where there was an unexplained decrease in production; thereafter it continued to increase until the study was terminated (Fig. 2B). Cocoon production did not significantly differ between parasite categories for all months of the study. During the study 1,157 cocoons were collected and 74% (60 of 81) of worms produced cocoons. The mean number of cocoons produced per worm was 14·3±12·4 (n=81) and ranged from 0–45. Mean monthly cocoon production per worm was 1·79±1·55. Furthermore, large individuals produced significantly more cocoons (r=0·32, n=60, P=0·014), however, extremely large worms apparently produced cocoons at a reduced rate (Fig. 4). In this light we performed a quadratic polynomial regression analysis with mean earthworm mass as the independent variable and total cocoon production as the dependent variable (cocoon producers only; R2=0·15). This function explained more of the variation than a linear (R2=0·101), exponential rise (R2=0·053), or logarithmic (R2=0·114) functions. Results continued to show a strong relationship between size and cocoon production (F2,57=4·79, P=0·012). Finally, when analysing the residual cocoon production (corrected for mean earthworm mass – see above) against growth there was no evidence of a trade-off (r=−0·17, n=60, P=0·19).

Fig. 4. Box-plot depicting the relationship between mean earthworm mass (size) throughout the study and total cocoon production (female investment) during the entire study. Mass class refers to the mean mass of an individual throughout the study broken down into groups. From the fitted quadratic polynomial function (see Results section) we were able to calculate the approximate maximum cocoon production size to be 6·67 g (fitted regression equation: f(x)=2·043x2−27·215x+68·277). Diamonds correspond to outliers.
Final parasite load did not have a significant negative correlation with total cocoon production (rs=0·06, n=81, P=0·63). This relationship remained non-significant when excluding individuals that did not produce cocoons (total cocoon production r=−0·14, n=60, P=0·28) and when controlling for mean size (partial correlation r=−0·12, n=60, P=0·37). There was also no significant relationship when only considering cocoon production in the final month (i.e. after which parasite load was determined) (partial correlation r=−0·17, n=60, P=0·18). Individuals that did produce cocoons had higher parasite loads compared to non-producers (10·8±1·00 and 10·2±1·25 respectively; t-test; t=1·99, D.F.=79, P=0·049). This did not appear to be due to a difference in maturity as producers (n=60) and non-producers (n=21) differed neither in mean mass (tuneq.var.=1·45, D.F.=25·7, P=0·16) nor in initial mass (t-test; t=1·22, D.F.=79, P=0·23).
Sixty-four percent (52 of 81) of worms produced live offspring and accounted for the 394 successfully hatched cocoons of the study. Mean hatchling number among cocoon producers was 5·11±6·15 (range=0–27), yet the proportion of cocoons that hatched successfully (hatchability) varied greatly between 0·0 and 1·0. In the extreme, 1 individual produced 26 infertile cocoons. In such cases the spermathecae were checked and the presence of allosperm was confirmed. The results showed no relationship between parasite load and both the total number of hatched offspring (r=−0·22, n=52, P=0·11) and hatchability (r=−0·15, n=52, P=0·29).
DISCUSSION
To our knowledge, this study is the first to directly suggest a fitness cost of Monocystis infection in L. terrestris: strong infections seemed to impede growth. Lower growth rate could represent a fitness cost since mating success and mate choice with respect to size has been shown in many hermaphrodite systems (Peters & Michiels, 1996; Lüscher & Wedekind, 2002; Angeloni, Bradbury & Burton, 2003). Moreover, previous studies in other hermaphrodites, as well as other systems, showed that fecundity increases with size (Baur, 1992; DeWitt, 1996; Wedekind, Strahm & Schärer, 1998; Schärer et al. 2001). In a previous study, copulation success was also positively associated with size (Field et al. 2003). Although we observed a reduction in cocoon production in extremely large individuals, it is relatively uncommon to observe such individuals in the field (S. Field, unpublished observations) where resources, unlike in our study, are limited. In natural settings, individuals of above average size, (1) have an increased radius in which to forage for surface litter, (2) have a potentially larger variety of prospective mates, and (3) are at reduced risk of being pulled from their burrows when mating (a predation risk, Michiels et al. 2001). Therefore, it is likely that parasite-mediated growth reduction does represent a fitness cost via reduced reproductive success (fecundity and/or copulation success) or reduced survivorship.
We confirmed that size strongly affects cocoon production, which supports our previous study that reproductive output is linked to size in L. terrestris (Field et al. 2003). Yet parasite load did not affect cocoon production (i.e. female investment) during our study. Furthermore, we found that cocoon producers had significantly higher parasite loads than non-producers, which at first seems counter intuitive. These data suggest a trade-off between fecundity and resistance, rather than fecundity and parasite load.
Earthworms were purchased, thus relatively little is known about their historical and/or genetic background (e.g. we could not control for host genotype). Thus, for example, the study may have included genotypes of differing life-history strategies (e.g. age at first reproduction, reproductive rate, etc.). More resistant host genotypes invest in immunity – and pay immune costs – to avoid the direct costs of parasite infection, yet pay the indirect costs of reduced reproductive output (i.e. a trade-off). In contrast, hosts who do not mount an immune response, do not invest in defence, and in effect ‘tolerate’ the direct costs of infection. These individuals therefore only pay the direct costs of infection and use the remaining energy for cocoon production. If the direct costs of parasitic infection are relatively weak, the net result of these two strategies may be that all individuals have similar cocoon production but very different parasite loads, resulting in no correlation between the two. In other words, there may have been a masking of the trade-off between parasite load and reproduction as individuals combine – and trade off – differing strategies with regard to resistance costs, reproductive costs, and infection costs.
A second explanation has become known as the house-car effect (van Noordwijk & de Jong, 1986). In economic terms, there is an assumed trade-off between purchasing an expensive house or an expensive car. Yet in practice one often sees expensive cars parked in front of expensive houses (and vice versa). This is due to budget differences. If there is high resource variation in the population, despite the presence of a trade-off between two traits within an individual, a positive (or no correlation) can be observed between individuals (van Noordwijk & de Jong, 1986). This phenomenon concerns our study in that, although worms were fed ad libitum, some worms did consume more than others, which would increase resource variation between individuals. Yet another compounding factor associated with feeding ad libitum is that a trade-off may only become detectable under stressful conditions (Bell & Koufopanou, 1986). When resources are essentially unlimited individuals may not be forced to trade off opposing life-history traits. The two effects mentioned above, alone or in concert, may have affected our results since earthworms were fed in excess.
Furthermore, if age is more influential on parasite load than immunocompetence, younger worms that have not had enough time to develop elevated infections, would have lower parasite loads and at the same time would grow faster simply because they are in a high-growth phase of their life-cycle, producing the observed relationship between growth and parasite load. However, this hypothesis is unlikely for two reasons. One, growth and initial mass were uncorrelated (r=−0·062, n=81, P=0·58). Two, the negative relationship between size and parasite load refutes this hypothesis, since if correct, younger (smaller) worms should have the lowest parasite loads, not the highest.
In a similar study, Thomas & Poulin (1998) were able to demonstrate a fitness cost in a bivalve (Austrovenus stutchburyi) by its trematode parasite (Curtuteria australis). Their study found that parasite load was associated with decreased burying ability and that individuals on the sediment surface were more susceptible to predation. However, as with our study, they were only able to determine parasite load following the study, knowing little about the history of infection. Thus, it could simply be that individuals initially differed in overall quality. Those individuals of lower quality not only grew slower (or buried themselves slower), but also were more likely to develop high infections. Thus high infections and poor growth (or digging ability) may be independent consequences of poor condition in these animals.
Lastly, parasite-induced fitness costs can take many forms. For example, gigantism (Arnott, Barber & Huntingford, 2000) or – as in our study cocoon producers had higher parasite loads – fecundity compensation, where it may be advantageous for an infected host to increase current reproduction if they are going to suffer parasite induced mortality anyway (Krist & Lively, 1998). In this sense, it is regrettable that parasite load cannot be determined from dead individuals.
In summary, this study gained preliminary insights into the effects of the gregarine sporozoan Monocystis sp. on its earthworm host. We show correlative evidence supporting a fitness cost of infection in the L. terrestris – Monocystis system although the strength of this association remains unclear. Experimental studies with manipulated treatments to corroborate or refute these results are essential. Since earthworms are extremely important members of terrestrial ecosystems, these findings have practical value in areas such as agriculture, bio-remediation, and eco-toxicology.
We thank Gregor Schulte for valuable aid in dissecting samples, Jan Heuschele and Martin Hasshoff for caring for the set-up and feeding of the earthworms, Jennifer Barfield for the countless weekends with dirty hands, and to Thomas D'Souza for statistical advice. We also thank Hinrich Schulenburg and two anonymous referees for comments on previous versions of the manuscript. This study was funded by a grant from the German Science Foundation (DFG#: Mi 482/6-1).
References
REFERENCES
ADAMO, S. A.,
JENSEN, M. &
YOUNGER, M. (
2001).
Changes in lifetime immunocompetence in male and female Gryllus texensis (formerly G. integer): trade-offs between immunity and reproduction.
Animal Behaviour 62,
417–425.Google Scholar
ANGELONI, L.,
BRADBURY, J. W. &
BURTON, R. S. (
2003).
Multiple mating, paternity, and body size in a simultaneous hermaphrodite, Aplysia californica.
Behavioural Ecology 14,
554–560.CrossRefGoogle Scholar
ARNOTT, S. A.,
BARBER, I. &
HUNTINGFORD, F. A. (
2000).
Parasite-associated growth enhancement in a fish-cestode system.
Proceedings of the Royal Society of London, B 267,
675–663.CrossRefGoogle Scholar
BAUR, B. (
1992).
Random mating by size in the simultaneously hermaphroditic land snail Arianata arbustorum: experiments and an explanation.
Animal Behaviour 43,
511–518.CrossRefGoogle Scholar
BELL, G. &
KOUFOPANOU, V. (
1986).
The cost of reproduction. In
Oxford Series in Evolutionary Biology, 3rd Edn, (ed. Dawkins, R. & Ridley, M.), pp.
83–131.
Oxford University Press,
Oxford, UK.
BILEJ, M.,
BRYS, L.,
BESCHIN, A.,
LUCAS, R.,
VERCAUTEREN, E.,
HANUSOVA, R. &
DE BAETSELIER, P. (
1995).
Identification of a cytolytic protein in the coelomic fluid of Eisenia foetida earthworms.
Immunology Letters 45,
123–128.CrossRefGoogle Scholar
BUSH, A. O.,
FERNÁNDEZ, J. C.,
ESCH, G. W. &
SEED, R. J. (
2001).
Parasitism: the Diversity and Ecology of Animal Parasites.
Cambridge University Press,
Cambridge, UK.
BUTT, K. R. &
NUUTINEN, V. (
1998).
Reproduction of the earthworm Lumbricus terrestris Linné after first mating.
Canadian Journal of Zoology 76,
104–109.CrossRefGoogle Scholar
CIKUTOVIC, M. A.,
FITZPATRICK, L. C.,
VENABLES, B. J. &
GOVEN, A. J. (
1993).
Sperm count in earthworms (Lumbricus terrestris) as a biomarker for environmental toxicology – effects of cadmium and chlordane.
Environmental Pollution 81,
123–125.CrossRefGoogle Scholar
COOPER, E. L.,
ACTON, R. T.,
WEINHEIM, P. F. &
EVANS, E. E. (
1969).
Lack of a bactericidal response in earthworm Lumbricus terrestris after immunization with bacterial antigens.
Journal of Invertebrate Pathology 14,
402–406.CrossRefGoogle Scholar
COOPER, E. L. &
ROCH, P. (
2003).
Earthworm immunity: a model of immune competence.
Pedobiologia 47,
1–13.CrossRefGoogle Scholar
DEWITT, T. J. (
1996).
Gender contests in a simultaneous hermaphrodite snail – a size advantage model for behaviour.
Animal Behaviour 51,
345–351.CrossRefGoogle Scholar
EDWARDS, C. A. &
BOHLEN, P. J. (
1996).
Biology and Ecology of Earthworms, 3rd Edn.
Chapman and Hall,
London, UK.
FARMER, J. N. (
1980).
The Protozoa: Introduction to Protozoology.
C.V. Mosby Co.,
St Louis. USA.
FIELD, S. G.,
SCHIRP, H. J. &
MICHIELS, N. K. (
2003).
The influence of Monocystis sp. infection on growth and mating behaviour of the earthworm Lumbricus terrestris.
Canadian Journal of Zoology 81,
1161–1167.Google Scholar
FIELD, S. G.,
KURTZ, J.,
COOPER, E. L. &
MICHIELS, N. K. (
2004).
Evaluation of an innate immune reaction to parasites in earthworms.
Journal of Invertebrate Pathology 86,
45–49.CrossRefGoogle Scholar
GOLDOVA, M. &
BREZA, M. (
1999).
Earthworms (Lumbricidae) from the viewpoint of veterinary parasitology.
Folia Veterinary 43,
154–157.Google Scholar
GROVE, A. J. (
1925).
On the reproductive processes of the earthworm, Lumbricus terrestris.
Quarterly Journal of Microscopy Science 69,
245–290.Google Scholar
HANNA, S. H. S. &
WEAVER, R. W. (
2002).
Earthworm survival in oil contaminated soil.
Plant Soil 240,
127–132.CrossRefGoogle Scholar
KAUSCHKE, E.,
PAGLIARA, P.,
STABILI, L. &
COOPER, E. L. (
1997).
Characterization of proteolytic activity in coelomic fluid of Lumbricus terrestris.
Comparative Biochemistry and Physiology: Part B 116,
235–242.CrossRefGoogle Scholar
KRIST, A. C. &
LIVELY, C. M. (
1998).
Experimental exposure of juvenile snails (Potamopyrgus antipodarum) to infection by trematode larvae (Microphallus sp.): infectivity, fecundity compensation and growth.
Oecologia 116,
575–582.Google Scholar
LÜSCHER, A. &
WEDEKIND, C. (
2002).
Size-dependent discrimination of mating partners in the simultaneous hermaphroditic cestode Schistocephalus solidus.
Behavioural Ecology 13,
254–259.CrossRefGoogle Scholar
MEIER, J. R.,
CHANG, L. W.,
JACOBS, S.,
TORSELLA, J.,
MECKES, M. C. &
SMITH, M. K. (
1997).
Use of plant and earthworm bioassays to evaluate remediation of soil from a site contaminated with polychlorinated biphenyls.
Environmental Toxicology and Chemistry 16,
928–938.CrossRefGoogle Scholar
MICHIELS, N. K.,
HOHNER, A. &
VORNDRAN, I. C. (
2001).
Precopulatory mate assessment in relation to body size in the earthworm Lumbricus terrestris: avoidance of dangerous liaisons?
Behavioural Ecology 12,
612–618.Google Scholar
NUUTINEN, V. &
BUTT, K. R. (
1997).
Pre-mating behaviour of the earthworm Lumbricus terrestris L.
Soil Biology and Biochemistry 29,
307–308.CrossRefGoogle Scholar
PETERS, A. &
MICHIELS, N. K. (
1996).
Do simultaneous hermaphrodites choose their mates? Effects of body size in a planarian flatworm.
Freshwater Biology 36,
623–630.CrossRefGoogle Scholar
PIŽL, V. (
1985).
The effect of the herbicide Zeazin 50 on the earthworm infection by Monocystid gregarines.
Pedobiologia 28,
399–402.Google Scholar
REINHART, M. &
DOLLAHON, N. (
2003).
Responses of coelomocytes from Lumbricus terrestris to native and non-native eukaryotic parasites.
Pedobiologia 47,
710–716.CrossRefGoogle Scholar
ROLFF, J. &
SIVA-JOTHY, M. T. (
2003).
Invertebrate ecological immunity.
Science 301,
472–475.CrossRefGoogle Scholar
SCHÄRER, L.,
KARLSSON, L. M.,
CHRISTEN, M. &
WEDEKIND, C. (
2001).
Size-dependent sex allocation in a simultaneous hermaphrodite parasite.
Journal of Evolutionary Biology 14,
55–67.CrossRefGoogle Scholar
SCHMID-HEMPEL, P. (
2003).
Variation in immune defence as a question of evolutionary ecology.
Proceedings of the Royal Society of London, B 270,
357–366.CrossRefGoogle Scholar
SCHMIDT, G. D. &
ROBERTS, L. S. (
2000).
Foundations of Parasitology, 6th Edn.
McGraw-Hill Publishing,
Boston, USA.
SIMS, R. W. &
GERARD, B. M. (
1985).
Earthworms. Synopses of the British Fauna (new series): No. 31.
The Linnean Society of London and The Estuarine and Brackish-Water Sciences Association,
Brill and Backhuys, London, UK.
THOMAS, F. &
POULIN, R. (
1998).
Manipulation of a mollusc by a trophically transmitted parasite: convergent evolution or phylogenetic inheritance?
Parasitology 116,
431–436.Google Scholar
VAN NOORDWIJK, A. J. &
DE JONG, G. (
1986).
Acquisition and allocation of resources – their influence on variation in life-history tactics.
American Naturalist 128,
137–142.CrossRefGoogle Scholar
WEBSTER, J. P. &
WOOLHOUSE, M. E. J. (
1999).
Cost of resistance: relationship between reduced fertility and increased resistance in a snail–schistosome host–parasite system.
Proceedings of the Royal Society of London, B 266,
391–396.CrossRefGoogle Scholar
WEDEKIND, C.,
STRAHM, D. &
SCHÄRER, L. (
1998).
Evidence for strategic egg production in a hermaphroditic cestode.
Parasitology 117,
373–382.CrossRefGoogle Scholar

Fig. 1. Schematic drawing of the study set-up from above (left) and from the side (right). Plastic bottles at the top of the artificial burrows were 9 cm in diameter and provided a foraging surface, yet were high enough to prevent escape from the top. Four such boxes were arranged in 2×2 and their position was rotated weekly. Earthworms were fed frozen lettuce and the surface sprayed with deionized water daily (see Materials and Methods section).

Fig. 2. Earthworm growth and female investment during the study period. Following the study, individuals were separated into 3 classes according to parasite load that represent the lowest 25% (□) (n=20), middle 50% () (n=41), and highest 25% () (n=20). (A) Mean earthworm mass increased steadily throughout the study. A t-test (D.F.=38) showed that the lowest and highest parasite categories did not differ in the beginning (P=0·43) but were statistically different at the end of the study (P=0·02). (B) A similar increasing pattern can be seen with respect to female investment (i.e. cocoon production): however, none of the categories were statistically significant (all months; P>0·14). Diamonds correspond to outliers.
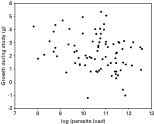
Fig. 3. Relationship between parasite load and growth. Growth was calculated as final – initial mass and parasite load is the natural log-transformed sporocyst concentration (no./μl) in the seminal vesicle fluid. A significant negative relationship exists suggesting a cost of infection by Monocystis sp.
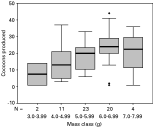
Fig. 4. Box-plot depicting the relationship between mean earthworm mass (size) throughout the study and total cocoon production (female investment) during the entire study. Mass class refers to the mean mass of an individual throughout the study broken down into groups. From the fitted quadratic polynomial function (see Results section) we were able to calculate the approximate maximum cocoon production size to be 6·67 g (fitted regression equation: f(x)=2·043x2−27·215x+68·277). Diamonds correspond to outliers.
 You have
Access
- 31
- Cited by