1. Introduction
The Suez Canal has been the shortest shipping route between Europe and Asia since 1869. By using this marine lane, ships can save more than 3,000 nautical miles and 5 to 7 days travel duration compared to those travelling around the Cape of Good Hope (Khan and Rahman, Reference Khan and Rahman2021; Zhou et al., Reference Zhou, Zhao and Liang2021). Therefore, different types of ships use this canal for passage everyday. In 2019, a total of 18,880 ships passed through this canal with a daily average passage of 51.7 ships, and thus transported a total net weight of 1,207,087 MT (Authority, Reference Authority2019). Yearly, roughly 15% of the world's shipping traffic transits this canal.
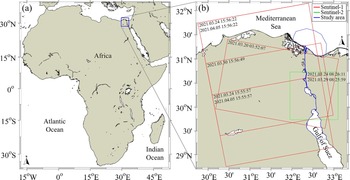
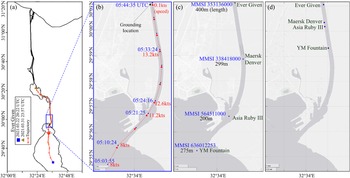
On 23 March 2021, a northbound large container ship, Ever Given (IMO 9811000, length 399.94 m and width 59 m) was passing through the southern part of the Suez Canal on its way to Rotterdam (Forti et al., Reference Forti, d'Afflisio, Braca, Millefiori, Willett and Carniel2021). Notably, this canal is usually windy and its southern part is the windiest (Effat, Reference Effat2017). At that time, there was a severe sandstorm hindering the visibility accompanied by a strong wind (40 kts) at that southern part of the canal (Forti et al., Reference Forti, d'Afflisio, Braca, Millefiori, Willett and Carniel2021; Khan and Rahman, Reference Khan and Rahman2021). Moreover, from 05:20 to 05:40UTC, the fully laden large container ship was moving at 11.2 to 13.2 kts which was much higher than the highest allowable speed (7.56 kts) inside the canal (Authority, Reference Authority2015; Forti et al., Reference Forti, d'Afflisio, Braca, Millefiori, Willett and Carniel2021). Consequentially, at 5:40UTC, the ship lost control and thus stuck the edge of the channel at coordinates 30.01761°N and 32.58018°E (Figure 1). The ship ran aground diagonally in a part of the canal (around 300-m width) that was narrower than the length of the ship and became wedged with its bow in one bank and its stern nearly touching the other bank (Forti et al., Reference Forti, d'Afflisio, Braca, Millefiori, Willett and Carniel2021). Thus, the ship blocked that single-lane passage of the waterway and created a complete blockage of marine traffic through that channel. Approximately 30,000 m3 of sand was dredged and approximately 11 tugboats were needed to draw and pull the ship (Forti et al., Reference Forti, d'Afflisio, Braca, Millefiori, Willett and Carniel2021). Finally, it was refloated at 13:04UTC (3:04 p.m. local time in Egypt) on 29 March 2021.
Map of the study area showing the Suez Canal with boundaries of satellite images (acquisition time at top-left corners) as listed in Table 1

The grounding of the Ever Given itself is a type of maritime anomaly. In the case of Suez Canal, as that ship grounding occurred inside a narrow channel rather than open sea and the large ship diagonally blocked the one-way narrow channel, there was no option left for other ships to bypass that route through a minor deviation to the nominal route. The blockage incident had many immediate consequences which were also maritime anomalies. A weeklong ship jam occurred which halted maritime traffic in both directions. Hundreds of ships became stranded in the resulting massive traffic jam at either end of the canal when the backlog started. Thus, it disrupted the global trade and increased the shipping time and cost. It also caused huge economic loss to the Egyptian Government in lost fees and the rescue operation cost. As one of the world's busiest trade routes, that blockage had a significant negative impact on trade between Europe and Asia.
This blockage incident indicates the importance of maritime surveillance to avoid or at least lessen maritime anomalies. Thus, in this paper we will show the anomalies created due to that grounding by using the available sequence of automatic identification system (AIS) records of ships as well as ship locations detected from multiple satellite images. First, we will show the detection of the grounded Ever Given. Then we will show the overall maritime traffic scenario at different parts of the study area before, during, and after the blockage to identify different types of maritime traffic anomalies created as aftereffects of the canal blockage. For that purpose, the increase in the numbers of waiting ships at the Gulf of Suez and Bitter Lakes will be presented. Moreover, anomaly movements like U-turn by ships (Obradović et al., Reference Obradović, Miličević and Žubrinić2014) after waiting a long time to pass through the canal will be presented. Moreover, a simple method will be tested for detecting sharp decrease rate in a ship's speed earlier so that other ships can choose their route to reach their destination in the shortest possible period.
2. Materials and methods
2.1 Study area
The Suez Canal extends approximately 193.3 km between Port Said and Suez Port through the Isthmus of Suez in Egypt, and thus connects the Mediterranean Sea and the Red Sea (Figure 1). The whole shipping lane has no lock and on its way it goes through three lakes, Lake Timsah, Great Bitter Lake, and Small Bitter Lake, from north to south. It was first opened in 1869 and subsequently, thousands of ship accidents occurred between 1870 and 1884 due to the narrowness and tortuousness of the channel (Encyclopedia Britannica, n.d.). Therefore, further improvements were done including successive widening and deepening of the canal, enlarging the passing bays, making a bypass in the Bitter Lakes and Ballah, etc. Parallel to the main channel, a new 35 km long expansion channel was constructed at the northern part of the canal in 2015 which enabled two-way transits through the canal to the southbound convoys (Kostianaia et al., Reference Kostianaia, Kostianoy, Lavrova, Soloviev, Elbeih, Negm and Kostianoy2020), but till now only one channel exists at the southern part of this canal from Bitter Lakes to the Gulf of Suez (Figure 1). Thus, the canal still does not permit simultaneous two-way traffic through its whole length (Griffiths and Hassan, Reference Griffiths and Hassan1978). However, inside the canal area, ships are allowed to pass one another only at Bitter Lakes (16 km in length and allows a maximum of 36 ships to moor) and Ballah Bypass (10 km in length and allows a maximum of 17 ships to moor) (Griffiths and Hassan, Reference Griffiths and Hassan1978; Griffiths, Reference Griffiths1995).
To pass through the canal, the ships must travel in convoys either south to north (SN) or north to south (NS). As the SN convoy never stops, the NS convoy pulls aside at the Ballah Bypass and the Bitter Lakes to allow the SN convoy to pass through the canal. Ships make a queue as the convoy and wait for passage; thus, daily only one northbound and two southbound ship convoys usually pass through this canal. Due to this convoy system, approximately 11 to 16 h is usually required for a ship to pass through this canal (Xiaye, Reference Xiaye2015).
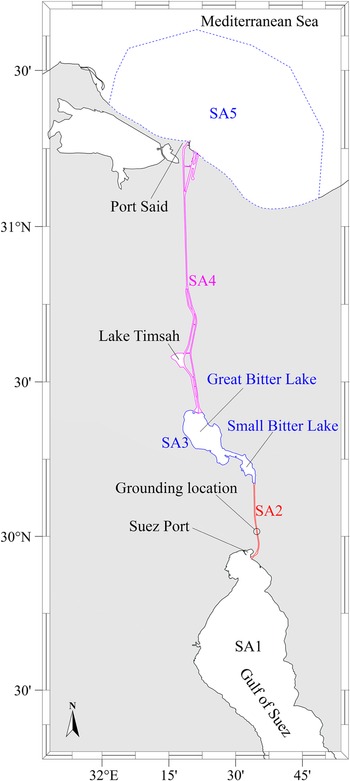
For the purpose of this study, the whole study area is subdivided into five areas as shown in Figure 2. However, only the upper part of the Gulf of Suez (Figures 1(c) and 2) is considered for study, thus hereafter will be referred to as the Gulf of Suez only. Similarly, the study area includes a small part of the Mediterranean Sea nearby to Port Said, thus hereafter will be referred to as the Mediterranean Sea only. The subdivided areas are SA1 (Gulf of Suez), SA3 (Small and Large Bitter Lakes together), SA2 (the single lane of the canal between SA1 and SA2), SA5 (the Mediterranean Sea) and SA4 (two parallel canals and the single-lane canal between SA3 and SA5).
Subdivisions (SA1-SA5) of the study area

2.2 Anomaly detection
One target of this study is to detect the marine traffic anomalies caused by the ship grounding in March 2021. The grounding of the Ever Given further resulted in several other types of maritime traffic anomalies. In general, the term anomaly indicates any deviation from a standard behaviour (Filipiak et al., Reference Filipiak, Strózyna, Wecel and Abramowicz2018). However, there is no exact definition of a maritime anomaly. Anomaly is usually associated with many terms from which terms like abnormality, abnormal, atypical, deviation, exceptional, illegal, inconsistent, irregular, benign, threat, not explained, incongruous, outlier, atypical, peculiar, rare, special, strange, threat, threatening, unusual, unnatural, improper, etc. could be mentioned here (Riveiro et al., Reference Riveiro, Falkman and Ziemke2008, Reference Riveiro, Pallotta and Vespe2018; Roy, Reference Roy2008; Martineau and Roy, Reference Martineau and Roy2011; Riveiro, Reference Riveiro2014). There could be various types of anomaly in marine traffic. Some could be related to abnormal movement like irregular, illegal and other anomalous appearances which are usually detected based on vessel trajectory analysis (Fu et al., Reference Fu, Wang, Liu, Hu and Zhang2017; Venskus et al., Reference Venskus, Treigys, Bernatavičienė, Tamulevičius and Medvedev2019). Amro et al. (Reference Amro, Oruc, Gkioulos and Katsikas2022) mentioned some anomalies like sudden unexpected or abnormal change in speed over ground (SOG), under-reporting, over-reporting, etc. Deviations from regular traffic routes are also considered anomalous (Riveiro, Reference Riveiro2014). Maritime traffic anomaly can be attributed to a single ship, a convoy or all ships in a specified area (Riveiro, Reference Riveiro2014). It can be anything abnormal or unwanted or illegal from the normal or desired ship activities (Liu, Reference Liu2015). Thus, in the maritime domain, anomalies could be unexpected stops, deviations from regulated routes, inconsistent speed or direction etc., and may be related to risks like collisions, grounding, smuggling, piracy, etc. (Liu, Reference Liu2015). Scientists have also mentioned U-turn of vessels as an anomaly (Kowalska and Peel, Reference Kowalska and Peel2012; Handayani et al., Reference Handayani, Sediono and Shah2013; le Guillarme and Lerouvreur, Reference le Guillarme and Lerouvreur2013; Pallotta et al., Reference Pallotta, Vespe and Bryan2013; Obradović et al., 2014; Keane, Reference Keane2017; Boztepe, Reference Boztepe2019; Rong et al., Reference Rong, Teixeira and Soares2019; Nguyen et al., Reference Nguyen, Vadaine, Hajduch, Garello and Fablet2021).
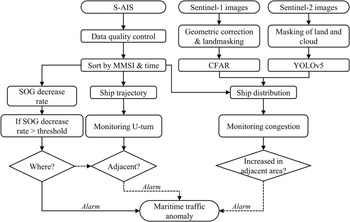
The steps of anomaly detection for this study are shown as a workflow in Figure 3. Though there are numerous types of maritime traffic anomalies, in this study, we will stick to only excessive increased ship congestion in SA1 and SA3, sharp decrease rate of SOG in SA2, and U-turn of ships in SA1 and SA2. For these purposes, satellite AIS (S-AIS), Sentinel-1 and Sentinel-2 images were used to locate ship position.
Overall workflow for maritime traffic anomaly detection

2.3 Satellite images
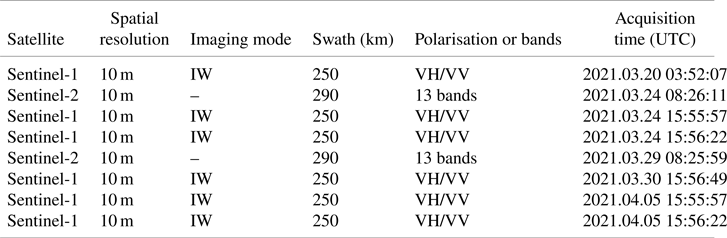
For this study, medium spatial resolution satellite data from Sentinel-1 and Sentinel-2 were used (Table 1). The data were downloaded from the Copernicus website (https://scihub.copernicus.eu/). To ensure availability of earth observation data for environmental and security services, the European Space Agency provides Sentinel data free of cost which are collected by a constellation of satellites carrying different sensors (Štepec et al., Reference Štepec, Martinčič and Skočaj2019). Out of the five Sentinel missions, the important missions for maritime monitoring are the Sentinel-1 and Sentinel-2 missions (Štepec et al., Reference Štepec, Martinčič and Skočaj2019). Sentinel-1 provides synthetic aperture radar (SAR) images with wide coverage having the advantages of imaging irrespective of weather conditions (Wang et al., Reference Wang, Wang and Zhang2018). Thus, the usages of Sentinel-1 images are increasing for the detection of ships for the purpose of providing safety in maritime transportation (Wang et al., Reference Wang, Wang and Zhang2018). Therefore, freely available 10 m resolution Sentinel-1 data were used for ship detection. The Sentinel-2 mission offers a global coverage including our study area with 10 m spatial resolution which is also useful for ship detection (Štepec et al., Reference Štepec, Martinčič and Skočaj2019).
List of satellite images used in this study

2.3.1 Satellite image preprocessing and ship detection
The workflow for detecting the ships from the satellite images is shown in Figure 3. At first, the Sentinel-1 data were radiometrically and geometrically corrected followed by land masking, applying a 3 × 3 size sliding window, data binarisation and finally removal of false detection from the noise by image erosion and dilation (Yang et al., Reference Yang, Park and Rashid2018; Bae and Yang, Reference Bae and Yang2020).
For the ship detection from Senitnel-2 images, the deep learning based You Only Look Once (YOLOv5) model was used (Jocher, Reference Jocher2020) due to its better performance in ship detection in complex environments like ships nearby ports or reefs by applying a sliding window (Goodfellow et al., Reference Goodfellow, Bengio and Courville2016; Redmon et al., Reference Redmon, Divvala, Girshick and Farhadi2016; Redmon and Farhadi, Reference Redmon and Farhadi2017; Wang et al., Reference Wang, Wang and Zhang2018). For the training of the YOLO model, a large scale dataset of ships comprising 2,171 ship images for Sentinel-2 was used. A total of 102 images were used as validation datasets.
2.4 S-AIS data
Ship information was extracted from AIS data for the period from 1 to 31 March 2021 obtained from exactEarth Ltd. (http://www.exactearth.com/), who are a space-based data service provider operating a constellation of 65 microsatellites to provide global AIS coverage at a high-frequency rate (March et al., Reference March, Metcalfe, Tintoré and Godley2021). The data contain not only S-AIS information of ships but data also from terrestrial AIS (T-AIS). Data contain ship information like Maritime Mobile Service Identity (MMSI), name, length, width, SOG, course over ground (COG), change of speed, coordinates, navigation status, etc. However, some data like vessel type, length, width, etc. were unavailable for some ships which were obtained from the https://www.marinetraffic.com/ website.
2.4.1 S-AIS data quality control and preprocessing
The received S-AIS data may be contaminated by noise and data outliers; thus need to go through a data quality control procedure to remove the noise (Chen et al., Reference Chen, Ling, Yang, Zheng, Xiong, Postolache and Xiong2020, Reference Chen, Chen, Xu, Luo and Biancardo2022). There might be different types of noises like noises regarding location information, time, speed, draft information, etc. The data contained some such noise like ship locations on the land which were removed first, followed by removing data outside our study area. For that purpose, data were sorted according to ship MMSI and time, and then data were interpolated for producing each vessel's trajectory.
2.4.2 Warning system based on ship SOG
Elsherbiny et al. (Reference Elsherbiny, Tezdogan, Kotb, Incecik and Day2019) suggested a maximum allowable speed of 9 kts inside the Suez Canal. However, according to the rule of Suez Canal Authority (SCA), while passing through the canal inside a convoy, a ship must maintain a speed of 14 km/h (7.6 kts) and 10 minute separation distances from the vessel ahead and stern throughout its passage (Griffiths, Reference Griffiths1995). Speed is also restricted to protect the banks from ship wakes (Griffiths, Reference Griffiths1995).
A sharp change in ship speed could be considered as an anomaly (Liu, Reference Liu2015; Huang, Reference Huang2019). A decrease in the ship speed might also cause a longer period for the whole convoy including that vessel to pass through the canal. Therefore, considering the single lane channel (SA2 in Figure 2) as the most critical area for ship traffic management, a simple warning method is tested based on a sharp decrease rate of SOG over time, which equals change in velocity (Δv) divided by change in time (Δt) as shown in Equation (1) (Qu et al., Reference Qu, Meng and Suyi2011).

where speed change is calculated for the time of Tj −1, and $\textrm{SO}{\textrm{G}_{{T_j}}}$ is the SOG of the vessel at time Tj.
Here, SOG change rate is calculated in kts/h. According to the maximum allowable velocity (14 km/h), ships have to maintain at least 2.33 km distance among each other inside the canal. Thus, when a ship decreases its speed by 20, 25 and 30%, the distance of that ship to the next ship behind it is decreased to 1.86, 1.75 and 1.63 km, respectively. For this study, these values were tested as some limits of speed decrease rate and thus three levels of warnings, namely first, second and third levels of warnings, were assigned for SOG decrease rates of >20 to ≤25, >25 to ≤30 and >30 kts/h, respectively.
3. Results and discussion
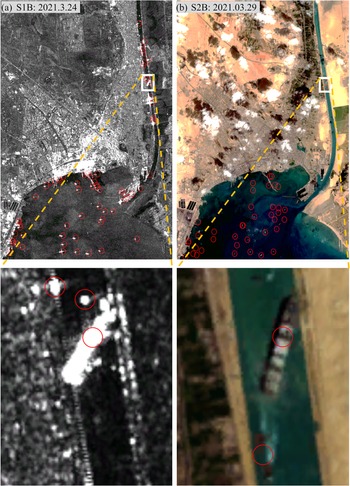
The target of this study was to identify anomalies caused by the blockage of the Suez Canal by the grounding of the Ever Given. However, ship grounding itself is a type of anomaly which will be discussed here in brief for the Suez Canal blockage incident. The whole trajectory of that ship from the available S-AIS data from 2021.03.22 20:22UTC to 2021.03.31 23:57UTC is shown in Figure 4. Moreover, the SOG according to each location with UTC before the accident is also shown for an enlarged area of the map (blue rectangle). After entering the canal, Ever Given increased its speed to 11.2 kts at 05:21:25UTC and then increased it further to 12.6 kts at 05:24:16UTC which were over the maximum allowable speed in the canal. It was forwarding and became grounded at approximately 10.4 km north to the canal's southern entrance (30.016933°N latitude and 32.580171°E longitude) at 05:44:35UTC. In general, during grounding, a ship has no movement, i.e. zero SOG. Similarly, during anchoring, any ship has no movement or very little movement depending on the environmental factors like current, intertidal current, wave, wind, storm, etc. From its grounding at 05:44:35UTC on 23 March to 12:56:48UTC on 29 March, the Ever Given had almost zero speed. However, only from 11:18:35UTC to 14:11:54UTC on 23 March S-AIS showed its status as aground, whereas before and after that, its S-AIS showed a navigation status as ‘under way using engine’. Thus, it seems that use of the SOG is more reliable than using the navigation status for identifying a ship's movement status. That grounded ship is also detected from moderate resolution Sentinel-1 and Sentinel-2 images (Figure 5). From the enlarged figure it can be seen that its stern side stucked at the eastern side of the canal and its back side stucked at the western side of the canal. In the images, circles are used to indicate the detected ships.
Trajectory of Ever Given (a) from 2021.3.22 20:22 to 3.31 23:57 UTC, (b) from 40 min back to the grounding time (3.23 05:44), (c) surrounding ships at the grounding time and (d) on 3.23 23:00

(a) Sentinel-1 VV polarisation image and detection result of ships (red circles) on 24 March 2021, and (b) ships detected from Sentinel-2 on 29 March 2021 at the southern part of Suez Canal

By the time of the Ever Given grounding two other large ships (MMSI 338418000 and 564511000) behind that had already entered SA2 in the convoy behind it (Figure 4(c)). At that time another large ship (MMSI 636012253) was very close to the canal, but had still not entered (Figure 4(c)). This ship subsequently entered the canal. If there was any system to warn about the grounding, the large ship (MMSI 636012253) could be informed simultaneously not to enter the canal. However, as the grounded ship diagonally blocked the canal, the three other ships could not pass though the canal and thus remained at their locations (≥200 m). Thus, they had to anchor and finally moor (Figure 4(d)). By making a U-turn, the ship (MMSI 636012253) that last entered the canal came out of SA2 on the next day and the other two vessels came out of SA2 after two days of waiting. Then, those three vessels were waiting in the Suez Bay at SA1 for the canal to be cleared for passage, and finally passed through the whole canal on 30 March 2021 after the grounded vessel had been dislodged. If those waiting ships took any alternate route like the Cape of Good Hope, it might have resulted in a higher expense due to increased fuel cost. However, making such decision of rerouting through the Cape of Good Hope would be easier for those ships which had not yet entered the Red Sea and had received the ship grounding information in time compared to the ships stuck around the Suez Canal (Khan and Rahman, Reference Khan and Rahman2021). Six tugboats (MMSI 622110690, 622110691, 622123000, 622123235, 622123243 and 622123990) entered SA2 from SA1 after grounding occurred and came back out of the canal on the same day by taking U-turn. One fire-fighting tugboat (MMSI 622123246) entered a little before the grounding and stayed there that day.
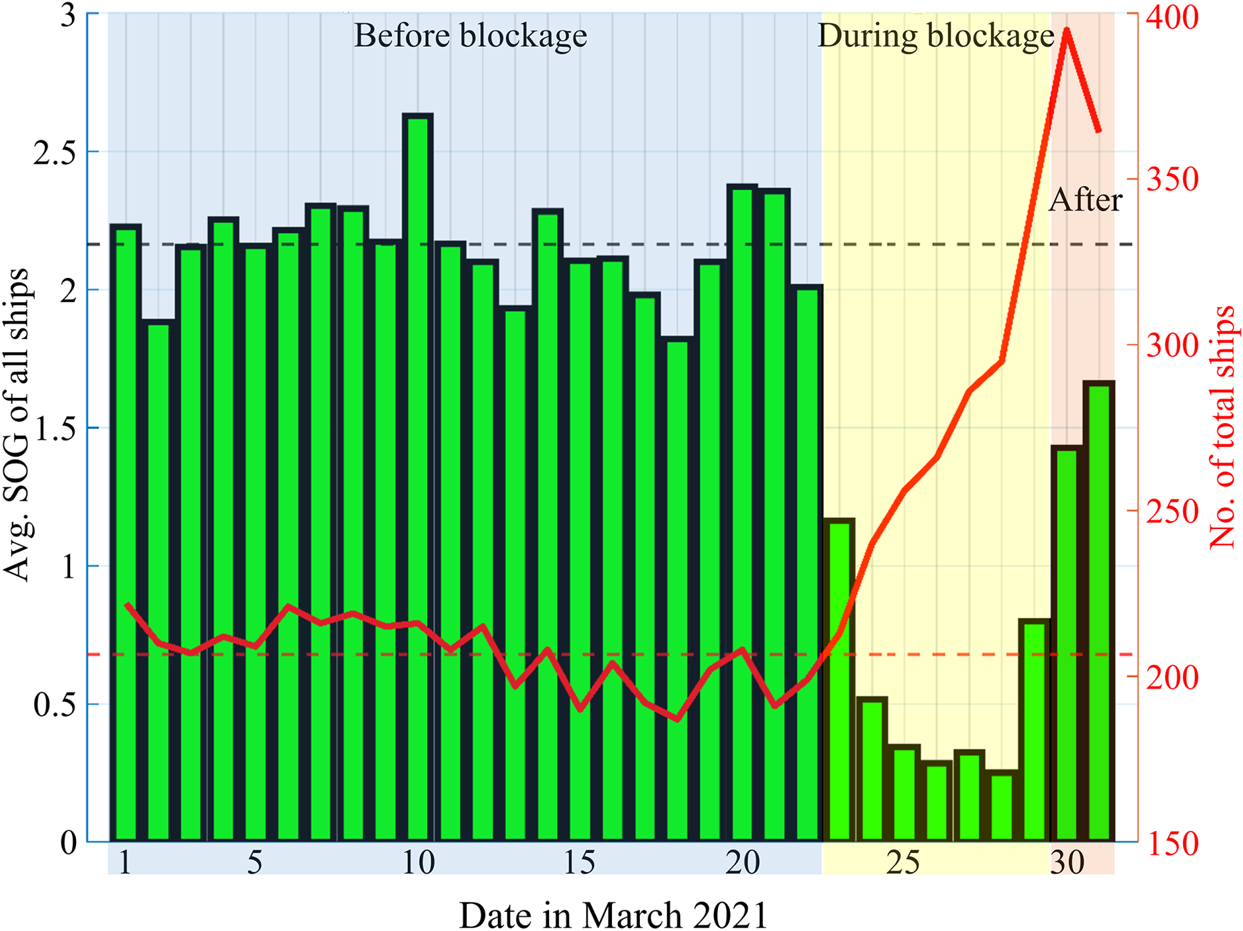
For overall comparison, the changes in the number of all S-AIS based ships and their mean speed before, during and after that blockage period are graphed in Figure 6. The daily average speeds of all ships are shown in kts on the left vertical axis of the bar graph and the total number of ships for each date is indicated on the right vertical axis. Before the blockage, the total number of ships in the study area showed little difference among consecutive dates and ranged from 170 to 220 with an average of 207 ships per day. However, after the blockage started on 23 March, the total number of ships suddenly increased to 213 and continuously increased till the last date of the blockage reaching 345 ships on 29 March 2021. The number of ships increased as new ships entered everyday in the study area for passage and added to the ships still waiting for passage. However, even after the dislodging of the ship, the total number did not start to decrease from the next day as additional ships were still approaching towards the canal for passage and it was taking time to get the traffic to move again because of the huge number of waiting ships; it took few more days for the process to return to normal. Thus, till next day the total number of ships in the study area still increased up to 395 in spite of the passing of many vessels on that day, and then started decreasing gradually (364) on 31 March. From 1 to 22 March the average SOG of all ships in the whole study area was 2.17 kts. However, in spite of the trend of increased ship numbers during the blockage (23–29 March 2021), their average SOG decreased conversely with an average of 0.53 kts indicating the consequence of ship congestion caused by that blockage. It was caused as many ships had little or no movement due to anchoring while waiting for passage. However, as of the afternoon of 29 March, the grounded ship was dislodged (Forti et al., Reference Forti, d'Afflisio, Braca, Millefiori, Willett and Carniel2021) and some ships started passage again, so the SOG was found to increase gradually during the next two days.
Changes in the total number of ships versus average SOG (kts) in the whole study area

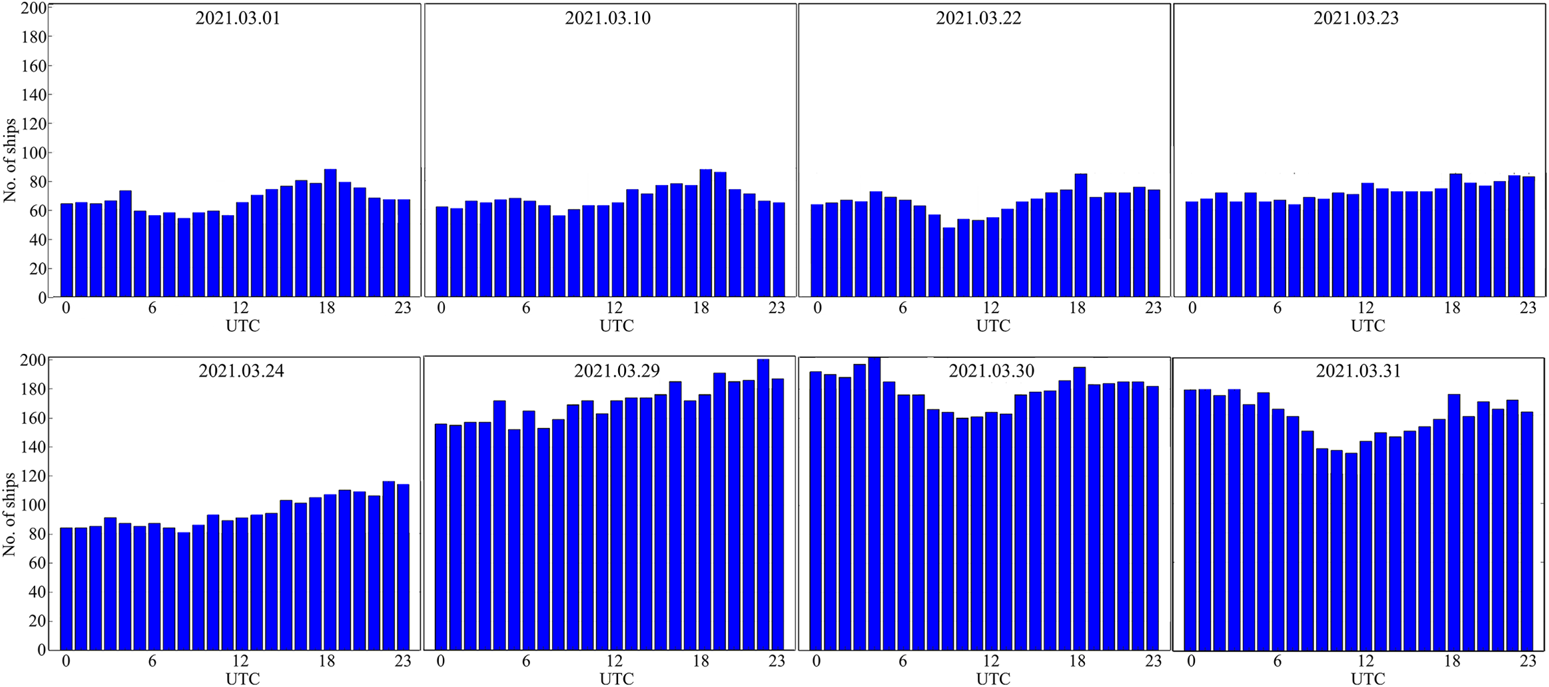
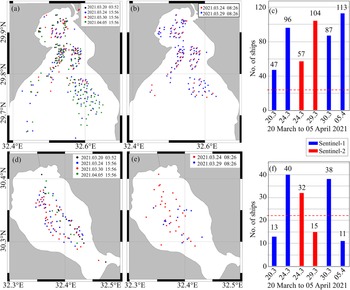
We considered the single passageway of the canal (SA2 in Figure 2) as the most critical part of the canal for passage, because any blockage in that part will fully collapse the whole marine lane, as occurred during the mentioned grounding event. The increase in the number of ships in the Gulf of Suez as a consequence of the blockage is an indicator for anomaly detection. Hence, the S-AIS based hourly ship distribution in the Gulf of Suez (SA1 in Figure 2) was analysed for some example dates before (1, 10 and 22 May 2021), during (23, 24 and 29 May 2021), and after (30 and 31 May 2021) the blockage incident (Figure 7). Before blockage, the ship number hourly varied from approximately 60 to 90 with some variations caused by ships leaving the area for passage through the canal as a convoy and new ships entering that area for the purpose of passage. At the first date of the start of the blockage, the hourly rhythms in ship numbers disappeared, and from the next date, the total number of ships started to increase and thus continued to gradually increase till the last date of the blockage. However, after the date the ship was dislodged, the ship number still remained almost stationary, and two days later the total number of ships started to gradually decrease as ships started their passage. From the Sentinel-1 and Sentinel-2 based detections of ships, similar trends are also seen in SA1 and SA3 (Figure 8). However, a lower number of ships were detected on 24 March 2021 in both SA1 and SA3 from Sentinel-2 compared to those of Sentinel-1 which was caused by no detections of ships at the cloudy areas in the Sentinel-2 images. From Figure 8(c), even after a week of the ship being dislodged, the waiting ship numbers were still very high (113 ships on 2021.04.05) at the Gulf of Suez. According to a report, the grounding was expected to require a total of more than three weeks to return the situation to that before the accident, as the number of additional ships that had to pass through the canal had increased during the blockage period (USA Today, 2021). A report of Foreign Policy (2021) also mentioned that the resulting supply chain delays are still reverberating months after the incident 2021.
Hourly ship distribution in SA1 (from S-AIS) for some dates in April 2021

Maps of ship locations in SA1 detected from (a) Sentinel-1 and (b) Sentinel-2, and (c) ship numbers from respective detections. Similar ship location maps graphed for the SA3 area as shown in panels (d) to (f), respectively. In (c) and (f) red dashed line indicates the average daily passage of ships through the canal in each single direction

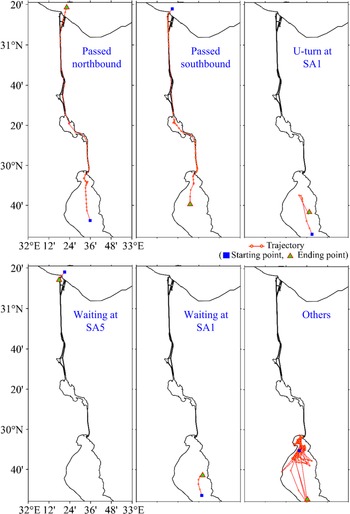
In this study, all ships were divided into some categories based on their movements among areas from SA1 to SA5 and by analysing their shift patterns (Figure 9). The categories are passed northbound (PN), passed southbound (PS), sharp U-turn towards south (US) at Gulf of Suez, waiting for passage at north (WN), waiting for passage at south (WS), and others (did not pass through the canal or reversed back from the canal, or waiting or very little shift at the Gulf of Suez or the Mediterranean Sea, but stayed or took more than 7 days starting before the accident period, or showed no specific pattern of shift, or S-AIS data only for a few locations or for very short periods). Examples of each type of category are presented as the trajectory of ships. This classification of the ship movements will help to describe the selected types of anomalies which will be presented in the next few graphs. A sharp U-turn towards north in the Mediterranean Sea was also checked, but was not evident in the open sea; thus was not listed here for the discussion.
Categorisation of ships according to shift direction in different subdivisions of the study area

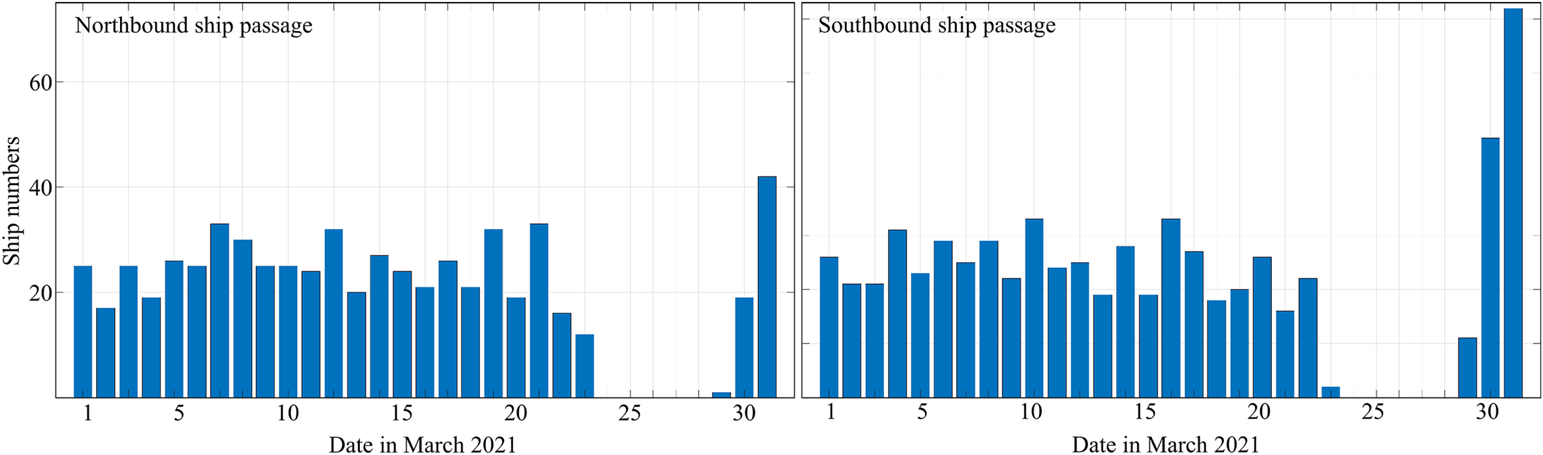
Graphs for daily ship passages (except tugs) through the Suez Canal (both PN and PS) are shown in Figure 10. From 1 to 22 March (before the date of the accident), similarities can be seen in the numbers of ship passages in both directions. From 24 to 28 March, no such passage can be seen as the blockage remained. On 29 March, the grounding ship was refloated and shifted which caused the blockage to disappear and the ships passage started again. As many ships were already in the queue for more than one week waiting to pass, many ships can be seen to pass on the next two days, 30 and 31 March.
S-AIS data based daily total northbound (left) and southbound (right) ship passages through the Suez Canal except tugs

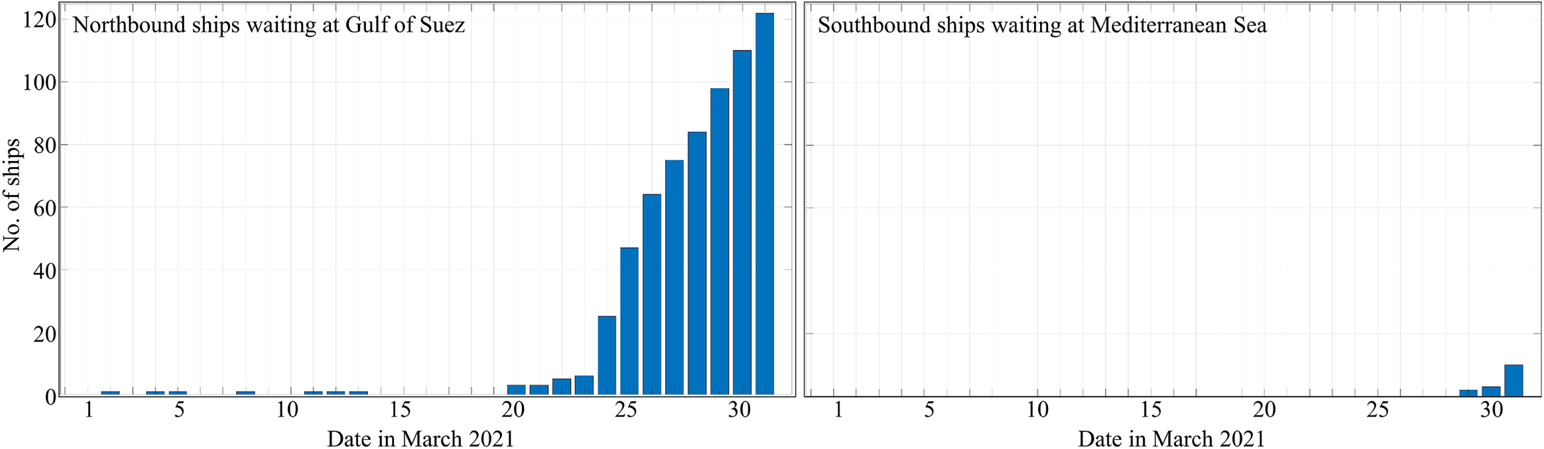
Graphs for the daily waiting ship numbers at both side of the Suez Canal is shown in Figure 11. From 1 to 23 March, no or very few ships are found to be waiting by the end of each day at the south side of the canal (SA1) for northbound passage through the canal. When the blockage occurred, the number of waiting ships suddenly increased on the next day and continuously increased, thus reached to over 120 on 31 March because many ships were still accumulating at the Gulf of Suez. However, till 28 March at the north side of the canal (SA5) no ships were waiting for southbound passage, and from 29 March, ships started to gather and remained waiting for passage, until on 31 March, a total of 10 ships were found to be waiting.
S-AIS data based on the daily total ships waiting for northbound (left) and southbound (right) passages through the Suez Canal

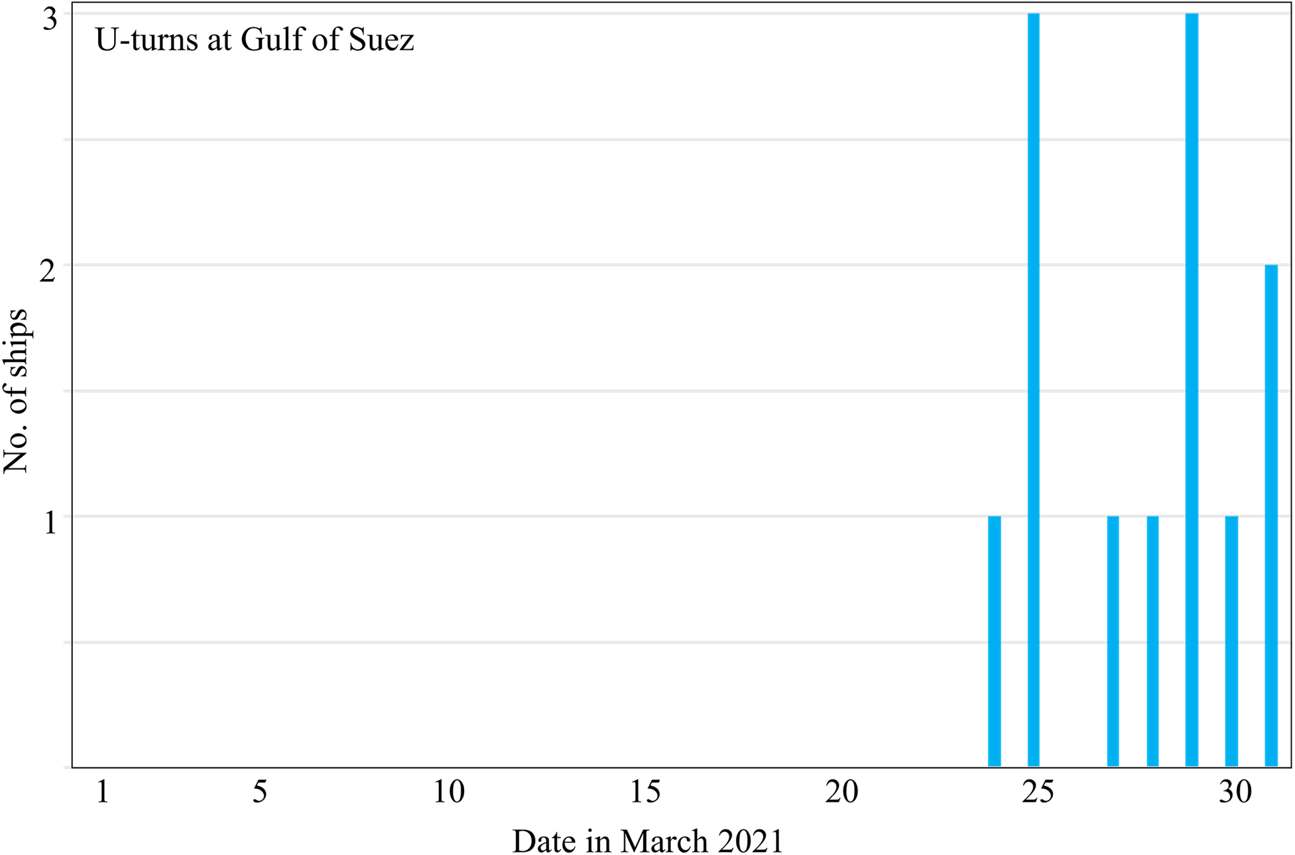
A U-turn is also a type of anomaly which is shown for the ships at SA1 or SA2 (Figure 12). For this study, only the ships that stayed for passage through the canal and after waiting a long time suddenly took sharp U-turn out of the canal, or first made a sharp U-turn and then waited a long were included. Moreover, ships making U-turn towards the canal, or ships which first ported and later U-turned at the Gulf of Suez, or small tugboats that entered the canal and later made U-turn during their operation, or entries from small standby safety vessels were excluded. For this purpose, the destination was also checked from the S-AIS data to know whether they were destined to pass through the canal or have different destinations at the south or port areas in the Gulf of Suez. From 1 to 22 March 2021, some ships were found to make U-turn, but their destinations were not towards the Mediterranean Sea or through the Suez Canal. During that period, the numbers of U-turns were also not very high. However, as the blockage started, everyday from 24 to 31 March (except 26 March), one to three ships waited at SA2 having destinations to pass through the canal and later made U-turns after waiting a few hours to almost 7 days as they could not pass though the canal due to the blockage. From observing ships’ trajectories, some ships were found to be ported at different locations of Port Said and then returned to the Mediterranean Sea, and no direct U-turn thus was observed at the SA5 area. However, U-turn at other areas like the SA3 area were not considered here for detection.
S-AIS data based on the daily total number of U-turns of ships at the Gulf of Suez

The container ships in long voyages need reliable communication information for a time-bound and safe voyage which encircles almost the whole globe (Khan and Rahman, Reference Khan and Rahman2021). Hence, delay in passage can result in loss of time and increased transportation cost. Therefore, it is necessary to avoid delays, especially in a commonly used maritime lane like the Suez Canal. Such delays can be caused from a low speed of ships, sharp deceleration (speed decrease rate), or sudden stop. If a ship is delayed in her passage while passing through the canal, other ships behind it in the same convoy will also be delayed. Moreover, the delay will cause at least an extra half day delay to the other waiting ships behind that convoy due to not catching the next Suez's passage window, and that cannot be overcome by a slight adjustment in speed (Xiaye, Reference Xiaye2015). Thus, such a delay must be prevented to avoid loss of time and increased transportation cost for ships and decreased revenue for SCA. Moreover, as mentioned before, a ship in a convoy should maintain 7 kts (Griffiths, Reference Griffiths1995) while passing through the canal to avoid collision with ships ahead and stern. Thus, if other ships in that convoy can obtain the sharp speed decrease rate information, then the following ships can keep observing the situation with utmost care and thus can also adjust their speed to avoid collision. Furthermore, halt of a ship inside the single lane indicates abnormal traffic like a jam or blockage which must be considered by ships when planning to use this route but are still far away from the canal, and thus can still change the route plan to choose the best suited route. Notably, the single channel of the canal (SA2) could be considered as the most critical area of the canal as there is no alternative channel to pass through this area. Therefore, in this study, abrupt speed decrease was considered to be applied to the ships while passing through that SA2 area.
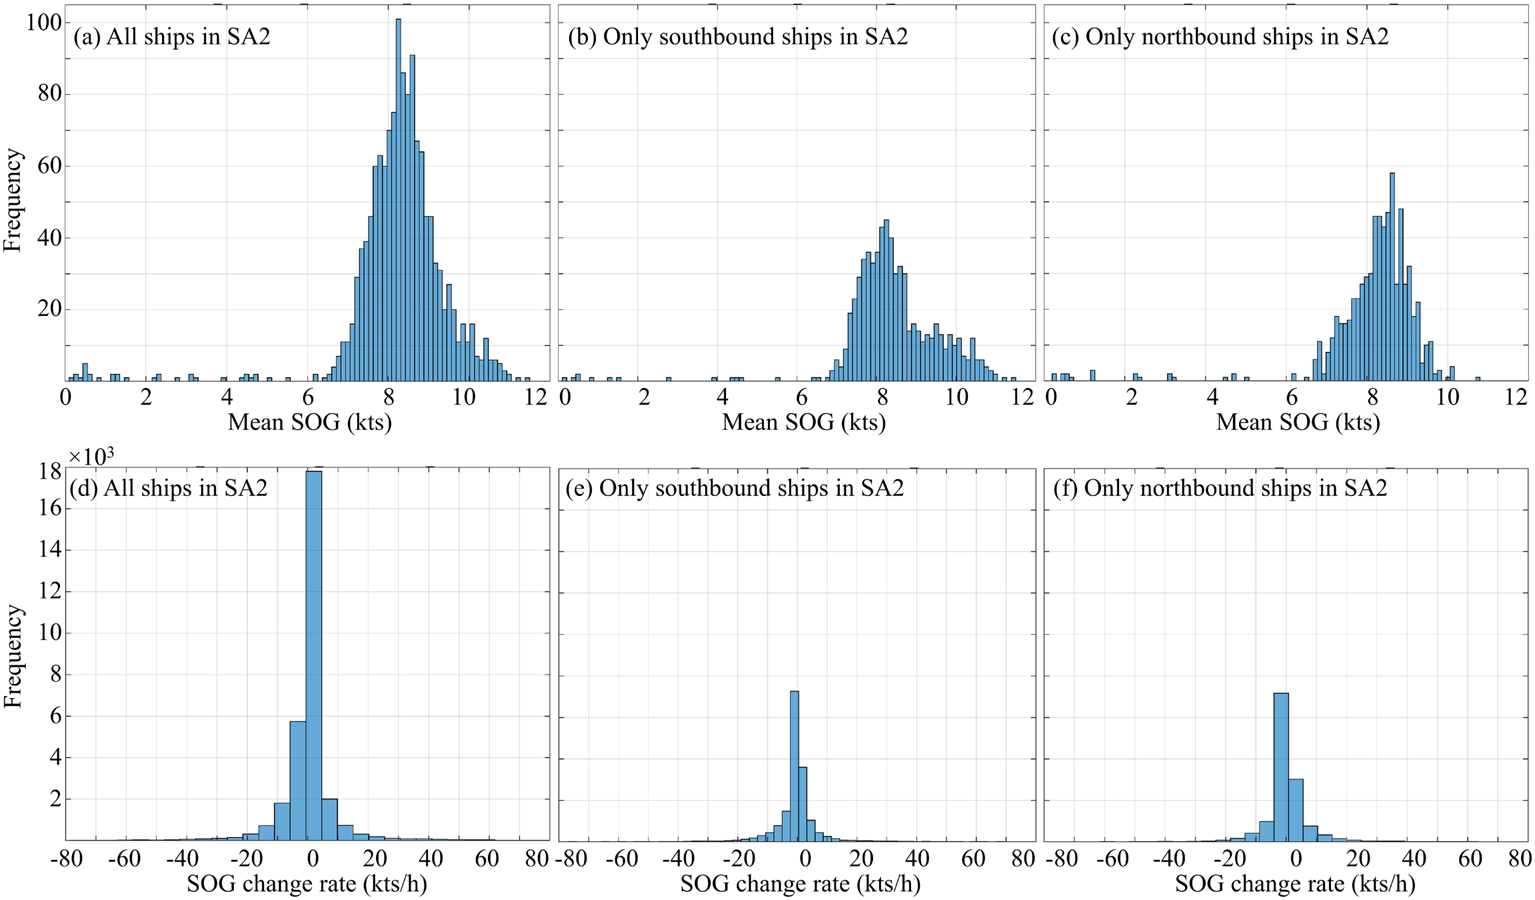
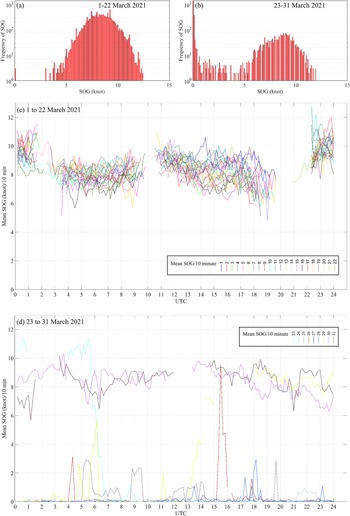
The ship-wise mean SOG and SOG change rate in the SA2 area are shown as histograms in Figure 13. Most of the ship's mean SOG remained between 7 to 11 kts for northbound ships whereas 7 to 9.5 kts for southbound ships. Ship speed decrease rate was more in the case of northbound ships than that of southbound ships. In Figure 14, a histogram of the SOG for all ships in the SA2 area is shown. However, in this graph all tugboat data entries were removed as they must frequently change their SOG and direction inside SA2. It can be observed that before the accident (1 to 22 March 2021), there is almost no instances of ship stop (0 SOG). However, due to the blockage, numerous instances of ship stops and very little movement of many ships between 23 and 31 March were observed. To understand the effect, the SOG data are divided into 10-min intervals and thus the mean of all ships in SA2 at each 10 minute duration is shown in Figure 14 (c) and (d). These show that before the accident, ships maintained more than 6 kts average SOG with no instances of 0 SOG as no passing ships are normally allowed to stop there. However, after ship grounding occurred on 23 March, ships had to stop inside the canal which caused 0 SOG which is also evident for the other dates of blockage. However, after the ship was dislodged on 29 March, the SOG started to increase and in the next two days, the mean SOG returned to normal.
Histogram of each ship's mean SOGs (top row) and SOG change rates (bottom row) inside the SA2 from S-AIS in March 2021

Histograms and line plots showing all ships’ SOG and mean SOG at 10-min intervals in SA2 excluding tugboats: (a) and (c) for 1–22 March, 2021; (b) and (d) for 23–29 March, 2021

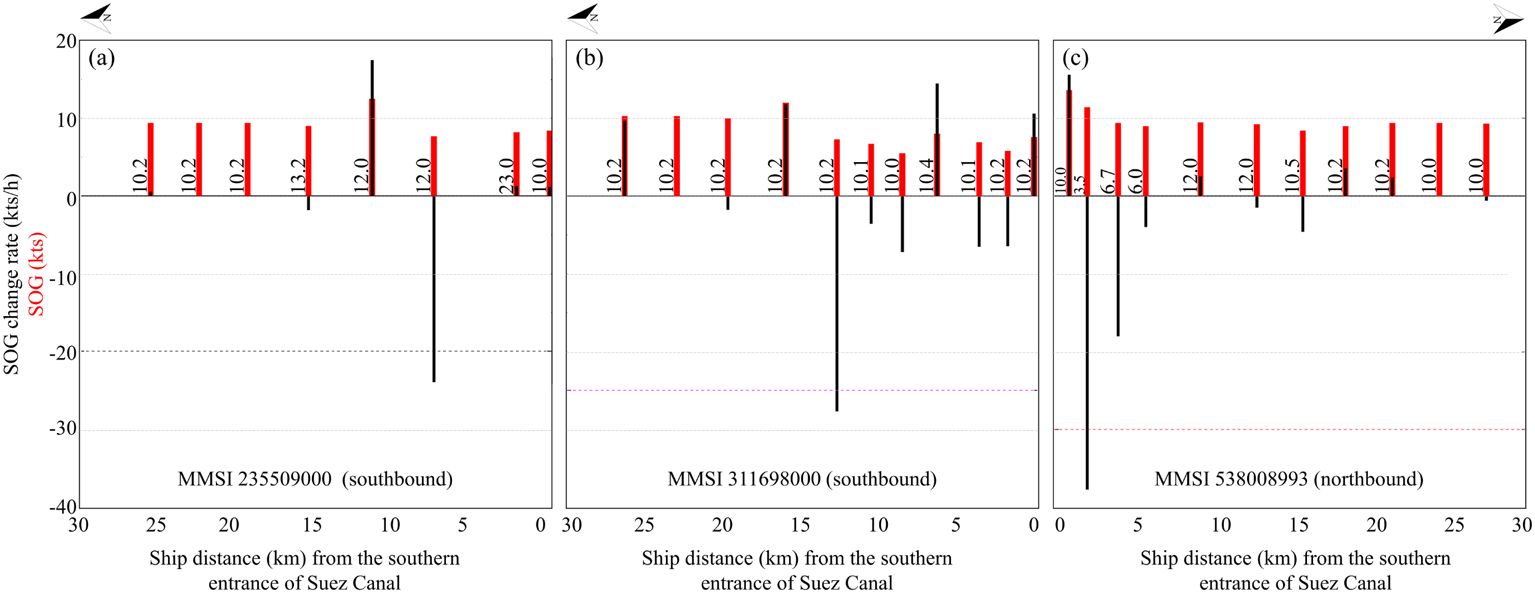
With the previously mentioned warnings based on SOG decrease rate, the example cases for assigning warnings for three ships are shown in Figure 15. Thus, after testing the SOG decrease rate based warning to all 1,349 ships (except tugs) which passed through the canal, first, second and third levels of warnings were found to be attributed to 39, 14 and 21 ships, respectively, whereas most of the ships (1,275 ships) were not assigned to any warnings. For multiple instances of warnings for a ship, only the highest level of warning is considered here for the convenience of description. Thus, this system can find out the ships which are sharply decreasing their speed and thus assign a warning to avoid any collision with other ships following that ship in convoy or allowing them to make a decision earlier about using a route or rerouting. This warning method can be integrated with the other anomaly detections as shown in the overall methodology workflow though solely this SOG decrease rate based way can detect alarming situation. However, here, this testing was done with the original SOG values without any interpolation. Thus, further research work is required to precisely fix the SOG decrease rate values for assigning warnings as well as to use time interpolated data so that it can be tested every minute and thus ships could be informed earlier to prevent them from entering the canal soon after repeated alarms from vessels.
Examples of (a) first, (b) second and (c) third levels of warnings assigned for vessels while passing SA2. Black and red texts at Y axis correspond to black and red bars respectively in the graphs. The numbers at X axis show the distance of ship from the southern entrance (29.927502°N, 32.558424°E) of Suez Canal by the order of time. The numbers between two consecutive bars denote the time interval (minute) between two consecutive SOGs

4. Conclusion
This study has analysed the ship grounding in the Suez Canal on 23 March 2021 as a maritime traffic anomaly. This event further created a series of other types of anomalies like no passing of ships through the canal during blockage, increased number of waiting ships, sharp U-turn of ships except tugs as well as halt of ships inside the single passage of the Suez Canal which were detected and analysed through this study with the help of ship information extracted from S-AIS data and ship locations from moderate resolution Sentinel-1 and Sentinel-2 images. Thus, it is found that the total number of ships in the study area surged from a usual average of 207 ships to as much as 346 ships. The number of waiting ships more than double at the Gulf of Suez and Bitter Lakes during the blockage period. The number of ships performing a U-turn was also increased. After the blockage removal, the number of ship passages was increased considerably to allow the ships which were waiting for days to pass. To prevent similar types of hazards, we considered the single lane at the south as the most critical pathway of the canal, and thus tested a warning system to the ships passing through that area based on their speed decrease rate. Three limits were tested on SOG decrease rate, and thus 5.49% of ships were found to be appropriate for warning about their large decrease. Thus, it is supposed that this warning on abrupt speed decrease could be used by ships or the port authority to know the status of the ship traffic inside the canal and thus make decisions in advance regarding choosing the best suited route considering the ship traffic condition.
Funding statement
This research work was supported by the projects ‘Remote Sensing Surveillance System for Supporting Illegal, Unreported and Unregulated (IUU) Fishing Control Activities’ funded by the Ministry of Foreign Affairs, Korea, ‘Establishment of the Ocean Research Station in the Jurisdiction Zone and Convergence Research’ funded by the Ministry of Oceans and Fisheries, Korea and “Monitoring System of Spilled Oils Using Multiple Remote Sensing Techniques” funded by the Korea Coast Guard. S-AIS data was provided by exactEarth Ltd.
Competing interests
None.