I. INTRODUCTION
As the known lightest structural metal, Mg is emerging as a highly attractive candidate for a broad range of practical applications. This potentiality motivates extensive research efforts to study its mechanical responses under a variety of loading conditions. Reference Avedesian and Baker1–Reference Li12 However, the absolute strength of Mg is just on the order of tens to several hundred megapascals, and many researchers are working on the improvement of its mechanical properties through two popular methods. One is to change the microstructure through thermomechanical processing; the other is to modify the chemical composition. The second method includes two subcategories. One is the formation of Mg alloys and the other is the synthesis of Mg composites. Reference Ferkel and Mordike2,Reference Nie, Wang, Hu, Xu, Wu and Zheng8,Reference Trojanova, Gartnerova, Jager, Namesny, Chalupova, Palcek and Lukac13–Reference Gu, Zhang and Gu17 Mg composites were generally synthesized through the introduction of strengthening particles/fibers to Mg matrix. This method attracted extensive scientific and engineering interests since there were a large number of strengthening/reinforcing phases such as Si, SiC, SiO2, Al2O3, AlN, and Al Reference Ferkel and Mordike2,Reference Nie, Wang, Hu, Xu, Wu and Zheng8,Reference Trojanova, Gartnerova, Jager, Namesny, Chalupova, Palcek and Lukac13–Reference Gu, Zhang and Gu17 to choose from in synthesizing a composite.
The continuous drive to reduce the carbon dioxide emission and increase the energy consumption efficiency requires the development and application of lightweight and ultra-strong composites. Carbon nanotube (CNT) is a highly attractive type of reinforcement phase due to its extremely high Young’s modulus (up to 1 TPa) and strength (up to 150 GPa). Since its discovery in 1991, Reference Iijima18 it has been widely used in synthesizing polymer-based composites. Reference Thostenson, Ren and Chou19–Reference Isayev, Kumar and Lewis22 CNT was also used to produce various metal-based composites with aluminum, copper, nickel, titanium, and Mg Reference Esawi and El Borady23–Reference Li, Viereckl, Rottmair and Singer30 serving as the metal matrix. The CNT-reinforced Mg composites were synthesized through either casting or powder metallurgy. Powder metallurgic method is often safe and economic and was chosen for this study. The reported research often had an extruding/forging step after sintering process, although our study did not include this step. It is necessary to study the fundamental mechanical behavior of CNT-reinforced Mg composites without extruding/forging. In this study, we synthesized Mg matrix composites with various CNT weight percentages through powder metallurgy, tested these composites under compression at room temperature, and examined the composites’ microstructure using optical microscopy, x-ray diffraction technique, and scanning electron microscopy.
II. MATERIALS AND EXPERIMENTS
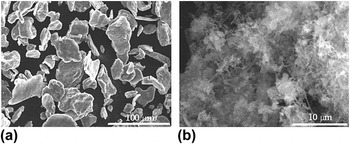
Mg-based composites were synthesized by powder metallurgy, mechanically tested, and microscopically characterized to explore the mechanical behavior. The studied composites contained 0.05%, 0.2%, 0.5%, 1%, 2%, and 5% CNT weight percentages, respectively. Table I listed the theoretical densities and the experimental densities for the composites with 0.05%, 0.2%, 0.5%, 1%, 2%, and 5% CNT, respectively. The experimental densities were within ±5% of the theoretical densities for the studied composites. The raw materials were Mg powders and multi-walled CNTs. Mg powders had an average particle size of ∼44 μm and a purity of 99.8%, as shown in Fig. 1(a). Multi-walled CNTs with nickel (Ni) coating in Fig. 1(b) had a purity of >95%, a diameter range of 30–50 nm, and a length range of 10–20 μm. The surface of CNTs was coated by Ni to improve the bonding between CNT and Mg matrix. The synthesis procedure included three sequential steps: mixing, compacting, and sintering. First, CNTs and Mg powders were mixed in a planetary ball mill for 80 min. Second, the mixture was compacted in a cylindrical mold to plate samples under a pressure of ∼60 MPa for 3 h at room temperature. Last, the compacted billets were taken out from the mold and sintered at 800 °C for 20 min and then held at 600 °C for 2 h. The obtained composite samples were prepared and examined under an optical microscope and a scanning electron microscope (SEM). The samples before and after sintering were also characterized using x-ray diffraction technique. Cubic samples with a dimension of ∼(4 × 4 × 7) mm3 were cut from the sintered bulk samples for mechanical testing. The mechanical tests were performed under compression at room temperature and at a strain rate of ∼10−3/s. For each composite, two groups of samples were mechanically tested and each group had three samples. One group was loaded along the compacting direction and this group was referred to as the plane normal sample. The other group was loaded perpendicular to the compacting direction and was referred to as the in-plane sample. The fractured surfaces of tested samples were observed under SEM.
Experimental and theoretical densities (ρExp. and ρTheo.) of Mg composites with 0.05%, 0.2%, 0.5%, 1%, 2%, and 5% CNT, respectively.

Raw materials utilized to synthesize CNT-reinforced Mg composites. (a) Mg powders and (b) CNTs.

III. RESULTS
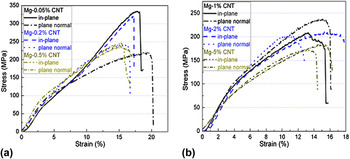
Figure 2 showed compressive stress–strain curves for the composites tested along the plane normal orientation and the in-plane orientation. The composites could be classified into two groups based on the curve shape. In one group of composites shown in Fig. 2(a), the curve shape along the plane normal orientation was different from that along the in-plane orientation for each specific weight percentage, and the curve along the in-plane orientation had a sigmoid shape with an inflection point. This difference in the curve shape along the two orientations existed in the composites with 0.05%, 0.2%, and 0.5% CNT as shown in Fig. 2(a). With the increase of CNT weight percentage, the differences between the in-plane curve and the plane normal curve became less obvious for this group. In the other group of composites shown in Fig. 2(b), the curve shape difference along the two orientations disappeared and these composites had 1% or higher percentages of CNT. The curves had the shape with no inflection point for both orientations. The curves for Mg–1% CNT, Mg–2% CNT, and Mg–5% CNT were reported in Fig. 2(b).
Compressive stress–strain curves for samples tested along the plane normal and in-plane orientations. (a) Mg–0.05% CNT, Mg–0.2% CNT, and Mg–0.5% CNT; (b) Mg–1% CNT, Mg–2% CNT, and Mg–5% CNT.

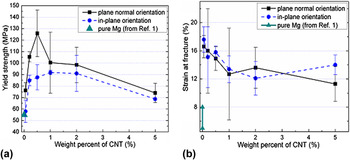
Yield strength σy and strain at fracture εf were reported in Figs. 3(a) and 3(b). σy and εf for pure Mg
Reference Avedesian and Baker1
were also included in Figs. 3(a) and 3(b) for comparison. Yield strengths of cast and extruded pure Mg were 21 and 34–55 MPa, respectively, whereas elongations of cast and extruded pure Mg were 2–6% and 5–8%, respectively.
Reference Avedesian and Baker1
Thus, 55 MPa and 5–8% were utilized for pure Mg in Fig. 3. Figure 3(a) showed that (i) average yield strength (
 ${{\bar \sigma }_{\rm{y}}}$
) along the plane normal orientation was higher than that along the in-plane orientation for each CNT weight percentage; (ii)
 ${{\bar \sigma }_{\rm{y}}}$
increased with the increase of CNT weight percentage up to 0.5% for the plane normal orientation and up to 1% for the in-plane orientation and then decreased with the increase of CNT weight percentage; (iii) when the CNT weight percentage was 1% or higher, σy along the plane normal orientation was not significantly different from that along the in-plane orientation for each CNT weight percentage; and (iv) σy was significantly increased compared with that of pure Mg from the Ref. Reference Avedesian and Baker1, and the increase was in the range of 35–129%. The increase of strength may result from the reinforcing/strengthening effect of CNTs. Additionally, a layer of magnesium oxide generally existed on raw Mg particles and can serve as a reinforcing phase, and the magnesium oxide could also contribute to the increase of strength. Figure 3(b) showed that average strain at fracture (
 ${{\bar \varepsilon }_{\rm{f}}}$
) fluctuated with the increase of CNT weight percentage and had an overall trend of slight decrease. εf was similar for all studied composites and was in the range of 12–18%. εf was also higher than the 5–8% elongation of pure Mg.
Reference Avedesian and Baker1
(a) Relation between yield strength and weight percent of CNT; (b) relation between strain at fracture and weight percent of CNT.

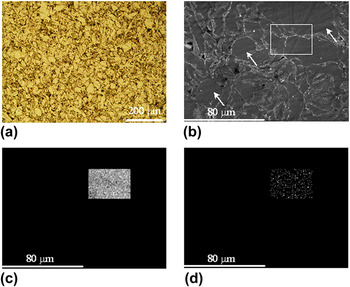
The microstructure was examined under optical microscope [Fig. 4(a)] and SEM [Figs. 4(b)–4(d)] for the Mg–0.05% CNT composite. Figures 4(a) and 4(b) showed the fusion of Mg powders and the grain boundaries were along the interfaces. Figure 4(b) also displayed the existence of twins as pointed out by the white arrows. The regime surrounded by the white rectangle in Fig. 4(b) was analyzed using the energy-dispersive x-ray spectroscopy (EDS) technique. The EDS data in Figs. 4(c) and 4(d) presented the distribution of Mg and carbon (C), respectively. C had a low concentration and existed as particles.
Micrographs of Mg–0.05% CNT composite. (a) Optical image, (b) SEM image, (c) Mg distribution in the white rectangle in (a), and (d) C distribution in the white rectangle in (a).

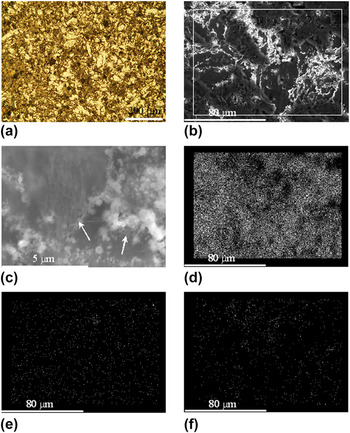
The microstructure was investigated under optical microscope [Fig. 5(a)] and SEM [Figs. 5(b)–5(f)] for the Mg–1% CNT composite. Resembling Fig. 4(a), the grain boundaries were along the powder interfaces. Unlike Fig. 4(b), no twins were observed in Fig. 5(b). Figure 5(c) showed the CNTs within the sample and the agglomerations of CNTs as pointed by the white arrows. The regime surrounded by the white rectangle in Fig. 5(b) was analyzed using the EDS technique. The EDS data in Figs. 5(d)–5(f) presented the distribution of Mg, C, and Ni, respectively. Comparing with those in Fig. 4(d), the distances between neighboring particles in Mg–1% CNT were larger than those in Mg–0.05% CNT. The sparser C distribution may result from the CNT agglomerations and lead to less effective strengthening.
Micrographs of Mg–1% CNT composite. (a) Optical image, (b) SEM image for EDS analysis, (c) zoomed-in SEM image of CNT agglomeration, (d) Mg distribution in the white rectangle in (a), (e) C distribution in the white rectangle in (a), and (f) Ni distribution in the white rectangle in (a).

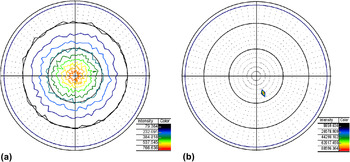
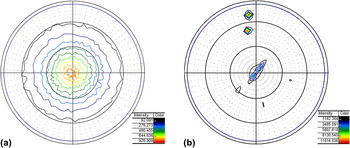
Figures 6 and 7 demonstrated the pole figures for two selected group of samples. The selection of samples was guided by the compressive stress–strain curves in Fig. 2. One group of samples had 0.05% CNT (i.e., low CNT weight percentage) and the other group of samples had 1% CNT (i.e., high CNT weight percentage). Each group had one sample (S1) that experienced compacting and no sintering, and the other sample (S2) that experienced compacting and sintering. For both CNT weight percentages, the sample S1 had a strong basal texture. This texture was generated due to compacting process and was altered by the subsequent sintering process. For the composite with 1% CNT, the 0001 pole of grains had the highest intensity at an angle that was about 50° from the normal direction of the compacted plate (i.e., the compacting direction), although it still had a weak basal texture left with the 0001 pole at about 5° from the compacting direction. For the composite with 0.05% CNT, the 0001 pole of grains had the highest intensity at an angle that was about 20° from the compacting direction.
(a) 0001 pole figure for the Mg–0.05% CNT composite before sintering and (b) 0001 pole figure for the Mg–0.05% CNT composite after sintering.

(a) 0001 pole figure for the Mg–1% CNT composite before sintering and (b) 0001 pole figure for the Mg–1% CNT composite after sintering.

As shown in Fig. 2, the stress–strain curves had an inflection point for the in-plane samples with low CNT weight percentage (≤0.5% CNT); and the stress–strain curves for all the other samples had no inflection point. This phenomenon could be due to the reason that the samples with different CNT weight percentages had different microstructures. Based on Fig. 6, the composites with 0.05% CNT had the maximum basal pole intensity along a direction that is ∼20° away from the compacting direction. Twinning operated during the mechanical testing for only the in-plane samples and resulted in the inflection point on the stress–strain curves. Based on Fig. 7, the composite with 1% CNT had a weak leftover basal texture with the basal poles at an angle of ∼5° away from the compacting direction and the maximum basal pole intensity along a direction that is ∼50° away from the compacting direction. The basal pole was ∼50° from the loading direction for the plane normal samples and ∼40° from the loading direction for the in-plane samples. The stress–strain curves had no inflection point for the plane normal and in-plane samples with 1% or higher CNT. There was no significant difference between the yield strength of the plane normal samples and that of the in-plane samples when the CNT weight percentage was 1% or higher.
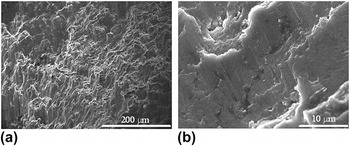
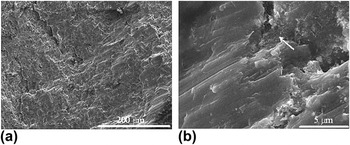
The fracture surfaces were examined under SEM for the tested composites with 0.05% and 1% CNTs. The microstructure results showed that the samples tested along the in-plane and plane normal orientations exhibited similar fracture surfaces for both composites. Thus, only the micrographs for the in-plane samples were included in Figs. 8 and 9. For the Mg–0.05% CNT composite, Fig. 8(b) at high magnification showed the occurrence of extensive cleavage-like smooth surface with sharp breaking edges and numerous microcracks in the matrix, and thus intrinsic brittle feature, while Fig. 8(a) at low magnification exhibited severe plastic deformation on the fracture surface. The intrinsic brittleness may be due to the existence of an oxide layer on the raw Mg particles. This plastic deformation possibly resulted from the reinforcing CNTs. The fractographs in Fig. 9 for Mg–1% CNT composite had similar features as those in Fig. 8, while CNTs [white arrow in Fig. 9(b)] can be clearly observed at the cracks in Fig. 9.
Fractographs for the in-plane composite sample with 0.05% CNT that experienced compressive testing. (a) Low magnification and (b) high magnification.

Fractographs for the in-plane composite sample with 1% CNT that experienced compressive testing. (a) Low magnification and (b) high magnification.

IV. DISCUSSION
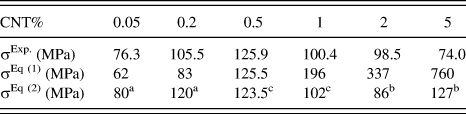
As shown in Fig. 3(a), the average yield strengths for the plane normal samples were higher than those for the in-plane samples for each CNT weight percentage. The following discussion would focus on yield strength for the plane normal samples. The average yield strengths in Fig. 3(a) were 76.3, 105.5, 125.9, 100.4, 98.5, and 74.0 MPa for the plane normal samples with 0.05%, 0.2%, 0.5%, 1%, 2%, and 5% CNT, respectively (shown in Table II). Comparing to the data with the reported high-end value of yield strength (55 MPa) for pure Mg, Reference Avedesian and Baker1 the improvements were 39%, 92%, 129%, 83%, 79%, and 35% for the composites with 0.05%, 0.2%, 0.5%, 1%, 2%, and 5% CNT, respectively. A peak in yield strength was observed with the increase of CNT weight percentage. A similar phenomenon was also reported for CNT-reinforced aluminum, Reference Esawi and El Borady23 and it was explained by the agglomeration of CNTs. The agglomeration became more severe with the increase of the amount of CNT. To theoretically analyze the effect of the reinforcing phase on yield strength, we could utilize the rule of mixture in the following equation, Reference Hertzberg31
 $${{\rm{\sigma }}_{\rm{y}}}{\rm{(composite)}} = {{\rm{\sigma }}_{{\rm{matrix}}}}{\rm{ \times }}\left( {1 - f} \right) + {{\rm{\sigma }}_{{\rm{CNT}}}}{\rm{ \times }}f\quad ,$$
where σy(composite), σmatrix, and σCNT were the yield strengths of the composite, the matrix, and the reinforcing CNT phase, and f was the volume fraction of the reinforcing phase. σCNT was reported to be in the range of 11 and 63 GPa. Reference Yakobson, Avouris, Dresselhaus, Dresselhaus and Avouris32 The density of CNT is 1.3–1.4 g/cm. Reference Collins33 When taking 55 MPa and 11 GPa for σmatrix and σCNT, the predicted yield strengths were 62, 83, 125.5, 196, 337, and 760 MPa for the composites with 0.05%, 0.2%, 0.5%, 1%, 2%, and 5% CNT, respectively (shown in Table II). For the composites with low CNT percentages, the predicted strengths were lower than the experimental data. For the composites with high CNT percentages, the predicted strengths were higher than the experimental data. When CNTs agglomerated, the strength value for σCNT would be lower. The discrepancy between the predicted data and the experimental data indicated that other effects might also need to be included in the theoretical expression. These effects included the Orowan strengthening effect and the strengthening effect due to the mismatch of thermal expansion coefficients (CTEs) for the reinforcing phase and the matrix. The theoretical yield strength expression was as follows, Reference Dieter34,Reference Arsenault and Shi35
 $$ \!{\rm{\sigma }}_{\rm{y}} {\rm{(composite)}} \!= \,{\rm{\sigma }}_{{\rm{matrix}}} + {\rm{\sigma }}_{{\rm{CNT}}} {\rm{ \times }}f + {\rm{\Delta \sigma }}_{{\rm{Orowan}}} + {\rm{\Delta \sigma }}_{{\rm{CTE}}} \cr = \!{\rm{\sigma }}_{{\rm{matrix}}} + {\rm{\sigma }}_{{\rm{CNT}}} {\rm{ \times }}f + {{2.4{\rm{ \times }}b{\rm{ \times }}G_{{\rm{matrix}}} } \over {L_{{\rm{CNT}}} }} + 1.25{\rm{ \times }}b{\rm{ \times }}G_{{\rm{matrix}}} {\rm{ \times }}\sqrt {\rm{\rho }} \quad , \cr} $$
 $${\rm{\rho }} = {{4{\rm{ \times }}f{\rm{ \times }}\Delta T{\rm{ \times }}\Delta {\rm{CTE}}} \over {b{\rm{ \times }}d{\rm{ \times }}(1 - f)}}\quad ,$$
 $${L_{{\rm{CNT}}}} = \sqrt {{{{\rm{\pi \times }}{d^2}} \over {2{\rm{ \times }}f}}} \quad ,$$
where ΔσOrowan, ΔσCTE, b, G matrix, L CNT, and ρ were Orowan strengthening, thermal expansion mismatch strengthening, the Burgers vector of the matrix, the shear modulus of the matrix, the distance between the reinforcing particles, and the dislocation density, respectively. ΔT, ΔCTE, and d were the temperature difference between the synthesis and the testing, the difference of CTE between the matrix and the reinforcing phase, and the diameter of the reinforcing phase, respectively. With the change of CNT weight percentage, different values for d and σCNT needed to be utilized for the strength prediction. For the composites with low CNT weight percentage, we used the average diameter of CNT (i.e., 40 nm) in the prediction, and the predicted yield strengths were 80 and 120 MPa for the composites with 0.05% and 0.2% CNT, respectively. With the increase of CNT weight percentage, it was assumed that a portion of CNT had d and σCNT to be 10 μm and 1 GPa. The Orowan strengthening and the thermal expansion mismatch strengthening were effective for small reinforcing particles and became negligible when the reinforcing particle size became large (e.g., on the order of microns). When the CNT weight percentage was low (0.05% and 0.2%), the theoretical prediction of yield strength was very close to the experimental data. For the Mg–0.5% CNT composite, it was reasonable to assume that the CNT size may range from 40 nm to 10 μm, and the average prediction for the Mg–0.5% CNT composite was 123.5 MPa. For the Mg–1% CNT composite, the predicted strength was about 102 MPa. These predicted strengths were very close to the experimental data for Mg–0.5% CNT and Mg–1% CNT. For Mg–2% CNT and Mg–5% CNT composites, the predictions were farther away from the experimental data.
Experimental and theoretical yield strength of Mg composites with 0.05%, 0.2%, 0.5%, 1%, 2%, and 5% CNT, respectively. σExp. is the average yield strength from the experimental data. σ Eq (1) and σ Eq (2) are the theoretical yield strengths predicted using the Eqs. (1) and (2), respectively.

Note:
different values for d and σCNT were utilized to predict strength based on Eq. (2). The difference was represented using the superscripts besides the predicted strengths.
a Indicates that (d, σCNT) = (40 nm, 11 GPa) was used.
b Indicates that (d, σCNT) = (10 μm, 1 GPa) was used.
c Indicates that the predicted yield strength was computed through averaging the predictions using both (d, σCNT) = (10 μm, 1 GPa) and (d, σCNT) = (40 nm, 11 GPa).
V. CONCLUSIONS
In this work, we synthesized CNT-reinforced Mg composites with a series of different CNT weight percentages. For each composition, samples were prepared and tested under compression along the plane normal orientation and the in-plane orientation. The samples were also characterized using optical microscopy, x-ray diffraction, and scanning electron microscopy. A theoretical yield strength model was utilized for predicting the strength of composites. The following conclusions were drawn from this study.
-
(1) Yield strengths of composites were significantly increased compared with that of pure Mg from Ref. Reference Avedesian and Baker1. The increase of yield strength may be due to the addition of CNTs. The magnesium oxide may also contribute to this yield strength increase. Yield strength increased with the increase of CNT till a critical CNT weight percentage and then decreased.
-
(2) Basal texture was formed due to the compaction of composites and was altered during sintering. The texture was changed to a weak leftover basal texture and the maximum basal pole intensity occurred at ∼50° from the compacting direction when the CNT weight percentage was 1%. The maximum basal pole intensity changed to the location at ∼20° from the compacting direction when the CNT weight percentage was 0.05%.
-
(3) When the CNT weight percentage was less than 1%, yield strength showed some difference along the plane normal orientation and the in-plane orientation. Compressive stress–stain curves showed an inflection point for the in-plane orientation, and twinning operated in the composites with less than 1% CNT. Compressive stress–stain curves showed no inflection point for the plane normal orientation of all CNT weight percentages, and twinning was not observed.
-
(4) The strains at fracture were not significantly different from each other for the plane normal orientation and the in-plane orientation for each composite. The strains at fracture for all studied composites were in the range of 12–18% and were higher than the 5–8% elongation of pure Mg. Reference Avedesian and Baker1 The average strain at fracture for the composites showed an overall trend of decreasing very slightly/gradually with the increase of the CNT weight percentage.
-
(5) All composites showed similar fracture surface features. Severe plastic deformation was exhibited in images with low magnification, whereas the observation under high magnification exhibited intrinsic brittle features.
-
(6) The theoretical analysis showed that the model with the Orowan strengthening and the thermal expansion mismatch strengthening could make a good prediction of the strength when the composites had a low CNT weight percentage.
ACKNOWLEDGMENT
The support for the research from the U.S. Department of Energy, Office of Basic Energy Sciences, under Grant No. DE-SC0002144 is greatly appreciated.