Biological self-organization as an inspiration for materials science
Biological form and structure have long fascinated humanity. Cave paintings from as far back as 30,000 bc depict animal and plant forms, Reference Valladas, Clottes, Geneste, Garcia, Arnold, Cachier and Tisnérat-Laborde1 and natural philosophers have collected, described, and classified vast numbers of paleontological and contemporary biological samples. Such samples helped Charles Darwin develop his evolutionary theory. Zoologist E. Haeckel, one of Darwin’s great popularizers, drew the often highly symmetric beauty of life forms, Reference Haeckel2 which led Haeckel to speculate about the transition from crystalline substances to living matter.
More recently, scientists have aspired to quantitatively understand biological organization. In his book On Growth and Form, the “first biomathematician” d’Arcy Wentworth Thompson applied mathematical and physical reasoning to describe the general principles that govern the appearance of biological forms. Reference Thompson3 On the molecular level, E. Schrödinger speculated on the biological necessity of structures that are both regular (like crystals) and aperiodic, allowing storage and transmission of information. Reference Schrödinger4 Similar ideas about the role of information and complexity in the context of materials were later explored by A.L. Mackay. Reference Cartwright and Mackay5 Mathematicians such as A. Turing and J. von Neumann also introduced mechanistic and algorithmic descriptions of pattern formation, morphogenesis, and self-replication. Reference Turing6,Reference Von Neumann and Burks7
Such models of biological organization suggest means by which forms and patterns might be generated artificially. From a materials science point of view, this is of great interest, as there are many fascinating aspects of biological structures that one would like to mimic in an engineering context. For example, biological forms such as folded tissues, butterfly wings, muscles, or the genome often have hierarchical structure and are patterned on multiple length scales. They are responsive and even active; many are highly resilient and can regrow or heal when damaged.
In this article, we discuss how the ability to control DNA interactions can provide a link between theoretical ideas about biological organization and material design. DNA’s unique dual role as a biopolymer and information carrier or “molecular code” allows it to implement mechanisms inspired by biological self-organization to create functional materials with similar properties.
Models of self-organization and self-assembly
Both self-organization and self-assembly refer to the formation of “structure” from simple components without external guidance. But while self-assembly usually means the association of molecular or particulate building blocks into a well-defined structure at thermodynamic equilibrium, “self-organization” refers to the formation of patterns far from thermal equilibrium and also includes temporal and spatiotemporal patterns.
Self-organization can be modeled mathematically using either discrete or continuous frameworks to gain insight into how microscopic interactions can lead to emergent material properties. Discrete cellular automaton Reference Wolfram8 models divide space into cells that can each assume one of a set of different “states.” Generation rules determine how a structure is propagated or updated over time using the current state of a cell and the states of a cell’s neighbors. Analogously, rules for generating or evolving continuous patterns use differential spatial and temporal rules. For example, reaction-diffusion (RD) models describe how coupled chemical reactions kinetics and diffusion can give rise to the formation of stationary and wave-like chemical patterns. Reference Cross and Hohenberg9 These models have previously described natural pattern formation processes. We can now use similar models to rationally design self-assembly and self-organization processes with DNA.
The design of self-organizing systems also involves control of chemical kinetics and other nonequilibrium processes such as diffusion. This design process thus contrasts with design processes described elsewhere in this issue where the goal is to design DNA strands whose thermodynamic ground state (the minimum free-energy structure formed by interactions between the DNA strands) corresponds to the target structure. Design of reactions with DNA relies on the fact that the thermodynamics and kinetics of DNA interactions can be tuned over a wide range. It has even been shown that—theoretically—DNA-based reactions can “simulate” the kinetics of essentially any other chemical process. Reference Soloveichik, Seelig and Winfree10 DNA reactions can thus serve as a general-purpose “programming language” for the implementation and control of self-organization, which in combination with other chemistries can be used to create novel materials with life-like properties.
Algorithms for crystallization and packing
Atoms, molecules, or colloidal particles can crystallize into regular lattices directed by chemical bonds, which result from electrostatic and quantum mechanical interactions. While there are finite sets of periodic two- and three-dimensional crystal forms, Reference Prince and Wilson11 multiple components can be packed into complex, aperiodic forms. Reference Baake and Grimm12,Reference Levine and Steinhardt13 DNA is an ideal material for exploring the types of forms that may be created using crystallization processes because it is possible to design many distinct, specific interfaces that allow particular pairs of components to bind, and further, because the kinetics of attachment may be precisely controlled.
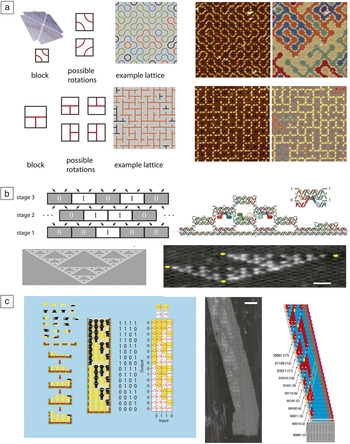
For example, square DNA origami structures can present specific DNA “labels,” either sequences or shapes patterned by DNA folding that direct their interactions. Particular types of such DNA origami “tiles” can assemble into lattices presenting patterns containing random loops or mazes ( Figure 1a). Reference Tikhomirov, Petersen and Qian14 In algorithmic self-assembly, the ordered assembly of components in steps analogous to the execution of a computer program creates specific aperiodic patterns. Reference Winfree15 Monomers present sequences that act as input and output “codes” and the choice of what monomer attaches where can be viewed as an elementary computation (Figure 1b). These processes have been used to self-assemble fractal Reference Rothemund, Papadakis and Winfree16 or counting Reference Barish, Schulman, Rothemund and Winfree17 patterns (Figure 1b–c).
Rule-based assembly of DNA components into complex lattices and structures. (a) (Left) DNA origami blocks with patterns can assemble as different blocks are rotated. (Middle) The resulting structures can present complex aperiodic patterns. (Right) Atomic force microscope (AFM) images (880 × 880 nm2) and their structures shown in a map where colors designate connected components. Reprinted with permission from Reference Reference Tikhomirov, Petersen and Qian14. © 2017 Macmillan Publishers Ltd. (b) In a cellular automaton process, a structure composed of discrete components (here 0 or 1 blocks) uses the state of two nearby components to determine what component is presented in subsequent stages. A “0” is produced if both neighbors are the same, and “1” otherwise. (Bottom left) The process produces a Sierpinski fractal pattern. (Top right) This process can be emulated by DNA tile monomers that encode inputs and outputs as DNA base pairs. Colored blobs indicate DNA extensions used for AFM visualization. (Bottom right) AFM image—yellow marks indicate defects in the assembly. Reprinted with permission from Reference Rothemund, Papadakis and WinfreeReference 16. © 2004 PLoS Biology. Scale bar = 50 nm. (c) Algorithmic self-assembly can also be used to produce circuit-like patterns that could be utilized to produce structures such as a (left) demultiplexer. Reprinted with permission from Reference Cook, Rothemund, Winfree, Chen and ReifReference 18. © 2004 Springer. (Middle) AFM image of an assembled “demultiplexer” or counting pattern with (right) a diagram showing where assembly errors produce an incorrect pattern. Colors are used to distinguish between DNA components with different functions. Scale bar = 50 nm. Reference Barish, Schulman, Rothemund and Winfree17 AFM micrographs in (a–c) show planar lattices formed by self-assembling DNA tiles. The height of a tile is approximately 2 nm. The higher (lighter color) structures visible in the micrographs stem from DNA features protruding from some of the tiles, which are added for visualization purposes.

Unlike DNA origami assembly, algorithmic self-assembly uses just a few molecular components to create complex patterns over large spatial regions, suggesting a route to the formation of extended textures and patterns. Results linking algorithmic self-assembly to the foundations of computer science Reference Soloveichik and Winfree19 give a well-defined concept of the complexity of a self-assembled shape or pattern, in terms of the number of distinct chemical species required to create it, and reveal limits to computing this complexity. Practically, these methods allow one to design efficient schemes for constructing a shape, where the number of distinct chemical species required to create a square is much smaller than the number of molecules in the final structure, such as a square of a specific size. Reference Rothemund and Winfree20
Similar methods are currently used in computer graphics to generate complex background patterns with simple rules. Reference Cohen, Shade, Hiller and Deussen21 Rules for algorithmic crystallization can do more than direct the formation of intricate but static structures; they can enable structures to replicate structural information autonomously Reference Schulman, Yurke and Winfree22 and could in principle enable materials to self-heal by redundantly encoding information about the structure’s form within the components. Reference Winfree23 Component rules could also be dynamic—altered by active message-passing processes that allow for longer-range communication. Reference Padilla, Sha, Kristiansen, Chen, Jonoska and Seeman24 The ability to implement complex rule-based mechanisms such as this in both DNA and other materials provides a novel approach for building structures that can reorganize, grow, shrink, or move in virtually arbitrary ways after they are formed.
Nonlinear dynamics and reaction-diffusion patterns
In 1920, A. Lotka analyzed a hypothetical chemical system that could generate oscillations in the concentrations of chemical species. Reference Lotka25 Experimentally, such a system (albeit with a very different mechanism) was later found in the famous Belousov–Zhabotinsky (BZ) reaction, which belongs to a class of autocatalytic chemical reactions that create a self-sustaining oscillating pattern. Reference Winfree26 This and related chemical systems require a continuous flow of mass and energy, and thus share similarities with living systems, which are also governed by such nonequilibrium chemical processes.
Programming chemical reaction circuits with DNA
Similar to the chemical oscillations that control the cell cycle or circadian rhythms, most “interesting” biological phenomena such as motion, sensing and responsiveness, or self-replication are the result of highly intricate chemical-reaction networks. Thus, the development of “living” materials will inevitably involve the implementation of synthetic-reaction networks as chemical-control systems. Such an endeavor is daunting, however, using conventional chemical approaches based on small molecules, because the specifics of the underlying chemical mechanisms generally make it difficult to create reaction networks with arbitrary topology and predictable behavior. In contrast, the reactivity of nucleic acid components are determined by the sequences of the interacting molecules, which makes nucleic acid-based reaction networks amenable to rational, computer-aided design and simple experimental implementation, as explained by Wang et al. in their article. Reference Wang, Chatterjee, Tan, LaBean, Turberfield, Castro, Seelig and Ke27
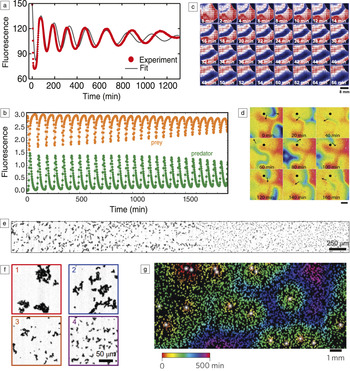
DNA-based chemical-reaction networks can be based on strand displacement reaction processes, where tunable reaction rates and interactions allow complex networks to be rapidly assembled. Reference Zhang and Seelig28 These reaction systems are powered by the energy gained by DNA hybridization by metastable DNA complexes and provide little energy to the system per unit mass. Alternate reactions use enzymes, specifically polymerases and nucleases that synthesize and destroy nucleic acids, and use small molecule fuels rather than long DNA strands. Both enzyme-free and enzyme-assisted nucleic acid circuits have been realized, which have been used as sensors, Reference Kim, Khetarpal, Sen and Murray29 amplifiers, logic gates, Reference Seelig, Soloveichik, Zhang and Winfree30,Reference Qian and Winfree31 molecular classifiers, Reference Qian, Winfree and Bruck32 chemical controllers, Reference Chen, Dalchau, Srinivas, Phillips, Cardelli, Soloveichik and Seelig33 and nonlinear dynamical systems such as oscillators Reference Kim and Winfree34,Reference Montagne, Plasson, Sakai, Fujii and Rondelez35 ( Figure 2 ). Spatially controlled enzymes for enhanced or temporally ordered reactions that mimic the functions of cellular organelles and membranes have also been achieved, as described by Grossi et al. in their article. Reference Grossi, Jaekel, Andersen and Saccà41
Molecular circuits for controlling pattern and dynamics. (a) Chemical oscillations produced by a negative feedback “genelet” circuit, which utilizes DNA gene templates, RNA polymerase enzymes for production of RNA, and RNaseH enzymes for degradation. Reference Schwarz-Schilling, Kim, Cuba, Weitz, Franco and Simmel36 The oscillations are well fit by the solution of a set of differential equations describing the chemical processes in the system (continuous line). (b) Chemical oscillations in a synthetic “predator–prey” system using the “DNA toolbox” system, which is based on enzymatic production and degradation of DNA molecules. Reprinted with permission from Reference Fuji and RondelezReference 37. © 2013 American Chemical Society. Predator and prey species oscillate in antiphase. (c) The genelet oscillator in a spatial context. A “transcription wave” is triggered in the upper left corner by the addition of magnesium ions. Red, white, and blue colors indicate low, intermediate, and high concentrations, respectively, of the fluorescent species in the oscillator. Image courtesy of M. Schwarz-Schilling, TU Munich. (d) A spiral wave (black arrow) observed in a spatially extended negative feedback DNA toolbox system. Concentrations are rainbow color coded (red, high; blue, low). Scale bar = 2 mm. Reprinted with permission from Reference Padirac, Fuji, Estévez-Torres and RondelezReference 38. © 2013 American Chemical Society. (e) Example of a bistable reaction network creating a sharp boundary between two zones with different particle aggregation patterns. (f) Zoomed-in view of the image in (e) showing particles (1 and 2) to the left and (3 and 4) to the right of the boundary. (e–f ) Reprinted with permission from Reference Zadorin, Rondelez, Gines, Dilhas, Urtel, Zambrano, Galas and Estevez-TorresReference 39. © 2017 Macmillan Publishers Ltd. (g) Chemical communication between DNA-covered microbeads generate dynamic spatially extended structures. Reprinted with permission from Reference Gines, Zadorin, Galas, Fuji, Estevez-Torres and RondelezReference 40. © 2017 Macmillan Publishers Ltd.

Pattern formation and reaction-diffusion systems
Structure within materials at length scales of 100 μm or larger can often be created during manufacturing through molding or lithography. Biological systems, in contrast, organize order on these length scales using chemical and physical processes. The ability to autonomously organize matter could allow materials such as living tissues to change their structure over time, potentially in response to stimuli. For example, a material could regrow a pattern after damage, or morph from one shape into another driven by changing chemical environments. Such processes could also potentially be used to organize cells and tissue into designed materials.
The output of nucleic acid circuits can be easily coupled to the organization of DNA-based materials, operated in a spatial context, and be used to program pattern-formation processes. Similarly, as for the BZ reaction, enzyme-driven DNA-based chemical oscillators readily produce chemical waves and spiral patterns, and positive feedback systems have been shown to generate pulse-like propagating wavefronts. Reference Zadorin, Rondelez, Galas and Estevez-Torres42 Reaction-diffusion mechanisms can also be utilized to generate quasi-stationary patterns, which is of particular interest for potential applications in materials science. Recently, the paradigmatic “French flag pattern” well-known in developmental biology—a pattern of three stripe-like regions with distinct concentrations of diffusing chemicals—was created using a DNA circuit operated in a gradient of an artificial morphogen. Reference Zadorin, Rondelez, Gines, Dilhas, Urtel, Zambrano, Galas and Estevez-Torres39 Importantly, the pattern could be “materialized” by using pattern-forming chemicals to control the aggregation state of microparticles, leading to three spatial regions with distinct particle-cluster morphologies.
Quorum sensing and chemical communication
An additional degree of self-organization can be achieved by the implementation of nucleic acid-based “signaling” processes between autonomous agents. Reference Gines, Zadorin, Galas, Fuji, Estevez-Torres and Rondelez40 For instance, μm-sized beads covered with templates for DNA or RNA polymerase can act as “senders,” which generate nucleic acid signals that can be received by other beads modified with sequence-complementary DNA strands. These may respond by producing molecules and sending out signals on their own or by changing their physical interactions with other beads (and thus influence their aggregation state or mechanical properties). In this case, DNA sequences give the particles “identity” and define their interactions and communication capabilities.
In contrast to self-organization within cellular automata in a fixed grid, bead-to-bead communication can be used to implement agent-based self-organization in an irregularly organized or changing collection of components. Such communication could achieve synchronization among a group of particles, or facilitate group-level decision making. For example, materials can simulate “quorum sensing,” which in biology is a mechanism by which bacteria can sense their own population density by sending out and receiving signals that stimulate the production of even more signals. As a result, the bacteria switch on specific genes only when a critical population density has been reached. This simple “social” behavior can also be implemented using artificial agents that exchange and amplify nucleic acid signals. Reference Gines, Zadorin, Galas, Fuji, Estevez-Torres and Rondelez40 Just as bacteria use families of molecules for communication, nucleic acid signals could allow such communication to occur over many channels. These and similar mechanisms could play an important role for the development of active, reconfigurable, and self-differentiating materials by allowing parts of materials to be in one of many states that reflect both their local and global environment and history.
Amorphous materials
Components for artificial cells
The basic units of life are cells—membranous compartments that contain a genetic program, metabolism, and means to take up nutrients, excrete waste, and communicate. Because nucleic acids can create complex molecular structures and dynamical molecular control circuits, they are attractive components for artificial, cell-like systems. Such systems are not the only subject of fundamental interest—artificial cells could revolutionize chemical production processes or facilitate the generation of tissue-like living materials.
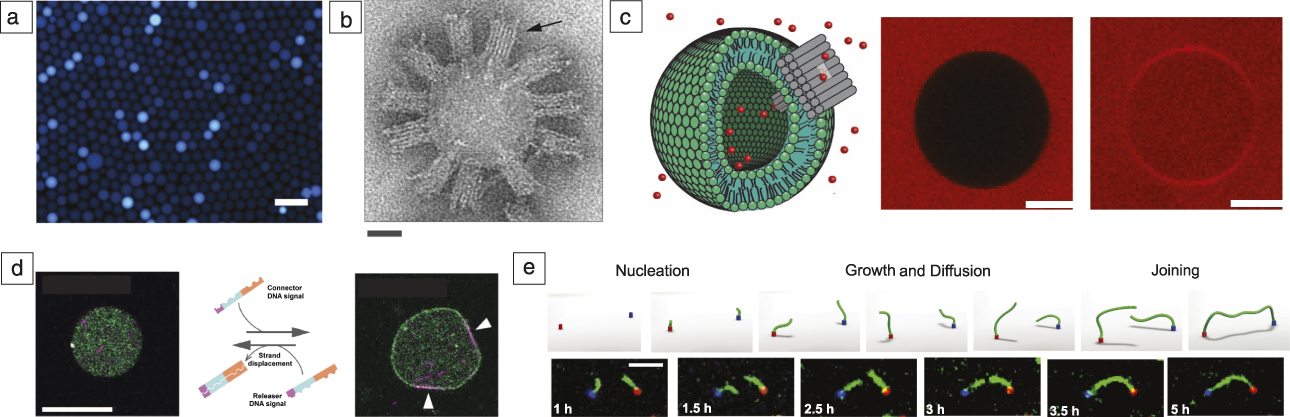
Various steps have been taken to integrate nucleic acids into cell-like compartments, mimicking certain aspects of cellular function. Nucleic acid-based circuits have been encapsulated into emulsion droplets ( Figure 3a) Reference Weitz, Kim, Kapsner, Winfree, Franco and Simmel43,Reference Hasatani, Leocmach, Genot, Estevez-Torres, Fujii and Rondelez44 (mimicking some type of metabolism or genetic circuitry inside of a cell), nucleic acid nanostructures have been attached to lipid bilayer membranes serving as scaffold structures or as artificial membrane pores (Figure 3b–c), Reference Langecker, Arnaut, Martin, List, Renner, Mayer, Dietz and Simmel45 and aspects of cytoskeletal assembly have been simulated with nucleic acid-based assemblies Reference Kurokawa, Fujiwara, Morita, Kawamata, Kawagishi, Sakai, Murayama, Nomura, Murata and Takinoue47 (Figure 3d). Artificial cells with a rich internal structure could thus form building blocks for self-organized materials.
Amorphous materials. (a) Fluorescence micrograph of emulsion droplets containing a genelet oscillator. Scale bar = 100 µm. Reference Weitz, Kim, Kapsner, Winfree, Franco and Simmel43 (b) Electron microscope image of a small unilamellar vesicle covered with DNA-based membrane channels (arrow). Scale bar = 25 nm. Reference Langecker, Arnaut, Martin, List, Renner, Mayer, Dietz and Simmel45 (c) DNA membrane channels enabling molecule influx into giant unilamellar vesicles. The scheme on the left shows a schematic of the experiment (a lipid bilayer vesicle is shown in green, a DNA membrane channel in gray, fluorescent molecules in red, not drawn to scale). Images on the right show cross sections of a giant vesicle obtained by confocal fluorescence microscopy (middle) before and (right) after channel-mediated influx of the red dye surrounding the vesicle. Scale bar = 10 µm. Reference Krishnan, Ziegler, Arnaut, Martin, Kapsner, Henneberg, Bausch, Dietz and Simmel46 (d) A DNA signal can (right) engage or (left) disengage membrane localization and motion of microtubules encapsulated in a liposome. Orange and blue sequence domains of the DNA signals connect to membrane and microtubules, respectively, while the violet domain acts as a toehold. White arrows in the fluorescence micrograph indicate microtubule attachment. Scale bar = 20 µm. Reprinted with permission from Reference Sato, Hiratsuka, Kawamata, Murata and NomuraReference 48. © 2017 AAAS. (e) Assembly of filaments connecting molecular landmarks encoded by sequence. Reference Mohammed, Šulc, Zenk and Schulman52 Pairs with specific sequences may be connected over a range of μm-scale distances. The blue and red colors indicate DNA nanotube seeds, with connecting DNA nanotubes shown in green. Top: Schematic of the process. Bottom: Fluorescence micrographs. Scale bar = 5 µm.

Soft materials and hydrogels
DNA can also be used as an integral component of soft materials, leading to control over both mesoscale (≈1 µm–1 mm) morphology and stimulus responsiveness. For example, DNA junctions with Y, X, or T-shape topologies can form hydrogels with different structures. Reference Um, Lee, Park, Kwon, Umbach and Luo49 DNA origami components—monodisperse DNA objects that can be precisely defined with nanometer dimensions—have also been shown to form liquid crystals. Reference Douglas, Chou and Shih50,Reference Siavashpouri, Wachauf, Zakhary, Praetorius, Dietz and Dogic51 Generally, DNA design techniques offer the potential of creating amorphous materials with explicit control over topology or mechanical properties, or specific patterns of connectivity Reference Mohammed, Šulc, Zenk and Schulman52 (Figure 3e). Dynamic DNA strand displacement processes also make it possible to design materials that are responsive to DNA or small molecule inputs. For example, DNA signals can stimulate the melting, softening, or stiffening of hydrogels, Reference Kahn, Hu and Willner53 can trigger the release of small molecules, proteins, or larger particles, Reference Liedl, Dietz, Yurke and Simmel54 and can direct large-scale swelling or shape change. Reference Cangialosi, Yoon, Liu, Huang, Guo, Nguyen, Gracias and Schulman55
Perspectives
The programmable and predictable combinatorial interactions between DNA molecules can be utilized to design chemical systems with complex structure and dynamics. In such systems, nucleic acids typically take on multiple roles simultaneously—they act as molecular addresses and signals for chemical communication and as structural molecules with sequence-dependent binding interactions. Initial demonstrations suggest that both means of interaction can be used to control material properties and to make materials responsive to different stimuli.
In order to realize the full potential of DNA-based molecular programming for applications in materials science, systems for processing different inputs and mechanisms for controlling response timing will be required. Their improved reliability will enable more complex interactions. Control over the energy flow that drives nonequilibrium processes will allow these systems to operate over extended periods of time or store and use energy as needed for large-scale responses. Molecular memory and feedback mechanisms will further increase the complexity and scope of such systems, ultimately allowing us to mimic cellular behaviors and create living materials.
While there is great potential for programming self-organizing systems using nucleic acids, critical questions about reliable design and scaling remain. For example, better integration of standard techniques for manipulation of materials at the mesoscale, such as microfluidic devices, photolithography, or micromanipulation, might allow for standard experiments on materials with features on length scales of micrometers to centimeters. Another perhaps more critical obstacle is that it appears to be difficult to precisely control rates of reaction processes and prevent unintended reactions from occurring in ways that would make it possible to build reliable dynamical systems and to scale their complexity. High-throughput experimentation and systematic modeling are likely to be critical in developing this capacity.
To apply DNA-directed self-organization to create materials with new function, building self-organizing systems that combine DNA and RNA with other material components will be essential. Gothelf Reference Gothelf56 discusses mechanisms that realize some of these ideas through chemical conjugation and DNA functionalization in this issue. Simpler materials may be cost effective in some roles or could provide improved functionality, such as force generation. The ability to systematically integrate DNA-programmed responsive spatiotemporal patterns into materials for specific applications, such as surface coatings, cell scaffolds, therapeutics, soft robotic systems, or electronic devices, will allow us to fully exploit the power of these approaches.
Acknowledgments
F.C.S. acknowledges financial support for related work by the European Research Council (ERC Grant Agreement No. 694410). R.S. acknowledges financial support for related work from the National Science Foundation (NSF 1527377) and US Department of Energy (DE-SC0010426).

Friedrich C. Simmel has been a professor of physics at the Technical University Munich, Germany, since 2007, where he holds the chair of physics of synthetic biological systems. He received his PhD degree in physics from Ludwig-Maximilians-Universität (LMU) München, Germany. After completing postdoctoral research at Bell Laboratories, Murray Hill, he formed his own research group at LMU as a DFG Emmy Noether Fellow. His research currently focuses on the creation of artificial cell-scale systems and the implementation of synthetic biochemical reaction circuits in vitro as well as in vivo. Simmel can be reached by phone at +49 289 11610 or by email at simmel@tum.de.

Rebecca Schulman is an assistant professor of chemical and biomolecular engineering and computer science at Johns Hopkins University (JHU). She received her PhD degree from the California Institute of Technology. After serving as a Miller Research Fellow in physics at the University of California, Berkeley, she moved to JHU. Her research focuses on the design of DNA-based materials capable of complex stimulus response, adaptation, and self-organization. Schulman can be reached by phone at 410-516-8457 or by email at rschulman@jhu.edu.