Introduction
Studies of the population dynamics of tropical insects, primarily in the Neotropics, have demonstrated that population fluctuation patterns differ among guilds and taxa (e.g. Wolda, Reference Wolda1978a, Reference Wolda1980, Reference Wolda1989; Wolda & Roubik, Reference Wolda and Roubik1986). Individual population fluctuations are not always synchronized, even within the same taxa or guilds (Wolda & Fisk, Reference Wolda and Fisk1981; Wolda & Broadhead, Reference Wolda and Broadhead1985; Wolda, Reference Wolda1989). If individual populations exhibit peaks in abundance during different periods, the peaks may be concealed when the populations are analyzed together. In contrast, populations of dominant species that exhibit fluctuation patterns with clear peaks may generate this pattern at the community level, even if populations of most species fluctuate irregularly, without synchronization. Therefore, to better understand the population and community dynamics of tropical insects, research on population fluctuations must be based on individual populations. However, except for several studies in the Neotropics (e.g. Wolda, Reference Wolda1980, Reference Wolda1989), interspecific variations in population fluctuation patterns have not been thoroughly investigated in tropical areas.
The core Southeast (SE) Asian tropical rainforest region has one of the wettest and most aseasonal climates of any tropical region (Whitmore, Reference Whitmore1984; Harrison, Reference Harrison2001). However, this area also experiences occasional severe droughts associated with El Niño-Southern Oscillation (ENSO) events (Walsh, Reference Walsh and Richards1996; Harrison, Reference Harrison2001). Northern Borneo suffered a very severe drought in conjunction with the 1997–1998 ENSO, and some insect species subsequently suffered a drastic decrease in abundance or even local extinction (Harrison, Reference Harrison2000, Reference Harrison2001; Kishimoto-Yamada & Itioka, Reference Kishimoto-Yamada and Itioka2008a), suggesting that severe droughts have negative impacts on tropical insect abundance and species composition. On the other hand, most canopy trees flushed simultaneously immediately after the drought ended, and the large amount of newly flushed leaves likely had positive effects on the growth of many herbivores (Itioka & Yamauti, Reference Itioka and Yamauti2004). Thus, severe drought can substantially affect the patterns of herbivore population dynamics by synchronizing leaf phenology at the community level.
General flowering (GF), a phenomenon of synchronized flowering across diverse plant groups, occurs in lowland dipterocarp forests in SE Asia (Appanah, Reference Appanah1985; Ashton et al., Reference Ashton, Givnish and Appanah1988; Sakai, Reference Sakai2002). GF events occur irregularly, at intervals of several years, and flowering persists for at least three months during an event (Sakai et al., Reference Sakai, Momose, Yumoto, Nagamitsu, Nagamasu, Hamid and Nakashizuka1999a, Reference Sakai, Momose, Yumoto, Nagamitsu, Nagamasu, Hamid Karim, Nakashizuka, Inoue, Roubik, Sakai and Hamid Karim2005). During GF periods, most Dipterocarpaceae and many plants of other families flower and fruit profusely (Sakai et al., Reference Sakai, Momose, Yumoto, Nagamitsu, Nagamasu, Hamid and Nakashizuka1999a, Reference Sakai, Momose, Yumoto, Nagamitsu, Nagamasu, Hamid Karim, Nakashizuka, Inoue, Roubik, Sakai and Hamid Karim2005). GF events are thought to be induced by temperature drops, drought, or both, and to be associated with ENSO (e.g. Ashton et al., Reference Ashton, Givnish and Appanah1988; Curran et al., Reference Curran, Caniago, Paoli, Astianti, Kusneti, Leighton, Nirarita and Haeruman1999; Yasuda et al., Reference Yasuda, Matsumoto, Osada, Ichikawa, Kachi, Tani, Okuda, Furukawa, Nik and Manokaran1999; Sakai et al., Reference Sakai, Harrison, Momose, Kuraji, Nagamasu, Yasunari, Chong and Nakashizuka2006). Populations of insects that depend on floral resources (i.e. pollinators and pollen- and flower-feeders) tend to be affected by GF events (Appanah & Chan, Reference Appanah and Chan1981; Kato et al., Reference Kato, Itioka, Sakai, Momose, Yamane, Hamid and Inoue2000; Itioka et al., Reference Itioka, Inoue, Kaliang, Kato, Nagamitsu, Momose, Sakai, Yumoto, Mohamad, Hamid and Yamane2001).
The Chrysomelidae is a diverse family of beetles, with phytophagous adults and larvae (Reid, Reference Reid2000). In Borneo, it is a dominant insect group on dipterocarp flowers during GFs (Momose et al., Reference Momose, Yumoto, Nagamitsu, Kato, Nagamasu, Sakai, Harrison, Itioka, Hamid and Inoue1998; Sakai et al., Reference Sakai, Momose, Yumoto, Kato and Inoue1999b) and includes some species that pollinate flowers of at least one canopy-tree species of Shorea, a dominant dipterocarp genus (Sakai et al., Reference Sakai, Momose, Yumoto, Kato and Inoue1999b). Most canopy-foraging chrysomelid species feed on petals during GFs and flushing leaves when flowers are scarce (Kishimoto-Yamada & Itioka, Reference Kishimoto-Yamada and Itioka2008b). Thus, synchronous leafing after irregularly severe droughts, as well as irregular GF events, could cause, in SE Asian rainforests, dramatic changes in the availability and abundance of resources for phytophagous chrysomelid beetles, thus affecting population fluctuation patterns. Simultaneously, drastic increases and decreases in the abundance of chrysomelids could affect the reproductive success and dynamics of canopy trees. To date, chrysomelid population dynamics have not been thoroughly investigated in relation to severe droughts and GF. Kato et al. (Reference Kato, Inoue, Hamid, Nagamitsu, Merdek, Nona, Itino, Yamane and Yumoto1995) analyzed the temporal patterns of chrysomelid abundance in a SE Asian rainforest, but their analyses grouped all light-trapped chrysomelids for only one year. Thus, the relationship between fluctuations in individual populations of Chrysomelidae and irregularly occurring drought and GF warrants further examination.
Light trapping has been used to compile a long-term data set, analyzing insect population dynamics in the tropics (e.g. Wolda, Reference Wolda1978b, Reference Wolda1989, Reference Wolda1992). The Chrysomelidae were among the most abundant beetle taxa caught in light traps in a Bornean rainforest (Kato et al., Reference Kato, Inoue, Hamid, Nagamitsu, Merdek, Nona, Itino, Yamane and Yumoto1995).
We used light traps to collect chrysomelid species in a Bornean rainforest over approximately seven years. We examined the relationship between fluctuations of individual populations of chrysomelid species and two irregular, supra-annual events: an ENSO-associated severe drought and GFs. In addition, we compared fluctuation patterns of individual populations to those of the entire chrysomelid assemblage to highlight the diversity of fluctuation patterns among populations. We also examined the relative magnitude of between- and within-year variation in patterns of individual population dynamics to understand the relative importance of supra-annual variation in insect population fluctuations in the SE Asian tropics, where supra-annual environmental events are thought to have relatively larger effects than in other regions.
Materials and methods
Study site
The study was conducted in the Canopy Biology Plot (CBP, 200×400 m: Inoue et al., Reference Inoue, Yumoto, Hamid, Lee and Ogino1995) at Lambir Hills National Park, Sarawak, Malaysia (4°2′ N, 113°50′ E; 150 m altitude). The local vegetation is classified as typical lowland mixed dipterocarp forest (Ashton & Hall, Reference Ashton and Hall1992) with extremely high tree species diversity (Condit et al., Reference Condit, Ashton, Baker, Bunyavejchewin, Gunatilleke, Gunatilleke, Hubbell, Foster, Itoh, LaFrankie, Lee, Losos, Manokaran, Sukumar and Yamakura2000). Monthly rainfall is rarely less than 100 mm (Sakai et al., Reference Sakai, Momose, Yumoto, Nagamitsu, Nagamasu, Hamid and Nakashizuka1999a; Ichie et al., Reference Ichie, Hiromi, Yoneda, Kamiya, Kohira, Ninomiya and Ogino2004); and the average annual rainfall is 2751 mm, ranging between 2044 and 3827 mm over 17 years (Ichie et al., Reference Ichie, Hiromi, Yoneda, Kamiya, Kohira, Ninomiya and Ogino2004). During our study, a severe drought, associated with the 1997–1998 ENSO, occurred from January to March 1998 (Nakagawa et al., Reference Nakagawa, Kenta, Nakashizuka, Ohkubo, Kato, Maeda, Sato, Miguchi, Nagamasu, Ogino, Teo, Hamid and Lee2000). The total rainfall during the first quarter of 1998 was 24% of the average January–March rainfall (Nakagawa et al., Reference Nakagawa, Kenta, Nakashizuka, Ohkubo, Kato, Maeda, Sato, Miguchi, Nagamasu, Ogino, Teo, Hamid and Lee2000).
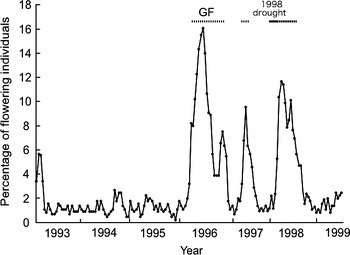
At CBP, the phenological patterns of canopy tree flowering and fruiting (576 plants of 305 species) have been monitored since 1992, using tree towers and aerial walkways (Sakai et al., Reference Sakai, Momose, Yumoto, Nagamitsu, Nagamasu, Hamid and Nakashizuka1999a, Reference Sakai, Momose, Yumoto, Nagamitsu, Nagamasu, Hamid Karim, Nakashizuka, Inoue, Roubik, Sakai and Hamid Karim2005). GF, defined as a period during which >6% of individual canopy trees flowered, occurred three times during our study: late March–mid-June and late August–early October 1996 (considered one event, as light trapping was conducted only once between the first and second GF events), mid-April–early June 1997, and mid-March–late June 1998 (fig. 1: Sakai et al., Reference Sakai, Momose, Yumoto, Nagamitsu, Nagamasu, Hamid and Nakashizuka1999a; Kato et al., Reference Kato, Itioka, Sakai, Momose, Yamane, Hamid and Inoue2000; Itioka et al., Reference Itioka, Inoue, Kaliang, Kato, Nagamitsu, Momose, Sakai, Yumoto, Mohamad, Hamid and Yamane2001; Sakai, Reference Sakai2002).
Changes in flowering intensity at Lambir Hills National Park, following Sakai (Reference Sakai2002). The black line indicates the 1998 drought, and dotted lines indicate general flowering (GF) periods.

Insect collection
At CBP, light-trapping has been conducted nearly every month since 1992 to monitor the population dynamics of nocturnal flying insects (Kato et al., Reference Kato, Inoue, Hamid, Nagamitsu, Merdek, Nona, Itino, Yamane and Yumoto1995). Light traps were placed at a tree tower for four consecutive days during new-moon periods, as described by Kato et al. (Reference Kato, Inoue, Hamid, Nagamitsu, Merdek, Nona, Itino, Yamane and Yumoto1995, Reference Kato, Itioka, Sakai, Momose, Yamane, Hamid and Inoue2000). All collected insects were kept in the Forest Research Centre (FRC) of Sarawak in Kuching. We sorted out all chrysomelids collected between February 1993 and July 1999. Because of technical difficulties, comparable collections were not made in mid-March–mid-July 1993, mid-October and mid-December 1993, mid-January 1994 and September 1997–March 1998.
We defined Chrysomelidae according to Reid (Reference Reid2000). However, the Bruchinae, which are a negligible element of SE Asian Chrysomelidae in both abundance and diversity (Borowiec, Reference Borowiec1987; Reid, Reference Reid1998), were not included. All chrysomelids collected for this study were sorted into morphospecies on the basis of external characteristics, with reference to a collection of specimens identified by Chris Reid.
The total number of specimens collected in three light traps during the four consecutive days of each new-moon period was considered the ‘monthly catch’. We selected abundant morphospecies, based on at least one of the following two criteria: (i) the maximum monthly catch was ≥20 individuals, or (ii) the maximum monthly catch was ≥10 individuals, and the total of all monthly catches of the species was ≥100 individuals. Several Colaspoides and Nodina (Eumolpinae) and Monolepta (Galerucinae) morphospecies were excluded because of sorting difficulties. The 34 most abundant and distinct morphospecies were selected as target species (table 1).
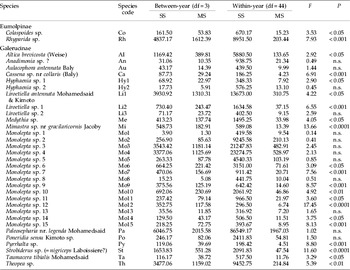
Results of the F-tests to determine the relative magnitude of between- and within-year variation.

n.s., non significant. F and P values are for the ratio of between-year variance to within-year variance.
Data analysis
To examine chrysomelid population dynamics in relation to the two supra-annual events (GF and severe drought), we used redundancy analysis (RDA) after first checking the gradient length using detrended correspondence analysis (Jongman et al., Reference Jongman, Ter Braak and Van Tongeren1995; Van Wijngaarden et al., Reference Van Wijngaarden, Van den Brink, Voshaar and Leeuwangh1995; Ter Braak & Šmilauer, Reference Ter Braak and Šmilauer2002); the first axis was 1.3 SD. These analyses were performed using CANOCO 4.5 software (Ter Braak & Šmilauer, Reference Ter Braak and Šmilauer2002). We logarithmically transformed the monthly catches of the 34 selected species, using log(x+1). We used RDA to investigate the effect of each of the two environmental variables, proportion of canopy trees flowering and occurrence of severe drought, on species abundances of a chrysomelid assemblage. The former was based on quantitative data from the phenological census of canopy trees (see Study site). We used arcsine-transformed values of the proportions of flowering trees as variables. Because the census intervals of flowering phenology (every two weeks) and light trapping (monthly) differed, we used the flowering data from the date closest to the first date of monthly light trapping. To investigate the effect of the severe drought, we used either 0 (pre-drought period) or 1 (post-drought period) as dummy variables. No light-trap data were available from the severe drought that occurred during the first quarter of 1998, which was referred to as the ‘1998 drought’ (fig. 1; see Insect collection). The environmental variables were tested with 9999 permutations using a forward selection procedure.
To determine the relative magnitudes of between- and within-year variation in the abundances of the 34 species, we conducted F-tests on between- and within-year variances, using data collected over four years (May 1994–April 1997 and May 1998–April 1999).
Results
In all, 19,181 chrysomelids representing at least 316 species, were caught in the light traps. One hundred species were represented by a single specimen. Only 33 species had total collections of ≥100 individuals.
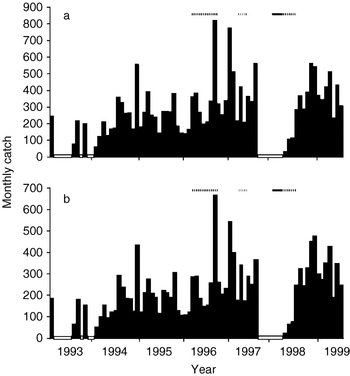
The aggregate number of chrysomelid individuals collected in light traps (fig. 2a) and the number of individuals of the 34 target species (fig. 2b) exhibited similar temporal trends. The numbers of individuals tended to be low during the three-month period immediately following the drought (fig. 2).
Temporal trends in monthly catches for (a) the total number of chrysomelid individuals and (b) the total number of individuals from the 34 selected species. White boxes represent missing data. The black line indicates the 1998 drought, and dotted lines indicate general flowering (GF) periods.

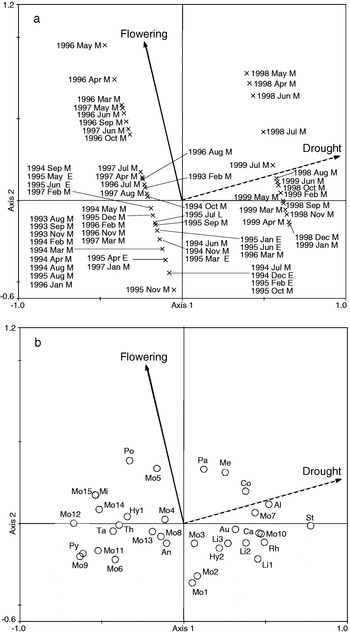
Together, RDA axes 1 and 2 explained 21.9% of the variance in species abundance data, with axis 1 explaining 18.6%. Automatic forward selection revealed that both environmental variables significantly affected the population fluctuation patterns of the 34 selected species (Monte Carlo permutation test; P=0.0001 for drought and P=0.0011 for flowering). The severe drought event (drought) correlated most strongly with axis 1, whereas the proportion of flowering trees (flowering) correlated with axis 2. Thus, of the two environmental variables, drought accounted most strongly for the variation in the population fluctuation patterns of the 34 chrysomelid species.
The light-trapping dates, plotted in the positive vertical area of fig. 3a, indicate that the proportions of the canopy-tree flowering were relatively high, whereas those plotted in the negative vertical area of fig. 3a indicate that the proportions of the canopy-tree flowering were relatively low. Similarly, those plotted in the positive horizontal area of fig. 3a indicate a post-drought period, whereas those plotted in the negative horizontal area of fig. 3a indicate a pre-drought period.
RDA ordination diagrams: (a) plots of the light-trapping dates (E, early part of the month; M, middle of the month; L, late part of the month); (b) plots of the 34 selected species, with the two environmental variables represented by the solid (proportion of flowering trees, quantitative variable) and dotted (severe drought event, dummy variable) arrows.

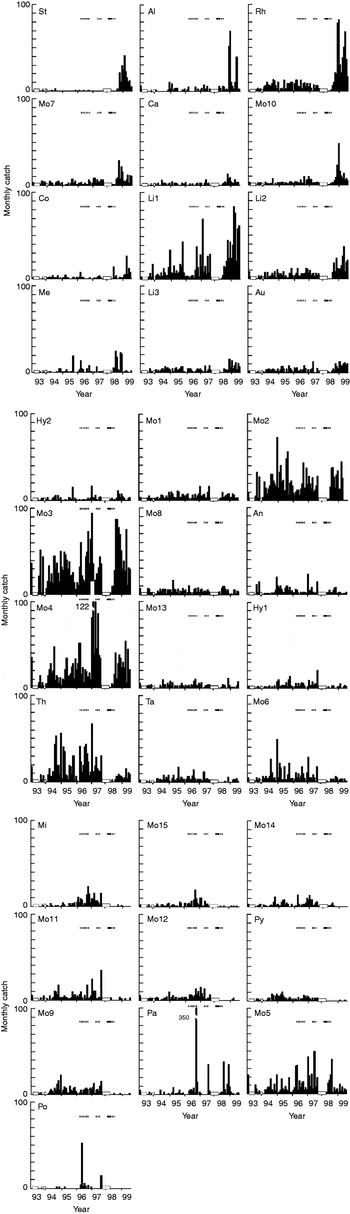
Axis 1 positive and negative values denote positive and negative responses to the occurrence of the severe drought, respectively (fig. 3b). Thus, populations of species plotted in the positive horizontal area of fig. 3b increased after the severe drought, whereas those plotted in the negative horizontal area decreased (fig. 4). The absolute values of axis 1 indicate the magnitude of change. For example, the magnitude of increase was remarkably high in species showing high axis 1 values (e.g. St, Al, Rh, Mo10; fig. 4), whereas the magnitude of decrease was remarkably low in species with low axis 1 values (e.g. Mo12, Mo9, Py; fig. 4). Responses to the drought periods were unclear or inconspicuous in species showing axis 1 near zero (e.g. Mo1, Mo2, Mo3, An; fig. 4).
Temporal trends in monthly catches of each of the 34 selected species. The black line indicates the 1998 drought, and dotted lines indicate general flowering (GF) periods. White boxes represent missing data. See table 1 for species codes.

Although the variation in flowering partly accounted for the variation in the population fluctuation patterns of the 34 target species, the effect of the variable was smaller than that of drought. The magnitude of increase was remarkably high in species showing high axis 2 values. For example, Pa, Mo15 and Po abundances increased during GF periods (fig. 4).
For most of the 34 target species, the variance in the mean numbers of individuals among years was significantly larger than that within years (F-test; table 1), indicating that the magnitude of fluctuations in the annual means of individual numbers was relatively larger than that of fluctuations in monthly individual numbers within a year. The within-year variance was not significantly larger than the between-year variance for each of the 34 species (F-test, P>0.05).
Discussion
Population fluctuation patterns can vary greatly, even in an assemblage of species that are closely related taxonomically and use similar resources. In addition, population responses to changes in environmental conditions can differ greatly among species (fig. 4). In our study, this variation would have been masked if we had grouped either all 34 species or several dominant species to analyze fluctuations in chrysomelid abundance. Fluctuations in the grouped data exhibited apparent decreases immediately after the drought (fig. 2), whereas populations of most individual species showed different patterns (fig. 4).
Similar discrepancies between patterns of an entire assemblage and those of individual populations occur in the Neotropics. For example, since individual populations exhibit seasonal peaks during different periods, the fluctuation patterns of peaks in abundance are concealed if all species are analyzed together (Wolda & Broadhead, Reference Wolda and Broadhead1985). This suggests that population dynamic studies of individual tropical insect species should be conducted using a variety of insect communities whenever possible. However, tropical insect assemblages are so species-rich and contain so many rare species that research on individual populations is difficult.
Itioka & Yamauti (Reference Itioka and Yamauti2004) demonstrated that an assemblage of leaf-chewing lepidopteran insects responded as a whole with dramatic increases in abundance immediately after the end of the 1998 drought. However, our study suggests that chrysomelid populations, especially those of dominant species, did not respond similarly to this drought. In addition, although Kato et al. (Reference Kato, Inoue, Hamid, Nagamitsu, Merdek, Nona, Itino, Yamane and Yumoto1995) analyzed temporal patterns in the abundance of a chrysomelid assemblage in relation to climate factors, such as rainfall, our results suggest that a single climatic factor does not always determine the population fluctuations of individual species in a chrysomelid assemblage. Thus, the scale of analyses must be carefully considered when interpreting the dynamics of chrysomelid assemblages in relation to temporal changes in environmental conditions.
Several studies have argued that fluctuations in insect abundances may correspond to changes in rainfall, even in aseasonal areas of the SE Asian tropics (Fodgen, Reference Fogden1972; Kato et al., Reference Kato, Inoue, Hamid, Nagamitsu, Merdek, Nona, Itino, Yamane and Yumoto1995). However, such claims may not be universally valid for two reasons. First, these studies analyzed all species together. Second, the data were obtained from short-term population censuses. We found that the population fluctuations of most species were affected by drought associated with an ENSO, and several species exhibited strong decreases after the drought (fig. 4). This phenomenon would be overlooked by short-term studies. The larger between- versus within-year variation in population abundances emphasizes the necessity of long-term studies in tropical rain forests. Although our study covered only one drought event, ENSO-related severe droughts occur at supra-annual intervals (Walsh, Reference Walsh and Richards1996; Harrison, Reference Harrison2001) and affect populations and the entire assemblage of insects (Inoue et al., Reference Inoue, Nakamura, Salmah and Abbas1993; Nakamura et al., Reference Nakamura, Kahono, Hasan, Abbas, Nakano, Koji, Hasyim, Astuti and Syafril2001; Itioka & Yamauti, Reference Itioka and Yamauti2004; Van Bael et al., Reference Van Bael, Aiello, Valderrama, Medianero, Samaniego and Wright2004). Thus, long-term studies are required to accurately interpret population fluctuations of tropical insects, particularly in areas with supra-annual environmental events, such as ENSO-related severe droughts and weak seasonal climate change.
Our RDA results showed that the fluctuation patterns of the 34 species were most clearly characterized by changes in the relative abundances of populations before and after the drought, although they were also partly correlated with the proportion of flowering trees (fig. 3b). After the drought, several species increased in abundance and others decreased, indicating that the effects of supra-annual droughts on population abundances are not uniform among chrysomelids.
The causal factors that generate the numerical differences in the responses of individual chrysomelid species to drought are still unknown. The assemblage of 34 relatively abundant chrysomelid species is dominated by Galerucinae, as is typical of SE Asian rainforests (Reid, Reference Reid1998). By phylogenetic inference, 31 species are stem, root or at least soil inhabiting species. The three taxa with external larvae are: (i) Altica, probably only on Onagraceae in SE Asia (Samuelson, Reference Samuelson1973; Reid, personal observation); (ii) Pyrrhalta and (iii) Poneridia, both in the subtribe Galerucina, all known members of which have external larvae with a wide variety of hosts (Jolivet & Hawkswood, Reference Jolivet and Hawkeswood1995; Gillespie et al., Reference Gillespie, Tallamy, Riley and Cognato2008; Reid, personal observation). None of the 34 species have recorded hosts, but the soil-inhabiting larvae of several species of the dominant genera, Colaspoides, Ryparida and Monolepta, have been shown to be polyphagous, as are their adults (Pokon et al., Reference Pokon, Novotny and Samuelson2005). The species with free-living larvae did not cluster in the RDA biplot diagram (fig. 3b). This suggests that in the chrysomelid assemblage, feeding habits are not associated with numerical response patterns to drought. Moreover, Monolepta species, which comprised the majority of the selected species, were sparsely distributed in the biplot diagram (fig. 3b), suggesting that no clear relation exists between clusters and taxonomical relatedness. The ability to tolerate drastic environmental changes may determine population fluctuation patterns in relation to drought. By phylogenetic inference, or observation, at least three species of chrysomelid may have herbaceous hosts typical of disturbed habitat: Altica on Onagraceae and Melastomaceae (Samuelson, Reference Samuelson1973; Reid, personal observation in Sumatra), Cassena on Fabaceae (Reid, personal observation in Sumatra and Borneo) and Strobidrus on Convolvulaceae (Reid, Reference Reid1998; Reid, personal observation in Borneo). All rarely appeared before the drought but suddenly increased in abundance after the drought (fig. 4). The presence of these taxa may indicate disturbance. These species may have a relatively high tolerance to severe environmental changes, allowing them to immediately invade the core forest. However, this remains speculative, because we do not know if all species that positively correlate with severe drought have similar tolerances. Moreover, information on the ecological traits of individual chrysomelid species is extremely limited. Intensive investigations of ecological traits, such as host plant range, climate tolerances and life history, are required to determine the factors that affect fluctuations in individual population abundances in SE Asian rainforests.
The fluctuation patterns of a few species positively related with flowering phenology (figs 3 and 4), but flowering phenology may affect only a small fraction of the chrysomelid assemblage. Thus, compared to drought occurrences, GFs have a weaker effect on interspecific variation in population fluctuation patterns of the chrysomelid assemblage. This may not hold true for other insect assemblages. GF events may be a major source in generating interspecific variation in population fluctuation patterns of GF flower-visitors, such as pollinating thrips (Appanah & Chan, Reference Appanah and Chan1981), some flower-visiting scarabaeids (Kato et al., Reference Kato, Itioka, Sakai, Momose, Yamane, Hamid and Inoue2000) and honey bees (Itioka et al., Reference Itioka, Inoue, Kaliang, Kato, Nagamitsu, Momose, Sakai, Yumoto, Mohamad, Hamid and Yamane2001), which all dramatically increased in response to GFs in core areas of SE Asian rainforests. Possible differences in the relative importance of GFs in determining population fluctuations among taxa or functional groups may be due to differences in the availability of alternative food resources during non-GF periods; for example, chrysomelid flower-visitors are presumed to feed on leaves during non-GF periods (Kishimoto-Yamada & Itioka, Reference Kishimoto-Yamada and Itioka2008b).
This study illustrates that dominant chrysomelid species, which are likely to have similar food habits, show diverse population fluctuation patterns and differ in response to two types of supra-annual events, severe drought and GF. Previous studies have demonstrated that the severe drought associated with 1998 ENSO dramatically changed insect abundances in a Bornearn rainforest (Inoue et al., Reference Inoue, Nakamura, Salmah and Abbas1993; Harrison, Reference Harrison2000; Nakamura et al., Reference Nakamura, Abbas, Hasyim, Sakagami, Ohgushi and Roubik1990, Reference Nakamura, Kahono, Hasan, Abbas, Nakano, Koji, Hasyim, Astuti and Syafril2001). Our study emphasizes the possibility that supra-annual events, including severe droughts, which are pronounced in the SE Asian tropics, could substantially affect the population dynamics of various organisms and, subsequently, community dynamics in tropical rainforests in SE Asia. To better understand the dynamics of biological communities in aseasonal rainforests, such as those of SE Asian tropics, it is necessary to consider supra-annual events in examining the correlations and causal relationships between environmental factors and the population fluctuations of various organisms and in elucidating the physiological and demographical mechanisms underlying these relationships.
Acknowledgements
We are grateful to the Forest Department of Sarawak for their permission to conduct this study and assistance with the fieldwork. We are indebted to Satoshi Yamashita for his assistance on the multivariate analysis. We express sincere thanks to three reviewers for their invaluable comments on the manuscript. We also thank Kyoichiro Ueda for his help with our referring specimens and Takashi Matsumoto for his invaluable comments on earlier version of our analyses. This study was financially supported by RIHN research project 2-2, and Grand-in-Aids (no. 17405006 to Takao Itioka and no. 16405006 to Shoko Sakai) from the Japanese Ministry of Education, Science and Culture.