Introduction
There are many species groups within the spiders in which morphology-based species identification is difficult or impossible. One such group is the Pardosa groenlandica (Araneae: Lycosidae) species complex sensu Slowik and Sikes (Reference Slowik and Sikes2013), which consists of four Pardosa modica group species P. albomaculata Emerton, 1885; P. lowriei Kronestedt, Reference Kronestedt1975; P. bucklei Kronestedt, Reference Kronestedt1975; and P. groenlandica (Thorell, 1872). A more thorough treatment of the taxonomic history of these species may be found in Dondale and Redner (Reference Dondale and Redner1990), Dondale (Reference Dondale1999), Slowik (Reference Slowik2011), and Slowik and Sikes (Reference Slowik and Sikes2013).
Historically, taxonomic issues in Pardosa Koch, 1833 were remedied through morphological review (Kronestedt Reference Kronestedt1975, Reference Kronestedt1981, Reference Kronestedt1986, Reference Kronestedt1988, Reference Kronestedt1993; Lowrie and Dondale Reference Lowrie and Dondale1981; Dondale and Redner Reference Dondale and Redner1990; Dondale Reference Dondale1999), which allowed for the separation of intraspecific from interspecific morphological variation among similar species. Slowik and Sikes (Reference Slowik and Sikes2013) conducted such a review on the P. groenlandica species complex. This resulted in the synonymisation of P. dromaea (Thorell, 1877); P. prosaica Chamberlin and Ivie, 1947; and P. tristis (Thorell, 1877) under P. groenlandica because no reliable morphological characters to separate the species were found. There is very little morphological variation among members of the P. groenlandica species complex and all of the species share portions of their distributions with other members of the complex.
Molecular analyses have been used on a limited basis in Pardosa. Several population genetic studies have been conducted on species groups found in Europe and Asia (Muster and Berendonk Reference Muster and Berendonk2006; Chang et al. Reference Chang, Dong and Zhou2007; Muster et al. Reference Muster, Maddison, Uhlmann, Berendonk and Vogler2009) but these have largely ignored taxonomic issues and have focused more on gene flow and evolution of morphological variation. To date only one pardosine taxonomic work used both morphological and molecular methods (Correa-Ramirez et al. Reference Correa-Ramirez, Jimenez and Garcia-De Leon2010) in making species delimitations. However, their sample sizes were small, with only two to three specimens sequenced per species and they used only a short section of mtDNA. Because the rigor of tests of species monophyly increases with increasing sample sizes, we sought to obtain larger sample sizes for our analysis of the P. groenlandica species complex.
In this paper we attempt to apply a comprehensive molecular analysis to aid in species delineation and help interpret the phylogenetic history of the Pardosa groenlandica species complex. We test two previously proposed and recent species hypotheses: a seven-species hypothesis (Dondale Reference Dondale1999) dating before Slowik and Sikes (Reference Slowik and Sikes2013) and the four-species hypothesis of Slowik and Sikes (Reference Slowik and Sikes2013).
To test these hypotheses we used a variety of methods, including DNA barcoding, to attempt identify species complex members, and compare the use of molecular identification to morphological identifications. We performed a phylogenetic analysis with a combined dataset of mitochondrial and nuclear sequences to examine the monophyly of the species and the phylogenetic history of the species complex. We also used a large dataset with mtDNA and rDNA to conduct a population level analysis based on type localities of two of the species synonymised by Slowik and Sikes (Reference Slowik and Sikes2013). Additionally, because the distribution of the species in the Pardosa groenlandica species complex currently includes areas that would have been refugia during the end of the Pleistocene (Demboski et al. Reference Demboski, Stone and Cook1999; Federov and Stenseth Reference Federov and Stenseth2002; Aubry et al. Reference Aubry, Statham, Sacks, Perrines and Wisely2009) we also use these data to attempt to interpret a phylogeographic history of the species complex.
Methods
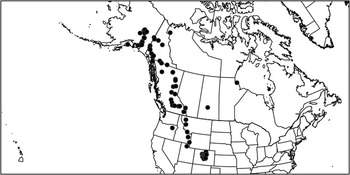
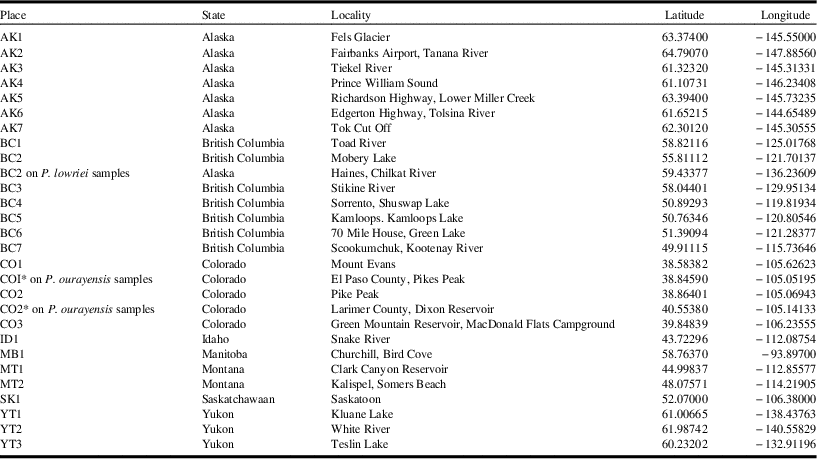
We attempted to obtain molecular data from the 182 specimens used in Slowik and Sikes (Reference Slowik and Sikes2013) for the mitochondrial gene COI and the nuclear genes ITS1, the ribosome 5.8S (hereafter referred to as just 5.8S), and ITS2. These specimens were collected from across western North America, and have been deposited in the University of Alaska Museum, Insect Collection (Fairbanks, Alaska, United States of America) (Fig. 1, http://arctos.database.museum/saved/Pardosa-Slowik). The mitochondrial gene COI was selected because of its demonstrated value in species-level separation in spiders (Barrett and Hebert 2005; Muster and Berendonk Reference Muster and Berendonk2006; Robinson et al. Reference Robinson, Blagoev, Hebert and Adamowicz2009). The nuclear ITS region genes were selected because they have been found to contain interspecific and intraspecific information in other phylogenetic analyses of spider taxa (Chang et al. Reference Chang, Dong and Zhou2007; Bond and Stockman Reference Bond and Stockman2008; Vink et al. Reference Vink, Sirvid, Malumbres-Olarte, Grifths, Paquin and Paterson2008; Muster et al. Reference Muster, Maddison, Uhlmann, Berendonk and Vogler2009).
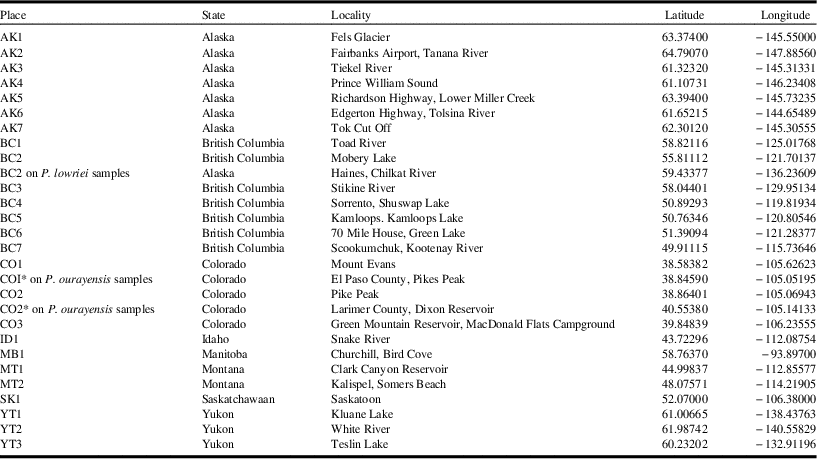
Localities of Pardosa groenlandica species complex specimens used in this study.

Extractions of specimens were made using the right third leg of the spider and done in the polymerase chain reaction (PCR)-free molecular laboratory at the University of Alaska Museum. Two outgroup species which share habitats with species group members were selected; P. ourayensis Gertsch, 1933, which is in the P. modica group (Kronested Reference Kronestedt1981) of Pardosa, and P. xerampelina (Keyserling, 1877), which is a non-P. modica group species. DNA was extracted using a Qiagen DNeasy Tissue Kit (www.qiagen.com) following the manufacturer’s instructions except for: 100% ethanol at −80 °C was used rather than at room temperature, and two 100 µL elutions using 65 °C AE buffer were performed rather than two 200 µL elutions using room-temperature AE buffer. Extractions were quantified using a Nanodrop ND-1000 spectrophotometer (Thermo scientific, Wilmington, Delaware, United States of America) and generally ranged around 10 ng/µL.
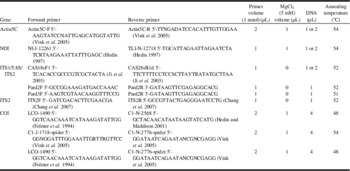
Polymerase chain reaction was conducted at the DNA Core laboratory, University of Alaska Fairbanks. Polymerase chain reaction programs, primers, and mixtures varied (Table 1). Polymerase chain reaction mixtures were 25 µL in volume for the ITS1, ITS2, 5.8S genes and 30 µL for the COI gene, of which 12.5 µL was GoTaq master mix (www.promega.com) as recommended by the manufacturer. Polymerase chain reaction was conducted using a PTC-255 thermocycler (MJ Research, Waltham, Massachusetts, Unites States of America). All PCR temperature profiles had an initial separation stage of 94 °C for four minutes; 50 cycles of 30 seconds at 94 °C, 30 seconds or 45 seconds at the designated annealing temperature (Table 1), one minute at 72 °C; and a final extension stage of 72 °C for 10 minutes. Verification of PCR products was made using a 20 mL, 2% argrose gel infused with 2 µL of ethidium bromide. Bands were visually evaluated for DNA concentration and were in the area of 10–20 ng/µL. Polymerase chain reaction cleanup and sequencing were done at the High-Throughput Genomics Unit at the University of Washington (Seattle, Washington, United States of America) (www.htseq.org).
Primers, polymerase chain reaction (PCR) mixtures, and annealing temperatures used for the Pardosa groenlandica species complex gene amplifications.

Contiguous sequences were assembled from bidirectional primer reads. A consensus sequence was assembled from the forward and reverse complement sequences and aligned by eye. 4peaks v 1.7.2 (http://mekentosj.com) was used to survey the chromatograms, and Mesquite v 2.72 (Maddison and Maddison Reference Maddison and Maddison2009) was used to create contiguous sequences and check for ambiguities. Sequences were aligned for each gene using Clustal X v 2.0.12 (Thompson et al. Reference Thompson, Gibson, Plewniak, Jeanmougin and Higgins1997) and then visually checked for odd gaps and alignment errors against chromatograms. The mitochondrial DNA alignment was verified by translation to amino acid sequences that were compared with amino acid sequences AAX40574.1 and ABF59654.1 obtained from GenBank (www.ncbi.nlm.nih.gov/Genbank/index.html). ITS data were anchored at the conserved 5.8S ribosome region and aligned moving away from this region. Sequences were deposited in GenBank (COI: JF791467.1–JF791610.1; ITS: JF791323.1–JF791466.1).
DNA barcoding
To attempt species identification using DNA barcoding, the 5-prime half of the COI data that matches the standard DNA barcode section was analysed (Barrett and Hebert Reference Barrett and Hebert2005; Robinson et al. Reference Robinson, Blagoev, Hebert and Adamowicz2009). Sequences were obtained from the barcode of life database (BOLD) and used to locate the correct section of COI to be used for comparison. A neighbour-joining tree was made with K2P distances using PAUP*v4.0b10 (Swofford Reference Swofford2002) in accordance with typical DNA barcoding protocols. Each COI sequence of our dataset was used as an unknown to query BOLD (www.boldsystems.org) on 6 December 2010.
Population genetic analysis
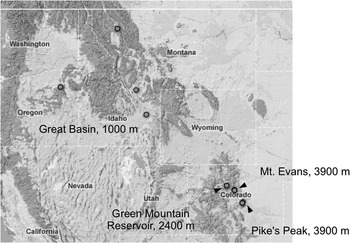
We used specimens from four populations in and around Colorado, United States of America (Fig. 2). These populations were: the neotype location for P. tristis, Mount Evans (n=12), 3900 m (CO-1), the type location for P. iracunda (=P. groenlandica), Pike’s Peak (n=7), 3900 m (CO-2), Green Mountain Reservoir (n=9), 2400 m, (a population of P. tristis similar in elevation to Idaho Springs, the original type location, CO-3), and a collection of P. tristis collected at lower elevations (~1000 m) outside of Colorado from the Great Basin and Central Rockies (n=10) similar to the habitat particular to P. dromaea (Dondale and Redner Reference Dondale and Redner1990; Dondale Reference Dondale1999).
Population locations for subset of Colorado specimens of Pardosa groenlandica and Pardosa tristis.

Specimens were assessed morphologically, measured for carapace length, carapace width and, if female, the p/q ratio of the epigyna, in which p is the length from the anterior end of the median septum (MS) to the atrial sclerite, and q is the total length of the MS (Dondale Reference Dondale1999). To determine size differences among populations, a corrected carapace size was calculated by multiplying carapace length by width then multiplying by 0.75 as a correction factor for the shape of the carapace in the rectangular area. The p/q ratio and carapace size were compared among populations and among high and low elevations using an analysis of variance (ANOVA).
Three different groupings of population assemblages were analysed using an analysis of molecular variance (AMOVA) run in Arlequin v 3.1 (Excoffier et al. Reference Excoffier, Laval and Schneider2005) for the mtDNA and the rDNA. These were: each population is independent (four groups), high elevations versus low elevations (two groups), and groups of individuals sharing similar MS shapes as described in Slowik and Sikes (Reference Slowik and Sikes2013) (four groups). Because of the high number of parsimony-informative sites in both gene regions, the Tamura-Nei (TrN) (Tamura and Nei Reference Tamura and Nei1993) distance metric was used for all distance analyses as that is the most complex distance metric available in Arlequin and was the model selected by Modeltest for the phylogenetic analysis.
Phylogenetic and phylogeographic analyses
Individual genes were evaluated using Modeltest 3.7 (Posada and Crandall Reference Posada and Crandall1998) implemented in PAUP*v 4.0b10 (Swofford Reference Swofford2002) to determine which available phylogenetic model best fit each gene. For the COI data an independent TrN+I+G model was selected for each codon position. For the ITS1 data the HKY+I+G model (Hasegawa et al. Reference Hasegawa, Kishino and Yano1985) was selected; K80 (Kimura Reference Kimura1980) was selected for the 5.8S data, and F81 (Felsenstein Reference Felsenstein1981) was selected for the ITS2 data. Bayesian phylogenetic analyses were conducted using MrBayes 3.1.2 (Ronquist and Huelsenbeck Reference Ronquist and Huelsenbeck2003). Because MrBayes cannot implement the TrN model, the GTR model was used instead as it includes the same parameters as the TrN model. We used each of the four genes as an individual dataset in addition to running a combined dataset in a partitioned analysis to infer a species tree from the respective gene trees (Nylander et al. Reference Nylander, Ronquist, Huelsenbeck and Nieves-Aldrey2004). To accommodate for branch length estimation errors made by MrBayes’ algorithm when dealing with partitioned datasets, we changed the branch length prior from the default value of brlenspr=unconstrained:exponential(10) to brlenspr=unconstrained:exponential(100) as recommended by Marshall (Reference Marshall2010) and Brown et al. (Reference Brown, Hedtke, Lemmon and Lemmon2010). This modification brought the branch length estimates close to those of an unpartitioned concatenated analysis using the GTR+I+G model with GARLI v 0.96 (Zwickl Reference Zwickl2006).
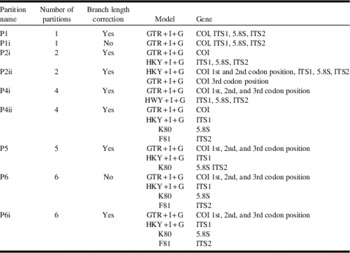
Several different partitioned analyses were conducted in an attempt to find the best overall partitioning scheme (Table 2). How one selects the best partitioning scheme for their data remains an area of current research (Li et al. Reference Li, Lu and Orti2008; Klopfstein et al. Reference Klopfstein, Kropf and Quicke2010; Ward et al. Reference Ward, Brady, Fisher and Schultz2010). For this study, Bayes factors were used to determine which partitioning scheme was the most informative (Kass and Raferty Reference Kass and Raferty1995; Nylander et al. Reference Nylander, Ronquist, Huelsenbeck and Nieves-Aldrey2004; Ward et al. Reference Ward, Brady, Fisher and Schultz2010).
Partition schemes for different MrBayes analyses run on the Pardosa groenlandica species complex genetic datasets.

Note: Branch length correction follow recommendations of Marshall (Reference Marshall2010) and Brown et al. (Reference Brown, Hedtke, Lemmon and Lemmon2010), further explained in text.
Bayesian MCMCMC chains were initially run for 2 000 000 generations, keeping every 1000th tree. The default setting of two simultaneous runs with four chains for each run was used. If stationarity was not achieved during this period, the number of generations was increased to 4 000 000, and if stationarity was still not reached a final analysis of 10 000 000 generations was run. Stationarity was determined using three factors: (1) Split frequencies were at or below 0.01 (Ronquist and Huesenbeck Reference Ronquist and Huelsenbeck2003), (2) visual inspection of trace files confirmed a plateau was reached for at least 50% of the generations (Ronquist and Huesenbeck Reference Ronquist and Huelsenbeck2003), and (3) effective sample size (ESS) values for all model parameters were over 100. The effective sample size is the number of effectively independent samples taken from the MCMC chains and is usually much smaller than the number of samples due to autocorrelation (non-independence) among samples (Drummond et al. Reference Drummond, Ho, Phillips and Rambaut2006). Files were inspected using Tracer v 1.4 (Rambuat and Drummond Reference Rambaut and Drummond2007).
The initial 50% of the trees of each run were removed as a burn-in period to ensure that only data post-stationarity were included in tree reconstruction. A 0.90 posterior probability consensus tree was assembled using Sumtrees 2.0.2 (Sukumaran and Holder Reference Sukumaran and Holder2010). All phylogenetic analyses were run using the Life Science Informatics Cluster at the University of Alaska, Fairbanks (https://biotech.inbre.alaska.edu). An additional analysis of 100 bootstrap replicates using a GTR+I+G model with 2 000 000 generations per replicate was conduced with Garli v 0.96 to provide a maximum likelihood comparison. Genetic diversity for each gene was calculated from uncorrected p-value distances calculated using Arlequin v 3.1 (Excoffier et al. Reference Excoffier, Laval and Schneider2005). Genetic diversity for the combined mtDNA and rDNA dataset was calculated using uncorrected p-value distances using PAUP* v4.0b10 (Swofford Reference Swofford2002).
Results
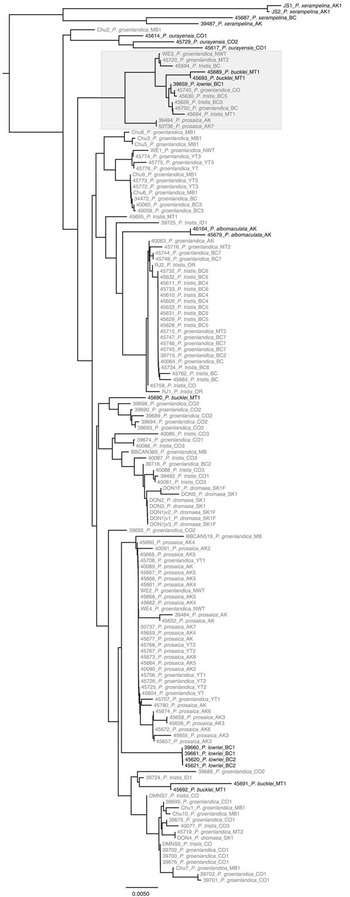
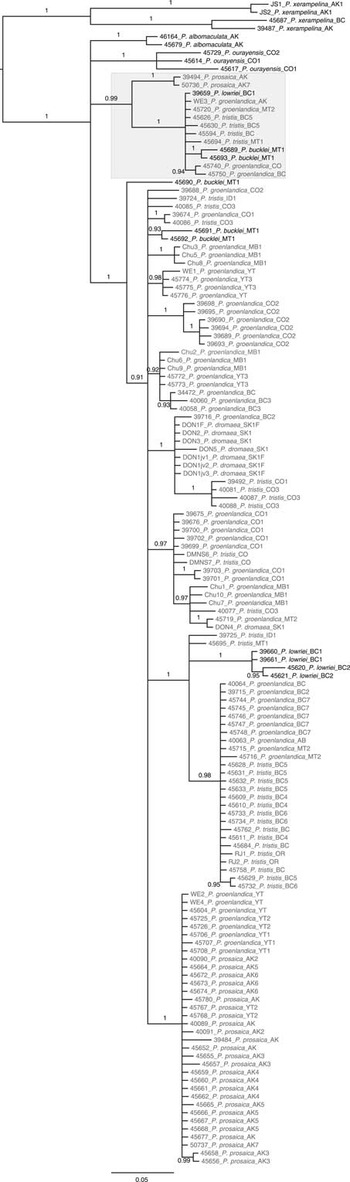
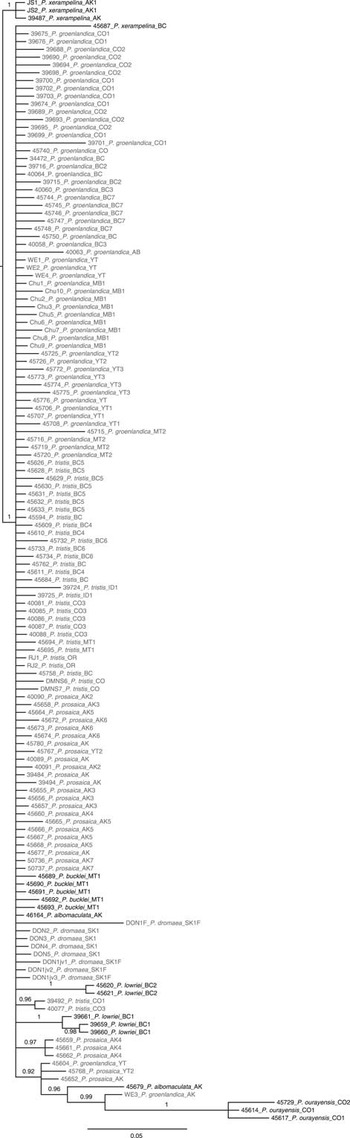
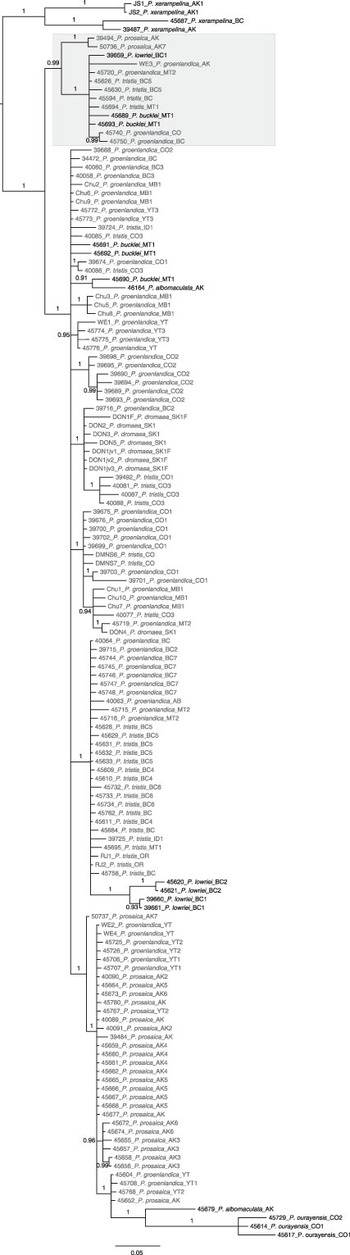
Sequences were generated for the COI, ITS1, 5.8S, and ITS2 genes for 144 specimens. For the purpose of comparing the two hypotheses (seven versus four species), all trees (Figs. 3–6) show specimens as identified using the descriptions in Dondale (Reference Dondale1999) and Dondale and Redner (Reference Dondale and Redner1990), which represents the seven-species hypothesis; specimens that would be synonymised under P. groenlandica, as in the four-species hypothesis (Slowik and Sikes Reference Slowik and Sikes2013), are highlighted as grey text. Each specimen is preceded by a collection identification number and followed with the general geographic position and its applicable population designation (Table 3) using United States of America and Canadian state and province postal codes. The grey shaded clade highlights 13 specimens, representing five species, which occur in various analyses as a basal group discussed later.
Neighbour-joining analysis of the Pardosa groenlandica species complex using Kimura 2-parameter (K2P) distances of the barcode region of the COI gene. Grey box highlights a basal group, further explained in text. Grey specimens represent those that were synonymised under P. groenlandica based on the morphological results of Slowik and Sikes (Reference Slowik and Sikes2013).

Bayesian 90% majority rule consensus phylogram for species of the Pardosa groenlandica species complex and outgroup based on 1120 base pairs of the mitochondrial COI gene using a three partitioned GTR+I+G model for each codon position. Values above branches are posterior probabilities.

Bayesian 90% majority rule consensus phylogram for species of the Pardosa groenlandica species complex and outgroup based on 456 base pairs of the nuclear internal transcribed spacer (ITS) region 1 using the HKY+I+G model.

Bayesian 90% majority rule consensus phylogram for species of the Pardosa groenlandica species complex and outgroup species using a six partition model (P6i) based on the COI (GTR+I+G for each codon position), ITS1 (HKY+I+G), 5.8S (K80), and ITS2 (F81) genes.

Locality codes for populations used in phylogenetic analysis.
DNA Barcoding
Our COI data had 428–590 bases of overlap with the standard 658 bases used for DNA barcoding. The neighbour-joining tree failed to show species-level monophyly for any members of the species complex expect for P. albomaculata, which may be an artifact of our small (n=2) sample size (Fig. 3). Both P. albomaculata and four of the specimens of P. lowriei showed long branches. These results also lacked a clear haplotype cluster for one of the outgroup species P. ourayensis, but there was a haplotype cluster for the outgroup species P. xerampelina. Two of the four specimens of P. xerampelina were separated by long branches.
Using the BOLD identification engine resulted in the correct identification of P. xerampelina, and misidentified P. ourayensis as P. modica (Blackwall, 1846). All other specimens were identified as P. groenlandica.
Population genetics
Examination of specimens for each population found three populations with unique MS shapes. Inverted “T”-shaped median septa (Slowik and Sikes Reference Slowik and Sikes2013) were found only at Mount Evans (n=2), bottle-shaped median septa were only found at Pike’s Peak (n=2), and a third MS shape, one in which the MS does not expand posteriorly and is somewhat “I”-shaped, was found only at Somers Beach, Montana, United States of America (n=2). Five specimens from several populations had “A”-shaped median septa. All other specimens had varying MS shapes as expected (Slowik and Sikes Reference Slowik and Sikes2013).
Analysis of variance of the carapace size of the specimens revealed a significant difference among the four populations (P=0.0053, F=4.917, df=3), with the high-elevation populations being smaller (P=0.0001, t=4.23). Measurements of the epigyna p/q ratio among populations yielded no significant differences (P=0.61, F=0.6180, df=3).
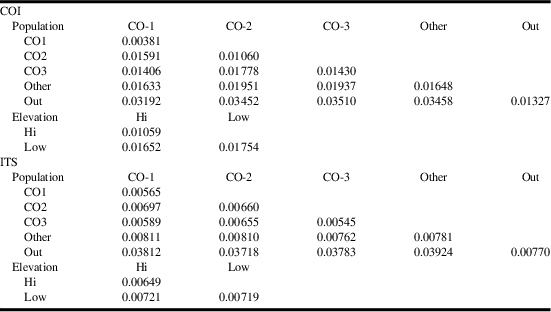
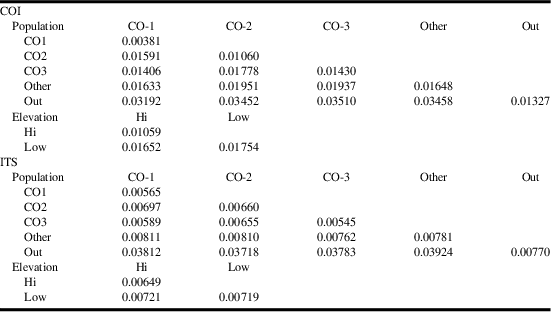
Average corrected COI distances between the outgroup, P. ourayensis, and the ingroup was 3.4%. The average among-population distance was 1.2%. The Mount Evans (CO-1) population showed the smallest amount of variation at the population level, 0.3%. The Pike’s Peak (CO-2), Green Mountain Reservoir (CO-3), and Great Basin populations were in a similar range, 1%, 1.4%, 1.6%, respectively. Average rDNA distances between the outgroup species and ingroup populations was 3.8%. Average within-population variation and variation between populations was 0.6% (Table 4).
Distance matrix of Pardosa groenlandica and Pardosa tristis specimens from Colorado and the Great Basin/Central Rockies area using Tamura-Nei distances.
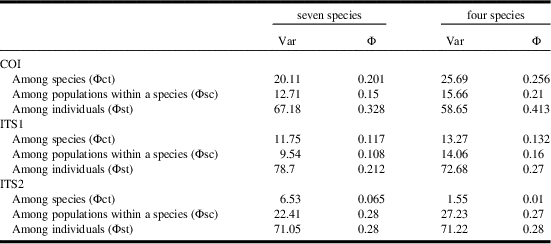
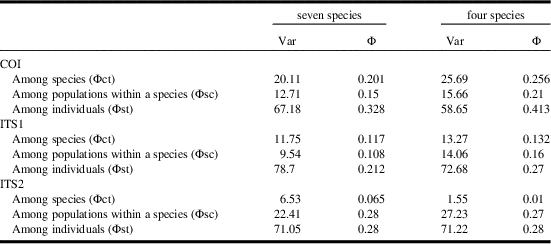
AMOVA results of different group schemes for both mtDNA and rDNA showed high amounts of variation at the individual level. The COI data showed an increase in variation at the population level when each population was treated independently. However, that structuring was not carried over in the rDNA (Table 5). Φst values were relatively higher when specimens were organised by populations rather than epigynal characters. Morphological differences among specimens and populations did not correspond to genetic differences.
Results of AMOVA analysis of Pardosa groenlandica and Pardosa tristis specimens from Colorado and the Great Basin/Central Rockies area comparing several different population structure schemes for the ITS1, 5.8S, and ITS2 (combined) and COI genes.
Phylogenetic analyses and phylogeography
Nucleotide variation of the COI gene, using uncorrected p-distances, ranged from 0.31% in P. albomaculata to 3.52% in P. xerampelina, and was within previously published ranges found in other spider species (0–3.6% Barrett and Hebert 2005; 1.3–5.7% Crews et al. Reference Crews, Putnte-Rolon, Rutstein and Gillespie2009). Variation in the ITS1 and ITS2 genes (0.02–1.1%) were also similar to previously published intraspecific values (0.6% Chang et al. Reference Chang, Dong and Zhou2007; 2% Muster et al. Reference Muster, Maddison, Uhlmann, Berendonk and Vogler2009).
Analysis of COI data showed that the outgroup, P. xerampelina, separated from the rest of the samples with good support (Fig. 4). However, support within the ingroup was mixed. There was strong support for the P. ourayensis and P. albomaculata clades, but their relationships within the P. modica group were not clear because of a basal cluster consisting of 13 specimens, representing five species, covering the entire sampled geographic range (Fig. 4, grey highlight, Slowik Reference Slowik2011). Multiple extractions and PCR amplifications were conducted on all clade specimens to verify this basal cluster (Slowik Reference Slowik2011). The COI data also supported a P. lowriei clade; however, the species was not monophyletic, with one member falling out in the basal cluster. Some groups were congruent with geography, as should be expected from mtDNA sequence data (Avise Reference Avise2004). This was most obvious in clades of P. prosaica and P. groenlandica from Alaska, United States of America and Yukon, Canada and P. tristis from British Columbia, Canada. However, there were several results that contradicted this pattern. Pardosa groenlandica from Manitoba, Canada did not form a clade even though all its specimens were collected from a single population 1300 km from the next closest sample. Pardosa bucklei was polyphyletic despite all specimens having been collected from a single population. These COI results provide no clear inference for a phylogeographic history.
Phylogenetic analyses of the ITS2 and 5.8S RNA genes resulted in polytomies (not shown), which was to be expected based on the lack of informative sites (one parsimony-informative site) available for inference. ITS1 results (Fig. 5) supported the exclusion of both outgroup species from the species complex, although not as sister clades. Pardosa xerampelina was almost monophyletic in the ITS1 results, except for one specimen, UAM100045687. All P. xerampelina specimens were found to have a TA base insertion 111 bases in the 5' direction of the 5.8S subunit. The ITS1 results also showed strong support for a terminal P. ourayensis group. Pardosa ourayensis specimens also showed an extra A at base 400 and an extra G at base 396 in the 5' direction from the 5.8S subunit, which were not found in any other specimens. Each population of P. lowriei was monophyletic, but the species is polyphyletic. The rDNA data did not cluster specimens of P. albomaculata, which was monoplyetic in the COI data. Because no P. groenlandica species complex members were found to be monophyletic, the rDNA data failed to clearly support either the four-species or seven-species hypotheses.
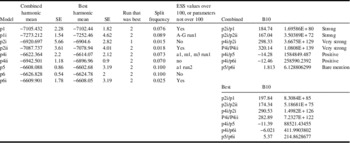
For the combined analysis, determining run completion and an optimal partitioning scheme was somewhat difficult. Of the three qualifications for run stationarity (split frequencies below 0.01, graphical plateau, ESS values over 100) even after 10 million generations no partition scheme achieved split frequencies below 0.01 as recommended in the MrBayes manual (Table 6). All models were visually observed to have reached a plateau but the variation within the plateau varied. Additionally, not all parameter values for each model achieved ESS values over 100.
Harmonic means, Bayes factors, split frequencies, and effective sample sizes (ESS) for different partition schemes used on the combined dataset consisting of the COI, ITS1, 5.8S, and ITS2 genes.

Because of the variation in some of the log-likelihoods between runs, Bayes factors were calculated twice, using the combined runs’ harmonic means, and also the best harmonic mean of the two runs. Bayes Factor results imply little improvement beyond five partitions. The six-parameter model without the branch-length correction (Table 6, p6) never stabilised (ESS of log-likelihood values not over 100), however, with the correction (p6i) it did. Using the three criteria for stationarity, combined with the Bayes factor results, the p6i model was selected to be the best representation for the genes used (Table 6; Fig. 6). Even though the p6i model did not have the best log-likelihood, it did have the best Bayes factor score, one of the lowest split frequencies and all ESS parameter values were over 100.
The p6i tree (Fig. 6) has the basal clade found in the barcode and COI results (Figs. 3–4). The partitioned results show that many of the geographic clusters found in the mtDNA analyses are also supported with the inclusion of nuclear data. The partitioned results collapsed many short, although well supported, branches found in the mtDNA results. There are also several significant branch rearrangements between the analyses as well. Specifically, P. ourayensis, the P. modica group outgroup species, is now located terminally within the ingroup. Also, P. albomaculata is no longer monophyletic. The partitioned results failed to find any of the species complex members monophyletic, thus not supporting either the four-species or seven-species hypothesis.
The likelihood bootstrap analysis showed less resolution than any of the partitioned Bayesian analyses (not shown). This analysis supported both a P. ourayensis and a P. lowriei clade, minus the P. lowriei specimen UAM100039659 found in the basal clade of the COI analysis. However, neither the basal clade nor the geographic clusters seen in the mtDNA and p6i scheme were represented, rather they were collapsed into the larger polytomy (Figs. 4, 6).
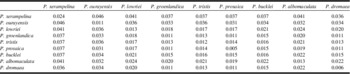
Total uncorrected p-distances for the combined data showed that members of the P. groenlandica species complex are more closely related to each other than to either of the two outgroup species, P. xerampelina and P. ourayensis (Table 7). Within-species variation was not lower than between-species variation for P. bucklei, which was also apparent in the species being polyphyletic (Table 7; Figs. 4–6).
Total genetic variation of the Pardosa groenlandica species complex and outgroup species using uncorrected P-values.

Discussion
These results show that despite the use of a large sample size, several genes, and multiple analyses, the species composition of the P. groenlandica species complex remains ambiguous. Slowik and Sikes (Reference Slowik and Sikes2013) demonstrated that four of the members could reliably be morphologically identified, but they were unable to address the possibility of young or cryptic species, which may be driving some of the geographical morphs mentioned. Our results did not show strong molecular support for any of the species included in the Pardosa groenlandica species complex sensu Slowik and Sikes (Reference Slowik and Sikes2013). Many of the species were found to have discordant tree positions between the mtDNA and rDNA results. For example, one specimen of Pardosa lowriei was found in the COI basal clade while the other specimens formed a strongly supported clade elsewhere in the tree (Figs. 4, 6). However, the rDNA data split this species between two different geographic clades (Fig. 5). Pardosa bucklei, which was also found to be morphologically identifiable by Slowik and Sikes (Reference Slowik and Sikes2013), was found to be polyphyletic in all of the analyses. Pardosa albomaculata, which was also morphologically identifiable, formed a single clade in the mtDNA results (Figs. 3–4) and split in the rDNA and partitioned results (Figs. 5–6), although with only two specimens for this species our test of its monophyly was not rigorous. Even members of the outgroups were not stable, with P. ourayensis being basal in the mtDNA analyses and terminal in the rDNA and partitioned analysis. Even P. xerampelina was polyphyletic in the rDNA. With these often conflicting results between the mtDNA and rDNA and the lack of species monophyly it is difficult to make a definitive statement pertaining to species boundaries.
The Chang et al. (Reference Chang, Dong and Zhou2007) study with Pardosa astrigera Koch, 1878 found similar discordance between the mtDNA and the rDNA data. Using data with comparable amounts of variation in mitochondrial and nuclear DNA to this study (0.1–1.8% for COI, and 0.7% for ITS2), their results found an embolus polymorphism correlated with the rDNA, but the mtDNA failed to find the polymorphism monophyletic. Within the P. groenlandica species complex there is a similar embolus polymorphism, in the synonymised species P. prosaica (Slowik and Sikes Reference Slowik and Sikes2013). Most of these specimens are localised on a clade of Alaska and Yukon specimens (Fig. 6). However, the polymorphism is not monophyletic, with two specimens found in the COI basal cluster. Additionally, not all members of the Alaska/Yukon clade exhibit the polymorphism. The branch-length of the Alaska/Yukon branch is short, indicating intraspecific variation rather than a distinct species, which is the same conclusion made by Chang et al. (Reference Chang, Dong and Zhou2007) for P. astrigera.
Our results from the AMOVA analysis show there is strong support that all of the populations examined constitute a single species with gene flow among populations, supporting the synonymy of Slowik and Sikes (Reference Slowik and Sikes2013). But this concerns only the four populations examined. We found that phenotypic characters like carapace size and MS shape, which were measurably different between populations, were not supported molecularly. This raises questions about the amount of morphologic change needed to constitute a different species, and reinforces our conclusions about the Alaska/Yukon embolus polymorphism being intraspecific variation.
Data from our population genetics analysis also failed to support geographic differentiation among the populations sampled. These results contrast with the similar population genetics studies of Muster and Berekdonk (Reference Muster and Berendonk2006) and Muster et al. (Reference Muster, Maddison, Uhlmann, Berendonk and Vogler2009), which did show geographic structure. Their mtDNA results found strong support for geographic structure among populations, with two southern clades and one northern clade. Phylogenetically their rDNA results were discordant with the geographic structure in their mtDNA results, but AMOVA and coalescent simulation analyses found relationships. Our population analysis data represented specimens spread over a similar range, about 1100 km between the two most distant populations, and we used a larger segment of mtDNA but found no support for any geographic structure among the populations studied, indicating gene flow among populations typical of a single species.
Before our analyses only one phylogenetic study addressed species limits in the genus Pardosa. The study of Pardosa sierra Banks, 1898 (Correa-Ramirez et al. Reference Correa-Ramirez, Jimenez and Garcia-De Leon2010) used morphology with genetic-distance comparisons to delimit species. They found morphologic species were supported using DNA barcode identification. However, their analyses did not rigorously test the monophyly of each species due to limited sample sizes (only two or three specimens per species), and limited genetic information (only 630 bases of the barcode region of the mtDNA COI gene). Comparing the two studies sheds particular light on the problem of false monophyly due to small sample sizes. The only species we found to be monophyletic in any of the analyses was P. albomaculata, which had the smallest sample size (two specimens, Figs. 3–4). If we had restricted our sampling to the strategy used by Correa-Ramirez et al. (Reference Correa-Ramirez, Jimenez and Garcia-De Leon2010), in all likelihood, we would have falsely concluded that most, or possibly all, of the species were monophyletic. This should be considered justification for showing caution in interpretation of results from studies using small sample sizes and limited molecular data.
Additional limitations of the molecular inference capacity of DNA barcode data can be found in specimens of P. groenlandica from eastern North America in which samples were found to have a high amount of within-species variation (3.8%) and was thought to possibly represent a species complex (Robinson et al. Reference Robinson, Blagoev, Hebert and Adamowicz2009). Our DNA barcode analysis failed to identify species complex specimens with clear morphological differences (Fig. 3; Dondale and Redner Reference Dondale and Redner1990; Slowik and Sikes Reference Slowik and Sikes2013).
Typically it is safe to assume that using the largest amount of data would provide the best results, thus our partitioned analyses using both the mtDNA and rDNA should provide the strongest inference for species delimitation. We feel that our selection of the best partition model, and the tree derived from it, was rigourous and well supported, but it should be mentioned that well-supported topologies, 0.90 posterior probabilities, of the five-partition (p5), and six-partition (p6i) schemes were not identical (p5 had the highest likelihood score, tree not shown, Table 6). Both runs of the six-partition scheme had similar topologies; however, the one run of the five-partition scheme was similar to the four-partition topology while the other was similar to the six-partition topology. It would appear that the biggest discrepancy in partition analysis topology was in how the partition scheme treated the ITS1 data and the COI basal cluster. The ITS1 data (Fig. 5) strongly supported the placement of P. ourayensis as sister to P. groenlandica WE3, which moved the clade to a terminal position off the Alaska/Yukon clade in the six-partition analysis (Fig. 6). The COI data supported the basal clade and also the separation of the P. albomaculata clade (Fig. 4).
There are many reasons that a gene tree may not match the species tree. The short list includes different genes showing different phylogenetic histories (Maddison Reference Maddison1997), mtDNA fixation due to Wolbachia (Whitworth et al. Reference Whitworth, Dawson, Magalon and Baudry2007), hybridisation (Lopez et al. Reference Lopez, Contreras-Dıaz, Oromı and Juan2007; Schmidt and Sperling Reference Schmidt and Sperling2008), incomplete lineage sorting, selective sweeps (or mtDNA capture), and incorrect taxonomy (Hendrixson and Bond Reference Hendrixson and Bond2005). False monophyly can also be inferred due to a species’ vagility, geography of the samples, or too-small sample sizes (Rosenberg Reference Rosenberg2007). But we feel that our approach of using several different genes, large sample sizes, and various analyses to confirm the results, minimises the possibility for error and the influence of some of the factors listed above.
The possibility that the genes we used were simply uninformative is refuted by comparison to other Pardosa studies (Muster and Berendonk Reference Muster and Berendonk2006; Chang et al. Reference Chang, Dong and Zhou2007; Muster et al. Reference Muster, Maddison, Uhlmann, Berendonk and Vogler2009), and studies on other spider families (Robinson et al. Reference Robinson, Blagoev, Hebert and Adamowicz2009; Agnarsson Reference Agnarsson2010), which show the utility of the genes used in this study for the identification of species or populations. Other studies within the Lycosidae using several loci (Vink and Patterson Reference Vink and Patterson2003; Hosseini et al. Reference Hosseini, Keller, Schmidt and Framenau2007) have found monophyletic species lineages, although these studies worked with genera less speciose than Pardosa. In an attempt to increase the amount of genetic data, attempts were made to sequence the mtDNA gene NDI and the nDNA gene Actin5C but both failed to sequence reliably and were not used for analyses (Slowik Reference Slowik2011).
The discordance in the molecular results may lead one to conclude that all these samples are conspecific. However, our results do not necessarily show the species complex behaving as if they were a single species and the morphological differences mentioned in Slowik and Sikes (Reference Slowik and Sikes2013) are certainly within the amount currently accepted for species delineation in other members of Pardosa and lycosid spiders (Dondale and Redner Reference Dondale and Redner1990; Dondale Reference Dondale1999; Correa-Ramirez et al. Reference Correa-Ramirez, Jimenez and Garcia-De Leon2010; Slowik and Sikes Reference Slowik and Sikes2013).
These results are somewhat peculiar as a majority of molecular studies tend to find some concordance with geography and/or existing species (Pons et al. Reference Pons, Barraclough, Gomez-Zurita, Cardoso, Duran and Hazell2006; Yang and Rannala Reference Yang and Rannala2010), and rather than supporting fewer species than currently recognised, some molecular studies even find support for more species than currently recognised (e.g., cryptic species) (Paquin and Hedin Reference Paquin and Hedin2004; Lopez et al. Reference Lopez, Contreras-Dıaz, Oromı and Juan2007). However, there are a growing number of studies that find the molecular phylogeny discordant with the current, usually morphology-based, taxonomy (e.g., Cognato Reference Cognato2006; Schmidt and Sperling Reference Schmidt and Sperling2008). This may be a new norm, as the number of molecular studies continues to grow, so do the number of studies finding discordance in which species are found to be polyphyletic or paraphyletic. Funk and Omland (Reference Funk and Omland2003) found that 23% of 2319 species included in their review showed some level of polyphyly or paraphyly in gene trees using mtDNA.
One possible explanation for the molecular discordance seen is that speciation occurred very recently. The structure of the phylogeny suggests that the clades are of recent origin as all branch lengths are relatively short. A Pleistocene speciation episode that would put the time frame of speciation somewhere between 10 000 and 50 000 years ago (Brunsfield et al. Reference Brunsfield, Sullivan, Soltis and Soltis2001) is plausible. If the members of the P. groenlandica species complex are this young, one would not expect them to show large amounts of genetic divergence. Although the mtDNA had similar genetic distances to studies that did find clear species boundaries (e.g., Bond and Stockman Reference Bond and Stockman2008; Crews et al. Reference Crews, Putnte-Rolon, Rutstein and Gillespie2009) there could still be some incomplete lineage sorting among species clouding the species picture. This discordance is not unheard of, as traditional phylogenetic analyses have failed to correctly identify species of recent divergence (Knowles and Yang Reference Knowles and Yang2008, Henry et al. Reference Henry, Brooks, Duelli, Johnson, Wells and Mochizuki2012).
If it is assumed that the speciation episode(s) of the species complex occurred during one or over several of the recent glacial cycles, it is likely that an ancestral population(s) would have existed in one or several of the available refugia. This is supported in the geographic clusters found in the partitioned results (Fig. 6). It would appear that the geographic clusters likely agree with the lifestyle of the spiders themselves. Young lycosid spiders are known to have the ability to balloon great distances (Greenstone et al. Reference Greenstone, Morgan and Hultsch1987; Crawford et al. Reference Crawford, Sugg and Edwards1995), but if the winds are unfavourable during the period of the spiders’ life in which they are capable of ballooning, then the spiders likely become limited to the habitat preference of the species. These species have a generally preferred rock crevasse size (J.S., personal observation), which is similar regardless whether the collection habitat is next to a stream in a deep lowland valley or in an alpine skree area.
This type of geographic and glacial isolation could have allowed for the formation of the polymorphic embolus found in P. groenlandica specimens from Alaska (formerly P. prosaica, Slowik and Sikes Reference Slowik and Sikes2013). And also allow for the origination of P. lowriei from a coastal British Columbian population. Both the Alaska/Yukon and British Columbian clades show large geographic coverage with limited genetic variation, implying that both are recent range expansions, but it is unclear where these populations may have taken refuge. There are conflicting opinions as to the extent of the Pacific Northwest’s refugia. One hypothesis is for a coastal as well as a continental refugium (Byun et al. Reference Byun, Koop and Reimchen1997), whereas other evidence seems to contradict this, supporting a single refugium (Demboski et al. Reference Demboski, Stone and Cook1999). If there was a coastal refugium, this may have acted as the vicariance episode allowing for the speciation of P. lowriei.
Although this study did include a large number of samples (n=144) over a wide geographic range, there are areas in which samples were not collected that may provide information. The most glaring omission is any P. groenlandica from Greenland, which might have provided evidence of whether P. groenlandica extends across North America as currently assumed or is limited to Greenland. The fact that the type locations of P. tristis and P. dromaea no longer retain populations of either species and the type specimens are lost is troublesome. There is no way to verify identifications besides published descriptions (Dondale Reference Dondale1999) and comparison to museum specimens and types identified as such. Additionally, the small sample sizes and limited sampling of P. albomaculata, P. lowriei, and P. bucklei also limit our ability to make any specific interpretations.
We feel that it is important to remember when dealing with confusing results like these that species and speciation is a fluid process. There is no reason to expect, when multiple species are involved and the history of those species is unknown, that there would be a uniform amount of molecular divergence within or among species, or even monophyly of species. We were unable to answer our original taxonomic question of whether the species complex consists of four or seven species, but these results raised many more questions about the species of the complex and its phylogeographic history. More importantly, these results question how arachnid taxonomists have been defining species of the genus Pardosa. Traditionally, taxonomy of the genus is based on slight morphological differences in the genitalia. This study shows how species with significant morphological differences in the genitalia may not correlate with significant molecular lineages.
Conclusion
Unfortunately, these results fail to clarify the taxonomy of the Pardosa groenlandica species complex. Our analyses found only one monophyletic species and in only some of the analyses. Morphologically, there is support for four species (Slowik and Sikes Reference Slowik and Sikes2013) with open questions about how much variation there is in a species and where that variation is geographically located. Phylogenetically the results are mixed, several distinct geographic clades that lack any distinct phenotypes were found, but morphological species were not found to be monophyletic. These contrasting results blur any molecular boundary that might aid in uniform species delineation. Therefore, it is recommended that the morphological review and synonymy of P. tristis, P. dromaea, and P. prosaica under P. groenlandica by Slowik and Sikes (Reference Slowik and Sikes2013) be accepted (the four-species hypothesis) because currently, the only reliable way to identify species of the species complex is though morphological characters.
Acknowledgements
The authors thank the University of Alaska Museum, Fairbanks, and the Denver Museum of Nature and Science, for specimens. They also thank to Paula Cushing and Kevin Winker for assistance with this project; Charlie Dondale for both assistance and specimens and Bea Vogel for discussions on this group of spiders; Buzz Morrison, Don Buckle, Gergin Blagoev, and R.J. Adams for specimens; Cor Vink, Elizabeth Allman, and John Rhodes for molecular and mathematical advice. Additional funds for collection travel came from a Society of Systematic Biologists Graduate Student Award, The American Arachnological Society Student Travel Award, and the Institute of Arctic Biology Dean’s Award awarded to J. Slowik.