


Introduction
A critical, yet incompletely understood, element of the high-latitude terrestrial regime is the presence of permafrost overlain by a thin (<100cm) seasonally freezing and thawing active layer. The depth of the active layer can vary dramatically from place-to-place, particularly in areas with substantial topographic variability; such variability gives rise to differences in incident solar radiation, snow depth (via wind-driven snow distribution), surface- and subsurface-water drainage and vegetation cover. The active-layer depth is a primary factor in determining the vegetative and hydrologic characteristics of these land areas, as well as the exchanges of trace gases (e.g. CO2, CH4). By influencing trace gas exchange as well as modulating soil moisture and vegetation type (and consequently turbulent fluxes), processes in the active layer are potentially important in the evolution of large-scale grcenhouse-gas-induced climatic change.
The Canadian Land Surface Scheme (CLASS)
The main features of the Canadian Land Surface Scheme version 2.5 (CLASS) have been described by Reference VerseghyVerseghy (1991) and Reference Verseghy, McFarlane and LazarenVerseghy and others (1993). Here we note only features of interest to this study. CLASS contains three soil layers, a snow layer and a vegetation canopy. Up to four different land-surface types comprise a composite area that conceptually is analogous to a GCM gridcell. Soil color, texture and drainage can be specified from field data or the atlas of Reference Wilson and Henderson-SeϭllersWilson and Henderson-Sellers (1985).
Soil-layer temperature and moisture are computed via one-dimensional (1-D) conservation equations assuming zero heat flux at the model bottom. Freezing and thawing of soil are treated via a correction term in the conservation equations. If soil temperature exceeds freezing (0°C) while soil ice is present, or if soil temperature drops below 0°C while liquid water is present, the resulting energy (source or sink) is used first for phase changes of the water, then to change the temperature of the soil layer.
Snow density is constant with depth, increasing with time from a fresh snow value of 100 kg m−3 that is prescribed after each snowfall event. Snow albedo decreases exponentially with time from a new snowfall. Melting of the snow-pack occurs either when the air temperature is greater than 0°C, or via heat conduction from the soil. The snow cover is assumed to be complete if the snow depth exceeds 0.1 m; if the depth falls below 0.1 m, it is reset to 0.1 m and the fraction of the gridcell covered by snow is reduced.
Experiment Design
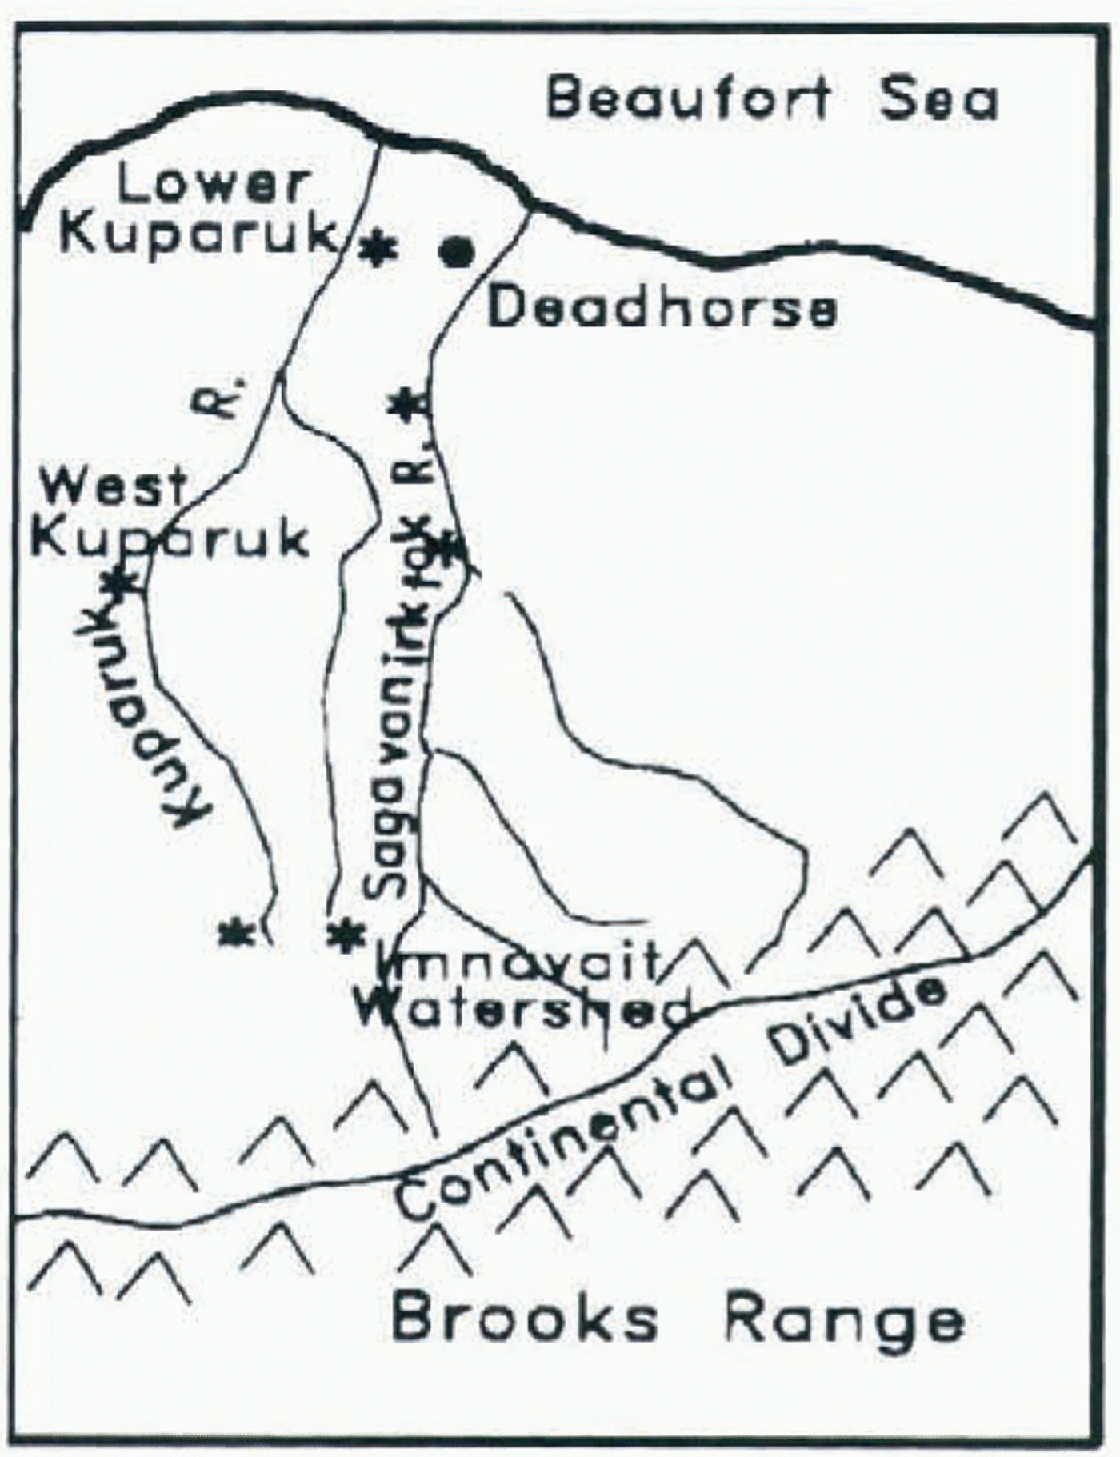
Our tests focus on the Imnavait Watershed site shown in Figure 1, established in conjunction with the NSF Arctic System Science Land-Atmosphere-Ice Interactions Flux Study. The simulations are driven by hourly field measurements for 3 m air temperature, relative humidity, visible and infrared radiative fluxes, wind speed, surface pressure and precipitation. All runs are initialized at Julian 23 May and run until 31 August (100 days) using time steps of 30 minutes.
Map showing the location of the Innavait Watershed field site selected as the focus of the sensitivity studies.
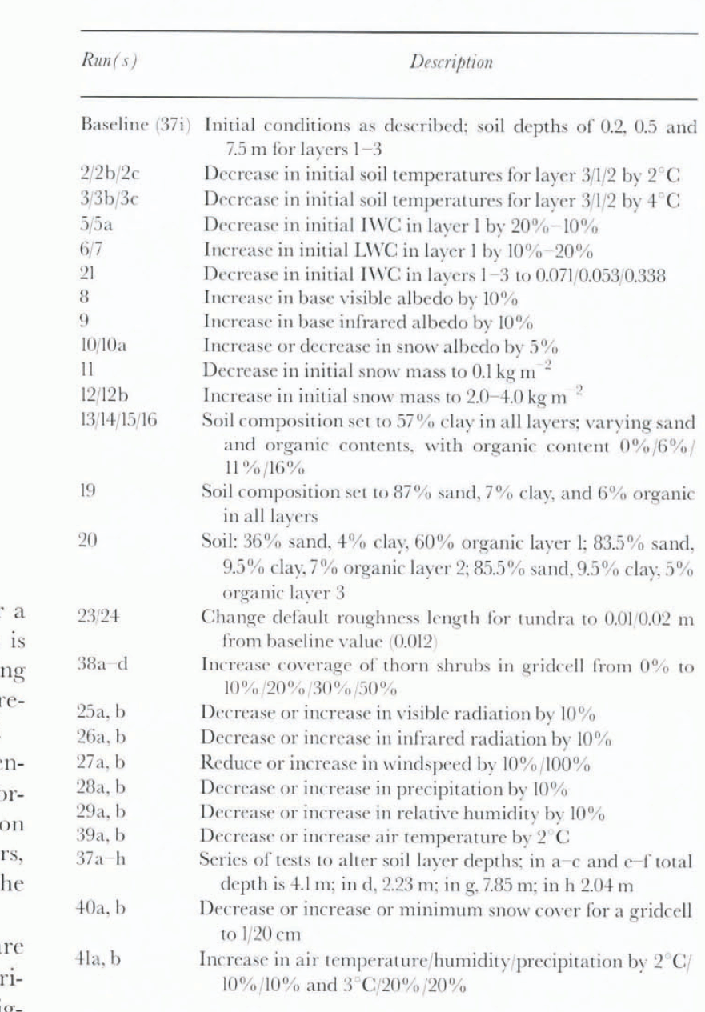
Baseline values for soil temperature, moisture and composition are taken from data provided by Larry Hinzman, Chien-Lu Ping and Tingjun Zhang at the University of Alaska. Following Reference Wilson and Henderson-SeϭllersWilson and Henderson-Sellers (1985), soil drainage is assumed to be impeded. Baseline soil-layer depths of 0.2, 0.5 and 7.5 m are used. For other parameters, the standard values from Reference Verseghy, McFarlane and LazarenVerseghy and others (1993) for tundra have been adopted for the baseline ease, except for a slightly larger roughness length (z 0 = 0.012m), which is used better to approximate tundra vegetation. Lacking more accurate data, an initial snow mass of 1 kg m−2 is prescribed for the baseline case, with a density of 150 kgm−3.
Experiments were conducted to evaluate the model sensitivity to internal parameters as well as to the external forcing parameters. Tests related to soil composition focus on the sensitivity of the addition of organic matter in all layers, as well as the impact of heterogeneous composition in the vertical.
Results from a subset of the full suite of experiments are presented here. Table 1 provides a description of the experiments discussed; the code for the runs is employed in the figures in subsequent sections.
Description of sensitivity experiments
Baseline Run; Sensitivity to Initial Conditions
Figure 2 shows a time series of simulated mean layer 1 (0−20 cm) soil temperatures for the baseline case. The soil layer rapidly warms from the initial sub-freezing condition to melting point, where it remains for about 10 days. Once all the soil ice has melted and/or has been sublimated, the soil temperature shows a marked response to both diurnal and seasonal forcing. Even more marked diurnal forcing is evident in plots of sensible and latent heat flux. There is evidence of a diurnally forced response in all three model layers. These facts suggest that on the whole CLASS responds rapidly to imbalances in the surface-energy budget, particularly on the diurnal time-scale. Unfortunately, the flux study soil data are at daily resolution at best, so directly testing whether such a large and rapid response is appropriate in the Arctic is not yet possible. However, future studies may become possible through other ground-based and/or satellite-derived datasets.
Time series of CLASS layer 1 soil temperature (°C), Julian days 144–244 for the baseline ease. Abscissa scale is timesteps (48d).

Several experiments were performed to assess the impact of varying the initial soil temperature and moisture profiles. Varying the initial temperatures (runs 2−2 c, 3−3 c) had virtually no impact on layer 1 mean temperatures. Layer 2 mean temperatures, in the first and last months, showed some sensitivity to changes in the initial bottom-layer temperature. However, the layer 2 soil moisture showed an increasing sensitivity with time to the initial layer 3 temperatures. Runs 2 and 3, with the lowesl initial layer 3 temperatures, had lower liquid, but higher frozen-water contents, than the other simulations, even though layer 2 temperatures were similar to those of the other simulations. By examining the results for all layers, it appears that in runs 2 and 3 the bottom layer acts as a more effective heat sink for layer 2, leaving less energy available for phase changes in that layer. Such results appear to confirm the important role that permafrost plays not only in determining Arctic soil thermal characteristics, but also its hydrology.
The next set of experiments (5, 5a, 6, 7 and 21) examined the sensitivity of the simulation to changes in the initial moisture content of the soil layers. Since the initial soil temperatures are subfreezing, initially nearly all of the soil water should be in frozen form. However, CLASS, by default, prescribes a minimum volumetric liquid content of 4%. Thus, our experiments varied both the initial liquid and frozen water contents (hereafter abbreviated to LWC and IWC, respectively).
Both the soil moisture and soil temperature fields showed significant sensitivities at all levels to the initial IWC, though not necessarily in a linear fashion. As Figure 3 shows, the two runs with the least initial IWC (runs 5 and 21) show the strongest cooling in layer 2 relative to the baseline run. However, run 21, which is much drier than the other runs, is much colder than run 5 within the 30–60 day period, while being much warmer during the latter stages. Examination of the soil moisture fields indicates that this difference can be attributed to two effects: 1) a reduced heat flux from above, due to the fact that layer 1 is also very dry in run 21, thus reducing the overall thermal conductivity in that layer, and 2) the different degrees of latent heat exchange via phase changes between the two runs.
Time series of CLASS layer 2 soil temperature for runs 5, 5a, 6, 7 and 21, illustrating the sensitivity of soil temperature to initial soil moisture specification.

Sensitivity to External Forcing Parameters
12 simulations (runs 25−29 and 39) tested the sensitivity of CLASS to variations in external forcing. Such experiments can be considered to provide realizations of how the physical system, as represented in the model, would respond to perturbations due to inter-annual variability or global change. Variations of ±10% in the visible and infrared radiation, wind speed, precipitation, relative humidity and air temperature were imposed individually. As changes of 10% in wind speed did not appear to have a noticeable impact, another experiment was performed where the wind speeds were doubled.
The soil temperature and moisture fields at all three levels were largely insensitive to the imposed perturbations in the forcings for the first half of the period. During the second half, however, sensitivity in all fields to the perturbed forcing increased with time, particularly in layer 2. The greatest sensitivities in soil temperatures (in all layers) were found for the runs where the radiative fluxes were increased, with much smaller sensitivities to the other variables.
The sensitivity of soil moisture to the perturbed forcings is much larger than that for soil temperature, especially in layer 2. Differences of up to 40% in IWC occur between simulations by the end of the simulation period, with the largest positive (negative) sensitivities associated with increases (decreases) in radiative fluxes and decreases (increases) in precipitation. Sensitivities to perturbations in the ambient air temperature and humidity were relatively small compared to the sensitivities to radiative fluxes and precipitation. This fact suggests that the strong diurnal sensitivity in CLASS to the surface-energy balance suggested earlier is primarily a sensitivity to the radiant fluxes, since if the latent and sensible fluxes were a critical element, the sensitivity to ambient temperature and humidity would be greater.
Sensitivity to Internal Soil Parameters
Soil depth
Some of the greatest sensitivities found were due to variations in the total soil depth and the depth of individual layers. We illustrate these sensitivities by examining the response of the lowest layer, which ideally should be modeled as permafrost.
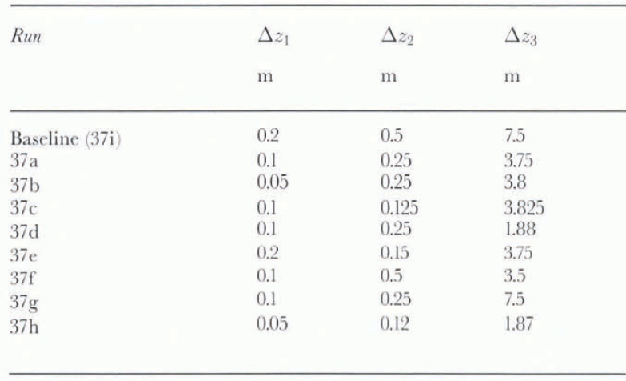
Figure 4 compares the layer 3 mean soil temperature for 9 runs, including the baseline, in which the layer depths were altered. The prescribed depths for each run are given in Table 2. For all depth combinations other than the base-line run (yellow), the lowest layer tended to warm to melting point and remain there as phase changes occurred between soil ice and soil water. Thus, in all but the baseline simulation (and arguably run 37g, brown line), permafrost is not maintained. It would seem that in CLASS, the total soil depth must be much deeper than the standard layer configuration (run 37a, white line) to maintain permafrost conditions adequately. Our results suggest that possible alternatives to a deeper soil are to increase the depth of layer 2 while slightly reducing the depth of layer 3 (run 37f, red line).
Time series of CLASS layer 3 soil temperature (°C) for runs 37a–i, testing sensitivity to soil depths. Run 37i (yellow) corresponds to the baseline run.

Description of soil-depth sensitivity runs
The difference in the time of thaw has strong implications for the hydrology of the bottom layer, and thus the entire soil column. For layer 3, the baseline case has a very small net loss in LWC over the simulation period, while the other cases have increasing water contents, up to 10 times the baseline, commensurate with the time in which the melting point is reached. The changes are even more pronounced in layer 2. All runs, but the baseline and 37g, are characterized by a fairly quick thaw and rise in LWC, the content of which is then modulated by the precipitation events. By contrast runs 37g and the baseline have a much slower rise in LWC that is not modulated by precipitation.
Soil composition
Several runs examined sensitivity to the soil composition (i.e. the percentage of clay, sand and the organic content . These runs can be broken up into two main groups: (1) runs in which the relative proportions of clay, sand and organic matter are the same in all layers, and (2) runs in which the composition of the layers is heterogeneous.
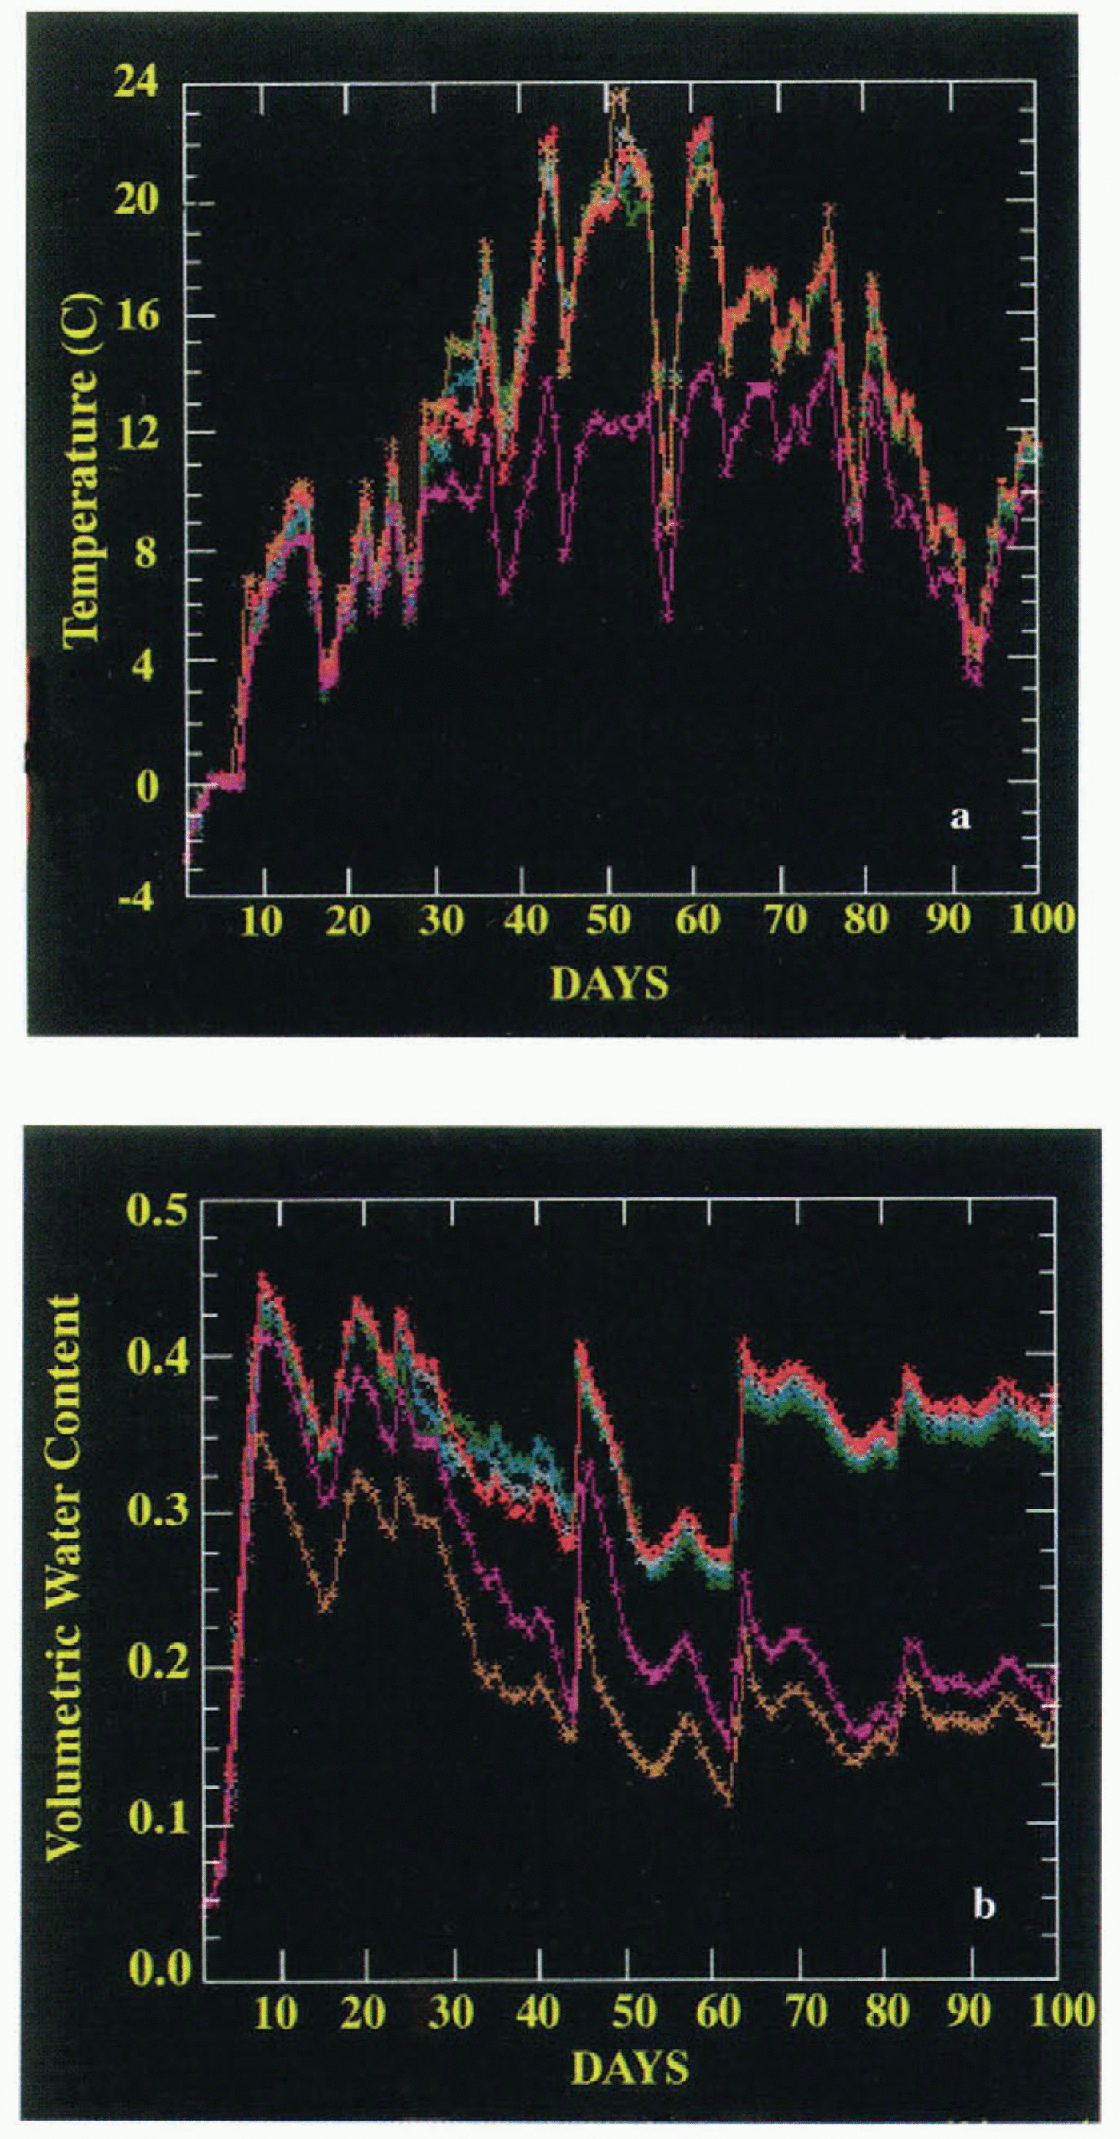
Heterogeneity of soil composition appears to be more important with respect to the sensitivity of the thermal state of the soil than it does the sensitivity of the hydrologic state. This difference, which can be seen by examining the time series of layer 1 soil temperatures and LWC in Figures 5a and b, can be attributed partly to the fact that the specification of an organic soil explicitly impacts thermal, but not hydraulic, conductivities.
The runs can be easily broken up into the above two categories. Runs 13–19, with homogenous soil composition, have much higher mid-season temperatures, and vary only slightly from each other, despite the fact that the sand and organic content changes by up to 16% in runs 13–16, and the clay content in run 19 differs from the others by 50%. Run 20 and the baseline case, with heterogeneous soil composition, are markedly cooler in mid-season from runs 13–16 and also do not vary greatly from each other. These trends continue in layer 2. Thus, the choice of homogeneous vs heterogeneous soil composition in CLASS has significant consequences for the simulation.
The distinctions between the runs with heterogeneous vs homogeneous soil composition is less clear with respect to hydrologic sensitivities. In CLASS, hydraulic properties are primarily determined on the basis of the sand content. A careful comparison of Figure 5b and Table 1 shows that a soil layer's sand content appears to dominate any consideration of the heterogeneity of the soil column. The baseline case, with no sand in layer 1, has the highest LWC throughout the simulation. By Contrast, in run 20 (36% sand in layer 1 but >83% in the other layers), the LWC is only slightly larger than run 19, which has a high sand content in all layers. In runs 13–16, the LWC increases slightly as the specified sand content of the soil layers decreases.
Time series of CLASS layer 1 (a-top) soil temperature and (b-bottom) soil water content for runs 13–16, 20 and 37i, showing the sensitivity of the CLASS model to soil composition.
This behavior does not extend down into layer 2. The baseline case has much less liquid water through the entire simulation than any of the other simulations and there are also qualitative differences in behavior, even with run 20. Further analysis of these results will be required to understand the precise nature of these sensitivities.
Roughness and vegetation
Within CLASS, tundra is grouped within a “grassland” vegetation category. This specification is not appropriate for Alaska's North Slope, where there is significant shrub vegetation. Thus, simulations were conducted to test the sensitivity to differences in (1) the roughness length prescribed for tundra (default 0.012 m) and (2) vegetation changes, representing changes in roughness, albedo, snow distribution, root depth, canopy mass and leaf-area index. In these tests (38a–d) the amount of “thorn shrub” (the closest CLASS vegetation type) was progressively increased to a maximum of 50% from zero.
Changes to tundra roughness length did not result in significant changes from the baseline case. However, there was sensitivity, increasing with depth, to the amount of thorn shrub. Layer 3 temperatures vary by up to 1°C among the simulations (38a–d) which vary the amount of thorn shrub.
This sensitivity of temperature to depth is most plausibly related to changes in soil hydrology, which will change as the mean rooting depths, plant mass and leaf-area index change with the percentage of thorn shrubs. All of these factors affect water uptake by the plants as well as evapotranspiration.
Such differences in soil hydrology are evident in the layer 2 LWCs. In CLASS, layer 2 conceptually represents the root zone. For much of the simulation, the baseline run and the runs that adjust only the roughness length have much lower LWC than the runs with thorn shrubs. Conversely, the thorn shrub runs have substantially smaller IWC. Given that the thermal conductivity of ice is approximately 4 times that of water, the larger ice content allows for more heat transport downward into layer 3. Given that the temperatures in both layers 1 and 2 for all runs are nearly identical past day 25, plus the fact that layer 1 soil moisture also varies little across the runs, the differences in liquid/ice content must be due to the presence of the deeper rooting shrub vegetation in layer 2.
Other surface parameters
The final group of tests (runs 8–12b) assessed the sensitivity of the CLASS scheme to initial snow mass, snow albedo and base albedo for the grid area. The latter two parameters were varied over ranges (±10% and ±5%) that were deemed comparable to potential measurement errors for these quantities. The range of snow mass values tested (0.1−4kgm−2) was deemed representative of extremes in snow conditions at the measurement site for late-May.
The results indicate that CLASS is largely insensitive to changes in the base and snow albedo. Given that much of the period is snow free and that the vegetation distribution dominates the albedo compulation over snow-free areas, this is not surprising. There is slightly greater sensitivity to the initial snow mass, primarily in layer 2.
Summary
We have examined the sensitivities of CLASS for application over Arctic tundra via a series of stand-alone simulations initialized and driven from observations at the Imnavait Creek LAII Flux Study field site.The goal was to provide an assessment of the sensitivities of CLASS for an environment for which it has not been extensively tested.
CLASS has a strong response to diurnal forcing of the surface-energy budget, especially in its top layer. Unfortunately, observational data with finer temporal resolution than presently available are needed to validate this finding.
Apart from diurnal forcing, CLASS displays the strongest sensitivities to variations in soil depth and composition. CLASS appears moderately sensitive to variations in the radiative fluxes, specification of vegetation and initial soil moisture, and, to a lesser extent, soil temperatures. More surprising were the relatively low to zero sensitivities to wind speed, relative humidity, air temperature and precipitation.
One of the criteria for the selection of our baseline case was to obtain a simulation that maintained a permafrost layer such as is commonly observed at this site. We found that it was necessary to have a substantially deeper soil column (5 m) than the standard for CLASS (4.1 m) to achieve this. In addition, a heterogeneous soil specification, with the top layer entirely composed of organic matter, was needed to achieve a bottom layer that did not thaw in the last few days of the simulation. This organic content is larger than the average observed amount for the site (60−80% in the top 10 cm; G. L. Michaelson, personal communication, 1996). It was adopted after experimentation suggested that a more favorable treatment of the organic properties of the layer would be obtained by specifying the layer as completely organic.
Reference VerseghyVerseghy (1991) states that the middle layer conceptually can be thought of as the rooting zone of the soil. For North Slope tundra, that rooting zone usually does not extend down to 70 cm, the bottom of layer 2 in our experiments. Thus the question arises as to whether our layer 2 is representative of the rooting zone. If we include thorn shrubs as an approximation to tundra shrub vegetation, the effective rooting depth is increased if the standard CLASS values for thorn shrub root depth are used. Therefore, such runs retain the conceptual basis for soil layer 2. Perhaps future versions of CLASS can include an “Arctic tundra” land-use type with these characteristics.
The relative size of the sensitivities to internal parameters vs external forcing suggests two additional conclusions. First, that for realistic simulations with CLASS, a correct specification of soil properties is critical. Second, the relatively low sensitivity to variations in external forcings is in significant contrast to that of GCM runs that employ other land surface packages (e.g. Reference Houghton, Jenkins and EphraumsHoughton and others, 1990).



