

Introduction
Driving a car is seminal for independence, mobility, and social activities. The decision whether a person remains fit to drive, will need to be considered very carefully (Hakamies-Blomqvist, Reference Hakamies-Blomqvist2006). The challenge is to identify older drivers at increased risk, without unnecessarily restricting others (Wagner et al., Reference Wagner, Müri, Nef and Mosimann2011). Safe driving requires intact visual, motor, and cognitive functions, which can be affected by numerous aging-related medical conditions (Marshall, Reference Marshall2008). The testing of these functions is essential when assessing older drivers as the presence of a medical condition per se often has limited predictive value with regard to safe driving (Marshall, Reference Marshall2008).
While in many countries there are legally defined minimal requirements for visual performance (e.g., Driver and Vehicle Licensing Agency (DVLA), 2012), the minimal requirements for cognition are less clear (Mosimann et al., Reference Mosimann2012). In clinical practice, usually paper and pencil tests, such as the Mini-Mental State Examination (MMSE; Folstein et al., Reference Folstein, Folstein and Mchugh1975), the Montreal Cognitive Assessment (MoCA; Nasreddine et al., Reference Nasreddine2005), or the Trail Making Test (TMT) A or B (Reitan, Reference Reitan1992) are used, mainly to exclude major cognitive impairment, which could possibly interfere with driving. These tests are very easy and quick to administer and several studies have suggested that impairments in them can be associated with increased crash risk (for a review, see Mathias and Lucas, Reference Mathias and Lucas2009; Wagner et al., Reference Wagner, Müri, Nef and Mosimann2011). However, other studies could not distinguish between safe and unsafe drivers based on the performance in paper and pencil screening tests (O'Neill et al., Reference O'Neill, Neubauer, Boyle, Gerrard, Surmon and Wilcock1992; Dobbs et al., Reference Dobbs, Heller and Schopflocher1998). This is not too astonishing as neither of the paper and pencil screening tests mentioned has been developed to assess fitness-to-drive in older drivers. These tests have poor face validity (Withaar et al., Reference Withaar, Brouwer and Van Zomeren2000) and do not measure motor reaction time and other driving-relevant cognitive functions (Stelmach and Nahom, Reference Stelmach and Nahom1992; Cantin et al., Reference Cantin, Lavallière, Simoneau and Teasdale2009).
Cognitive functions important for driving are selective and divided as visuo-spatial attention (Ball, Reference Ball1997; Aksan et al., Reference Aksan, Anderson, Dawson, Johnson, Uc and Rizzo2012), executive functions (Daigneault et al., Reference Daigneault, Joly and Frigon2002), and eye–hand coordination (Reger et al., Reference Reger, Welsh, Watson, Cholerton, Baker and Craft2004). The measurement of these particular functions requires computer-assisted testing, and personal computers are now available in nearly every office. This has contributed to an increased use of computer-based testing in psychology since the 1980s (American Psychological Association 1986). Their main advantage is a fully standardized test administration, real-time data collection with precise temporal resolution for the measurement of reaction time, automatic analysis of responses, and computer-generated scoring (Mead and Drasgow, Reference Mead and Drasgow1993). When computer testing is used in older people, it is seminal that the interface and the tests be user-friendly and designed for older users. Computer-based testing has been suggested to be useful to separate unsafe from safe older drivers (Ball et al., Reference Ball, Owsley, Sloane, Roenker and Bruni1993; Janke and Eberhard, Reference Janke and Eberhard1998; De Raedt and Ponjaert-Kristoffersen, Reference De Raedt and Ponjaert-Kristoffersen2001). However, most of the commercially available computer-based tests have been designed for the specialist and are not available for the primary healthcare physician because they are too expensive or too time consuming.
An alternative to computer-based testing is driving simulator testing, which has been suggested as a proxy measure to assess driving performance (Lee et al., Reference Lee, Lee, Cameron and Li-Tsang2003). Driving simulators offer excellent controllability, reproducibility, and standardization (i.e., behavior of virtual traffic, weather conditions); ease of data collection (i.e., position on the virtual road, distance from other cars); and the possibility of encountering dangerous driving conditions without being at risk physically (i.e., a child suddenly crossing the road; Reed and Green, Reference Reed and Green1999). Disadvantages are the shortage of research demonstrating validity of simulation and the lack of standardized test protocols. In addition, driving simulator testing is expensive, not easily accessible for primary care physicians or drivers, and simulator sickness is a common side effect, especially for older women (Classen et al., Reference Classen, Bewernitz and Shechtman2011; Reed and Green, Reference Reed and Green1999). The incidence of simulator sickness varies greatly across protocols and test population, ranging from 5% up to 80% (Kennedy et al., Reference Kennedy, Lane, Berbaum and Lilienthal1993; Classen et al., Reference Classen, Bewernitz and Shechtman2011), thereby reducing its utility as a diagnostic tool.
Here we developed the Bern Cognitive Screening Test (BCST), a user-friendly, easy to administer, computer-based cognitive screening test for older drivers. As this is a pilot study, we focused on cognitively healthy older drivers. The test software is available free for download, and the additionally required hardware is cheap (Jäger et al., Reference Jäger, Bieri, Mosimann, Müri and Nef2013). We piloted BCST in safe and unsafe older drivers and hypothesized that (a) safe drivers perform better in BCST than unsafe drivers; (b) BCST is better tolerated than driving simulator testing; and finally (c) BCST is more sensitive than driving simulator testing and paper and pencil screening tests in detecting unsafe drivers.
Methods
Participants
Sixty-one older adults (30 women and 31 men; mean age = 69.8 years; SD = 5.2 years; age range 65–87 years) were recruited by advertisement in local newspapers. The participants were required to have a driver's license for at least 10 years and to have been driving during the last two years. Exclusion criteria for the study were cognitive impairment (MoCA score < 24; Nasreddine et al., Reference Nasreddine2005), visual impairment (corrected far visual acuity < 0.5°, near visual acuity < 0.8), or significant motor impairment (timed-up-and-go test > 12 sec; see Bischoff et al., Reference Bischoff2003). Six participants were excluded due to visual or cognitive impairment. The study was carried out in accordance to the Declaration of Helsinki and was approved by the local ethics board of the Canton Bern. Written informed consent was obtained from all the participants prior to inclusion. No compensation was provided for participation.
Apparatus and materials
Demographic data were collected in a structured interview and the participants were asked about their crash-involvement in the preceding two years. A crash was defined as an unintended collision with another object or person (e.g., car, wall, fence, pedestrian). To assess crash-involvement, the participants indicated for how many times they experienced the following situations in the preceding two years: (1) collision with an object on the road while driving; (2) collision with an object outside the road while driving; and (3) collision with another road user. In addition, the participants indicated whether they were (a) not at fault, (b) partly at fault, or (c) completely at fault in the crash (Hakamies-Blomqvist and Siren, Reference Hakamies-Blomqvist and Siren2003). Near visual acuity (test distance 40 cm) and far visual acuity (test distance 5 m) were measured with participant's glasses using Landolt C or Snellen charts in decimals (Ricci et al., Reference Ricci, Cedrone and Cerulli1998). Contrast sensitivity was assessed with the Pelli-Robson chart at 1 m (Mäntyjärvi and Laitinen, Reference Mäntyjärvi and Laitinen2001). Motor function was measured using the timed up-and-go test (TUG; Bischoff et al., Reference Bischoff2003). In the TUG test the participants had to stand up from an armchair and walk with their usual speed to an obstacle placed at 3 m of distance, then return to the armchair and sit down. This procedure was repeated for three times. The TUG test time reflects the time in seconds for the fastest trial.
Four paper and pencil screening tests were used to assesses cognition: the MoCA (Nasreddine et al., Reference Nasreddine2005), the TMT A and B (Reitan, Reference Reitan1992), and the Clock Drawing Test (CDT; Shulman, Reference Shulman2000). The MoCA is a screening test for global cognitive functioning (executive functions; visual construction; short-term memory; language; attention, concentration, and working memory; and temporal and spatial orientation) and takes about 10–15 min. The scoring ranges from 0 to 30 points (for detailed instructions, see Nasreddine et al., Reference Nasreddine2005). The TMT measures visual attention (TMT A) and executive functions (TMT B) (Reitan, Reference Reitan1992) and takes 3 to 5 min. The result in TMT reflects the time (in seconds) to correctly connect the numbers and/or letters. The CDT measures visuo-constructional abilities, abstract thinking, and executive functions and takes up to 5 min. The scoring ranges from 1 to 7 points (Shulman, Reference Shulman2000).
Bern Cognitive Screening Test
The BCST was presented on a personal computer with Windows 7 (Microsoft Inc.) connected to a 24-inch screen (width 520 mm, height 325 mm; refresh rate 60 Hz; resolution 1680 × 1050 pixels). The input device was a commercially available steering-wheel (Logitech Driving Force GT) and custom-designed foot-pedal (Linemaster Switch Corporation LMT91S). The participants were sitting at 50-cm distance in front of the screen. The BCST included five tests to measure selective and divided attention, executive functions, eye–hand coordination, distance judgment, and speed regulation. It took approximately 15 min to complete these tests. The tests were programmed with MATLAB® R2007b (The MathWorks Inc.). The refresh rate of the image presentation was 30 Hz, the steering-wheel position and the foot-pedal was measured with 30-Hz update rate.
A third person schematic street view was used in all tests. The elements presented in each test were the same for all tests: bold lines indicating the borders of the road; a red dot reflecting the position of the participant's car; squares and triangles representing obstacles (i.e., other cars) that the participant had to avoid; and visual cues at the roadside that had to be recognized. The velocity of the obstacles and the visual cues presented, differed between the tests (1.1–16.0 cm/sec).
The obstacles on the road moved in vertical direction in tests 1–4 (Figure 1). In tests 1, 3, and 4, additional visual cues were presented at the roadside for variable durations ranging from 0.4 to 7.6 sec. Some of them moved horizontally, others did not move at all. In the selective attention test (test 1), the participants were instructed to push the foot-pedal as quickly as possible whenever a blue square appeared at the roadside (either left or right side). One hundred and forty-six visual cues were presented; among them 33 were targets, i.e., blue squares. The number of correct hits, misses, reactions to distracters (e.g., blue triangle), as well as reaction time to target stimuli, was recorded. In the eye–hand-coordination test (test 2), the participants were instructed to steer the red dot (i.e., the participant's car) on the road without collisions with obstacles on the road and with road boarders. One hundred and eighty-nine obstacles appeared on the road and the total number of collisions, i.e., with obstacles or road boarder was recorded. The divided attention test (test 3) combined the tasks of tests 1 and 2. The participants were instructed to steer the red dot on the road without collision and to push the foot-pedal whenever a blue square appeared outside the road. The number of presented visual cues was the same as in tests 1 and 2 (i.e., 146 visual cues outside the road (among these, 33 were targets) and 189 obstacles on the road). The outcome measures were the number of errors, reaction time to targets, and collisions. In the executive functions test (test 4), the participants had to push the foot-pedal as quickly as possible whenever a blue square and a green triangle became visible outside the road. Ninety-one visual cues appeared outside the road. The target combination (blue square and green triangle) occurred for 17 times. The number of hits, misses, reactions to distracters (i.e., blue triangle and green square), as well as reaction time to target stimuli, was measured. In the distance judgment and speed regulation test (test 5), intersections were presented (Figure 2). The horizontal road had oncoming traffic (obstacles were moving horizontally from right to left and left to right; Figure 2). The red dot (i.e., the participant's car) moved toward the intersection and the speed was controlled by the foot-pedal. The participant was instructed to cross the intersection without collision. Twelve intersections with oncoming obstacles at different speeds were presented. The number of collisions and the duration of collisions were measured.
Third person schematic street view in tests 1 to 4 of the BCST. The two black lines indicate the borders of the road. The red dot represents the participants’ car. The other shapes within the road represent objects the participant has to avoid. The shapes outside the road represent objects or obstacles.

Third person schematic street view of the distance judgement and speed regulation test included in the BCST. The black lines represent the borders of the road. The horizontal dotted line represents the halfway line. The horizontal road has oncoming traffic. The other shapes within the road represent other drivers. The red dot represents the participant's car, which needs to cross the road.
A written instruction was read to all participants. Then they had the opportunity to train until it became clear that the participant understood the test instructions. Then the test was started.
Drive in the driving simulator
A fixed frame-driving simulator (F12PI-3/A88, Foerst GmbH) with a customized circuit was used to measure simulated driving performance. The cockpit included the instruments of a Ford Focus and the scenery was projected on three large panels (width 180 cm, height 138.5 cm) placed in a semi-circle in front of the car (Jäncke et al., Reference Jäncke, Brunner and Esslen2008). The track was the same for all participants and included two left turns against oncoming traffic and two line changes. During the drive, two objects crossed the street unexpectedly (child and deer) and two road users violated the right of way (cyclist and car). Speed limits were indicated with street signs. The number of errors (e.g., driving on the wrong lane), lane-keeping precision, traveling speed, and the positions of the steering-wheel and the brake-pedal were recorded. Prior to start driving, the vehicle was explained to participants and they could practice the handling of the car. Participants were instructed to drive as they would drive in real traffic, and the transmission type was selected depending on what they were used to. The drive took approximately 6 min, and once the end of the track was reached, the car stopped automatically. If a participant felt uncomfortable, the simulation was stopped.
Statistical analysis
The number of missed and false positive responses for tests 1, 3, and 4 of the BCST were summed up in order to calculate the total number of errors. Group differences in continuous variables were calculated with Student's t-Test (equal variances) or Welch's non-paired t-Tests (non-equal variances). Normal distribution of continuous variables was tested with the Shapiro-Wilk test. Categorical variables were compared with the χ 2 test, and ordinal variables were compared between the groups by the Mann–Whitney U test. A p-value of <0.05 was considered as statistically significant. As our hypothesis suggested better performance in safe drivers, one-side testing was used unless stated otherwise. p-values for group comparisons in paper and pencil tests, BCST, and driving simulator performance were corrected for multiple comparisons using the Tukey–HSD method. In order to assign equal weight to each test of the BCST, the overall score for the BCST performance was obtained by transforming the individual raw scores of five subtests into percentile ranks and then calculating the median value. Percentile ranks have the advantage of being independent of the underlying scales, and they can be compared across the five tests with different scoring systems and scales (Crocker and Algina, Reference Crocker and Algina2008). To compare sensitivity and specificity values, a Receiver Operating Characteristic (ROC) analysis was used on the basis of different values of the BCST, the paper and pencil screening tests, and the driving simulator testing. The area under the ROC curve (AUC) was calculated for all the tests. The AUC is a measure for test accuracy. When using an ROC-analysis in the context of a screening test with a determined cut-off value, one has to decide whether it is worse to misclassify an unsafe driver as a safe driver (i.e., false negative), or to misidentify a safe driver to be an unsafe driver (i.e., false positive; Murphy, Reference Murphy, Berwickd, Weinstein, Borus, Budman and Klerman1987; Crocker and Algina, Reference Crocker and Algina2008). A screening test in the context of driving aims at the highest possible sensitivity as true and false positives will be referred for further testing (Murphy, Reference Murphy, Berwickd, Weinstein, Borus, Budman and Klerman1987). SPSS Software (version 20), MATLAB® R2007b (The MathWorks Inc.), and MedCalc© (version 12.7.0, Medcalc Software) were used for statistical analysis.
Results
Demographic data
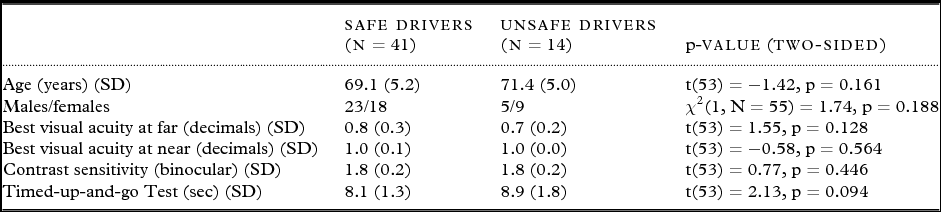
A total number of 55 participants were included. Fourteen participants had experienced crashes in the last two years, where they were partly or completely at fault, and were assigned to the unsafe driver group. The remaining 41 participants were classified as safe drivers. As shown in Table 1, safe and unsafe older drivers did not differ significantly regarding age, gender, best far visual acuity, best near visual acuity, contrast vision, and performance in the TUG test.
Demographics of safe and unsafe driver groups
Cognitive testing
In paper and pencil screening tests no significant differences were found between the two groups (Table 2).
Paper and pencil screening tests results for safe and unsafe drivers

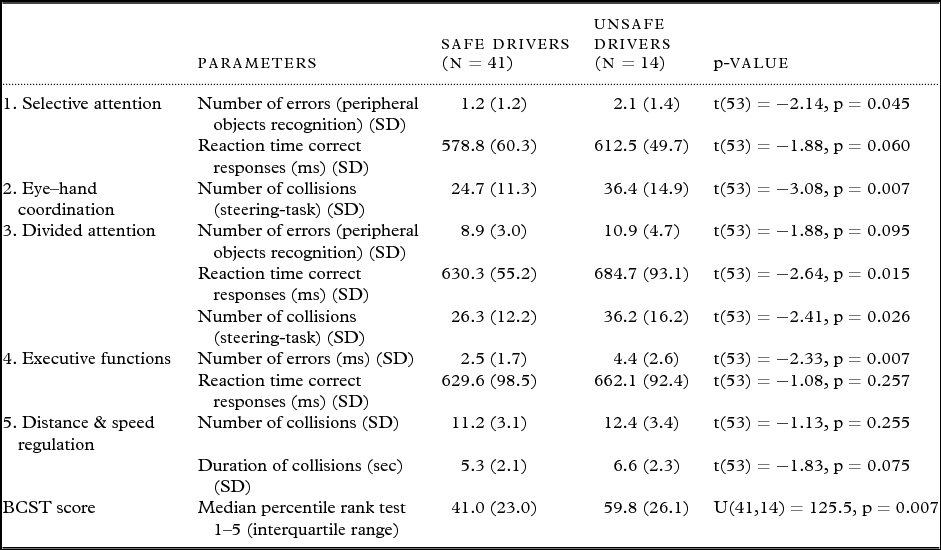
The BCST score expressed as the median percentile rank of five tests shows significant differences between the safe and unsafe driver groups (p = 0.007). All results are summarized in Table 3. In test 1, safe drivers made fewer errors but were not faster in recognizing peripheral objects than unsafe drivers. In the steering test 2, safe drivers had fewer collisions than unsafe drivers. In test 3 (i.e., recognize objects in the periphery and steering), performance in the steering-subtask was not affected by the additional task, while for both groups there was a more than five-fold increase in the number of errors in the peripheral task. In test 4, safe drivers achieved significantly more correct responses than unsafe drivers, but there was no significant group difference in reaction time. Test 5 was the only test where participants could regulate the speed with which they were moving through the scenario themselves, influencing not only the number of collisions but also the duration of collisions. Results in this test show that safe older drivers caused as many collisions with crossing objects as did unsafe older drivers, and the duration of collisions was the same for both groups. There were no dropouts in BCST or paper and pencil screening tests.
BCST results for safe and unsafe drivers
Driving simulator testing
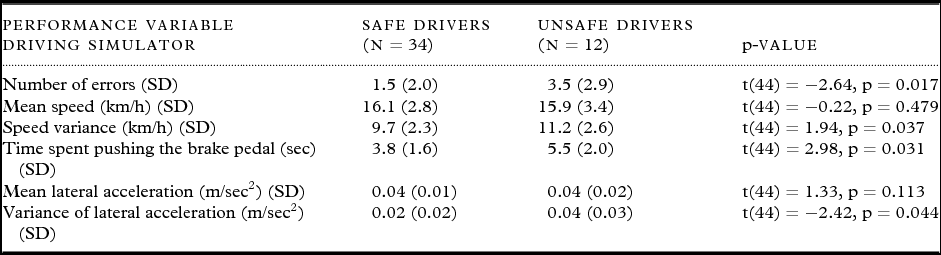
Table 4 summarizes the results achieved in the driving simulator of 46 participants (34 safe; 12 unsafe). Eight participants (15%) did not complete the drive in the driving simulator due to simulation sickness, and one participant had to be excluded from analyses for technical reasons. Results show that safe drivers committed significantly fewer errors during the drive in the driving simulator. While the average traveling speed did not differ between the groups, speed was more homogeneous with less variation in the safe group. This is also reflected by the fact that safe drivers spent less time pushing brake-pedal than unsafe drivers. Steering behavior was measured by the lateral acceleration of the vehicle during the drive. Similar to the traveling speed, also the mean lateral acceleration did not differ between the two groups, but in the safe group steering behavior was more homogeneous with less variation.
Performance in the driving simulator for safe and unsafe drivers
Sensitivity, specificity, and ROC-analysis
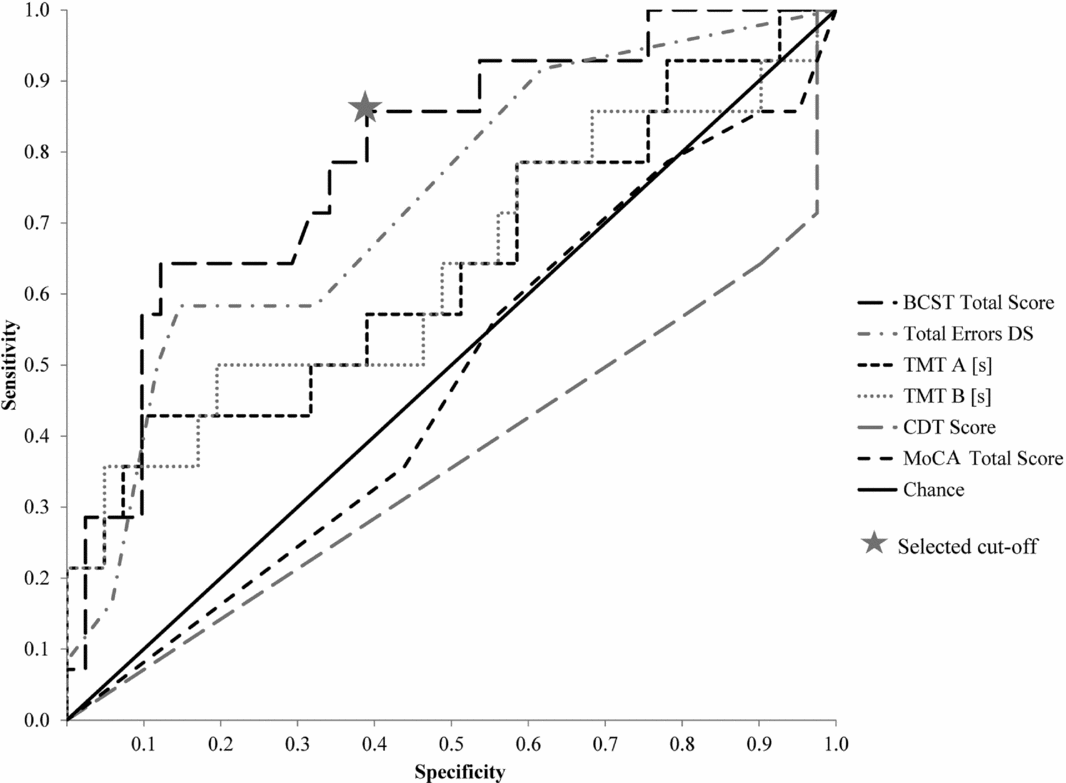
An ROC-analysis was used to evaluate whether BCST, paper and pencil screening tests, and driving simulator testing were able to separate safe from unsafe drivers (Figure 3).
ROC curves for the classification in safe versus unsafe drivers for BCST, paper and pencil screening tests, and driving simulator testing. The star indicates the proposed cut-off for the BCST (45).
The AUC was 79% for the BCST, 73% for the driving simulator test, 64% and 63% for the TMT A and TMT B respectively, 47% for the MoCA, and 36% for the CDT. When compared with a random classifier, BCST (p < 0.001) and driving simulator (p = 0.006) were significantly better than chance in classifying safe and unsafe drivers. This difference was not significant for TMT A (p = 0.149) and TMT B (p = 0.172). Although the AUC of BCST was higher than the AUC of driving simulator test, this difference was not significant (p = 0.745). The ROC curve of the BCST reveals that in the current sample, the highest sensitivity, while maintaining a reasonable specificity, appears to be achieved at a percentile rank of 45, which leads to a specificity of 86% and sensitivity of 61%. Positive and negative predictive values for this cut-off are 42.8% and 92.5% respectively.
Discussion and conclusions
Here we assessed driving-relevant cognitive functions, i.e., selective and divided visuo-spatial attention, executive functions, eye–hand –coordination, and distance and speed regulation in older drivers using a computer-assisted test battery (BCST). Safe drivers performed better than unsafe drivers in four of the five subtests of BCST and in the driving simulator, but no significant group differences were found in paper and pencil screening tests. BCST was better tolerated than testing in the driving simulator. Contrary to the drive in the driving simulator, all the participants were able to understand and carry out the instructions and to complete the BCST and no negative events occurred, indicating user-friendliness and acceptance. BCST was also more sensitive than testing in the driving simulator or paper and pencil screening tests in detecting unsafe older drivers.
Safe older drivers performed significantly better in all five BCST tests compared with unsafe older drivers, and the group differences were largest for the divided visuo-spatial attention, executive functions, and eye–hand-coordination tasks. This finding is consistent with previous studies (Ball, Reference Ball1997; Daigneault et al., Reference Daigneault, Joly and Frigon2002), which emphasized that visuo-spatial attention, divided attention, and executive functions are seminal for driving. The results show that timed cognitive testing is essential when screening for cognitive impairment in the context of driving, as the paper and pencil screening tests did not reveal any differences between the groups. The TMT B and the digit span of the MoCA do also test executive functions, but the group differences became obvious only when dynamic computer-assisted testing was used.
Recent crash-involvement was not only associated with poorer performance in the BCST but also in the driving simulator. Compared with safe drivers, unsafe older drivers committed more errors in the driving simulator, their speed management was less homogeneous, and their lane-keeping was more unsteady. Our findings are in line with previous findings (Cantin et al., Reference Cantin, Lavallière, Simoneau and Teasdale2009; Bélanger et al., Reference Bélanger, Gagnon and Yamin2010). Especially the association between crashes in real traffic and errors in the driving simulator was reported before (Daigneault et al., Reference Daigneault, Joly and Frigon2002; Lee et al., Reference Lee, Lee, Cameron and Li-Tsang2003). Furthermore, the existing research shows that in older drivers greater heterogeneity of lane-keeping is associated with unsafe driving (Park et al., Reference Park2011). A major disadvantage of driving simulator testing, which was encountered in our study, is simulator sickness (Classen et al., Reference Classen, Bewernitz and Shechtman2011). Due to simulator sickness, 15% of our participants were not able to complete the drive in the driving simulator. Feeling sick while driving is likely to affect performance and it may contribute to biased results and dropouts, which might lead to selection bias within the study population. Therefore, we investigated in a post hoc analysis how the exclusion of the participants who were not able to complete the drive in the driving simulator would affect the results. In the reduced sample, the difference between safe and unsafe drivers in the TMT A was significant (p = 0.041). In this post hoc analysis, the same performance variables of the BCST (see Table 3) as in the complete sample differed significantly between the groups (p-values between 0.004 and 0.030), except for reaction time in test 1 (selective attention, p = 0.067), number of errors in test 3 (divided attention, p = 0.081), and duration of collisions in test 5 (distance and speed regulation, p = 0.153). This limitation should be kept in mind when interpreting the results.
In this study, only BCST and driving simulator testing were able to classify older drivers according to their recent crash-involvement better than chance. The application of previously published cut-offs (Wagner et al., Reference Wagner, Müri, Nef and Mosimann2011) leads to a rather low sensitivity for all paper and pencil screening tests, and in the present test sample, BCST was best in identifying unsafe older drivers. While performance of the BCST in classifying safe and unsafe drivers was far from perfect, these values lay within what is to be expected for screening tests measuring multifaceted characteristics, e.g., cognitive status, ability to drive safely (Ball et al., Reference Ball, Owsley, Sloane, Roenker and Bruni1993; Janke and Eberhard, Reference Janke and Eberhard1998; De Raedt and Ponjaert-Kristoffersen, Reference De Raedt and Ponjaert-Kristoffersen2001). It compares well with the sensitivity and specificity values found in previous studies when predicting failure in on-road tests (Janke and Eberhard, Reference Janke and Eberhard1998) or when identifying unsafe drivers (Ball et al., Reference Ball, Owsley, Sloane, Roenker and Bruni1993).
Good quality is essential for psychometric assessments (Crocker and Algina, Reference Crocker and Algina2008). Objectivity in BCST was high as instructions were read to the participant, and the calculation of test scores was standardized. It can be further improved by providing standardized computer-based instructions. Internal consistency, a reliability measure, was high for selective attention (reaction times test 1: Cronbach's α 0.96), divided attention (reaction time test 3: Cronbach's α 0.87), and executive functions (reaction time test 4: Cronbach's α 0.88). Nothing can be said about test-retest reliability and inter-rater reliability, as in this pilot study, the participants were tested only once and the same person assessed all the participants. Face-validity scores ranged from 5.6 to 6.6 on a scale from 1 (poor face validity) to 10 (high face validity), indicating that the participants felt that these tests were about driving. Poor face validity is a common criticism in paper and pencil screening tests, especially when used in the context of driving assessment (Withaar et al., Reference Withaar, Brouwer and Van Zomeren2000). Face validity was enforced by using steering-wheel and foot-pedals as input devices and by presenting a schematic third person view driving scenario. Criterion validity (concurrent validity) is supported by the fact that performance in BSCT was significantly different between the groups. Further studies are needed to establish the psychometric properties of the BSCT in more detail.
The study has some limitations. First, being a pilot study, the number of participants included is relatively small. The study aimed to show that BCST is feasible, easy to administer, and user-friendly for older drivers. BCST results do not allow drawing conclusions about fitness to drive, as BCST is only a screening tool to identify older drivers with driving-relevant cognitive impairment, which may need further in-depth specialist assessments. The participants in this study were all cognitively unimpaired, so reported findings might not yet be generalized to other groups, such as persons with cognitive impairment or dementia. This will need to be addressed in future studies. Furthermore, the classification between safe drivers (without crashes) and unsafe drivers (with crashes in the preceding two years) is based on self-reports alone, a method which is supported by some studies (Lee et al., Reference Lee, Lee, Cameron and Li-Tsang2003; Reimer et al., Reference Reimer, D'Ambrosio, Coughlin, Kafrissen and Biedermann2006) but challenged by others (Wåhlberg, Reference Wåhlberg2003). Research supports the construct validity of self-reported crash-involvement as proxy measure for driving performance (Lee et al., Reference Lee, Lee, Cameron and Li-Tsang2003; Reimer et al., Reference Reimer, D'Ambrosio, Coughlin, Kafrissen and Biedermann2006) but part of the criticism is about the duration of time period under consideration, the negligence of culpability, and the retrospective assessment of driving behavior (Wåhlberg, Reference Wåhlberg2003). To overcome the part of the criticism, we followed the suggestions by Wåhlberg (Reference Wåhlberg2003), and considered only the preceding two years of driving and crashes, in which participants considered themselves at least partly at fault. The validity of the grouping variable is further supported by the fact that drivers without crashes drove better in the driving simulator than those with a crash history.
In conclusion, our findings show that cognitive screening in older drivers should focus on driving-relevant cognitive functions. The screening should not be based on one test alone, and timed and computer-assisted tests are superior to paper and pencil screening tests or testing in the driving simulator. The strength of computer-assisted cognitive screening tests, such as BCST, is that they are well tolerated and easy to handle. They are also easily accessible, but need special equipment (computer, steering-wheel, foot-pedal). Paper and pencil screening tests are very easy and quick to administer, but they are less sensitive in detecting unsafe drivers. Driving simulator testing is also not necessarily time-consuming but is expensive and simulator sickness is a common side effect, which interferes with performance. Therefore, computer-assisted tests, like the BCST, are likely to become the future tool for primary care physicians or memory clinics when assessing cognition in the context of driving, because they are easily accessible and take an intermediate position between simple paper and pencil screening tests and driving simulator or on the road driving testing.
Conflict of interest
None.
Description of the author's roles
Research questions and study design were formulated in collaboration with all the authors. The study was carried out and the data were analyzed by the first author. The manuscript was written and revised as a collaboration by all the authors.