Introduction
The brown planthopper (BPH), Nilaparvata lugens Stål (Hemiptera: Delphacidae), is one of the most serious insect pests affecting rice crops, and is widely distributed throughout Asia (Dyck & Thomas, Reference Dyck and Thomas1979). BPH causes damage by sucking sap from the phloem of growing rice plants, thereby negatively affecting plant development. When infested by high densities of BPH, rice plants completely wilt and dry, resulting in obvious circular patterns in rice fields, called ‘hopperburn’ (Dyck & Thomas, Reference Dyck and Thomas1979).
In the Indochina Peninsula, the severe damage by BPH has been reported in last decade (e.g. southern part of Vietnam in 2007–2008 and central part of Thailand in 2009–2010). Especially in the southern part of Cambodia, the damage has been reported discretely by local governmental officials and rice farmers since 2007 (Matsukawa et al., Reference Matsukawa, Ito, Kawakita and Tanaka2014) and suggested the possibility of the regional difference of its infestation within the countries. Identifying the distribution and the dynamics of BPH population in a particular region and determining whether populations from distinct regions are genetically differentiated in a country, both are necessary to apply to the regional pest management; however, there is still limited studies of BPH occurrence in Cambodia such as timing of appearance, distribution, numbers of each morphotype, and its genetic differences even in main rice-producing areas of the country.
Differences in BPH populations have been revealed between tropical and temperate regions of Asia with regard to both phenotypic (Nagata & Masuda, Reference Nagata and Masuda1980; Wada et al., Reference Wada, Ito, Takahashi and Tang2007, Reference Wada, Ito, Takahashi and Tang2009; Matsumura et al., Reference Matsumura, Takeuchi, Satoh, Sanada-Morimura, Otuka, Watanabe and Thanh2008) and genetic characteristics (Mun et al., Reference Mun, Song, Heong and Roderick1999; Matsumoto et al., Reference Matsumoto, Matsumura, Sanada-Morimura, Hirai, Sato and Noda2013). It might have been difficult to clarify these differences on a smaller scale (i.e. within a country), without the genetic markers to distinguish the regional population (Matsumoto et al., Reference Matsumoto, Matsumura, Sanada-Morimura, Hirai, Sato and Noda2013). However, cutting edge techniques, such as analyses of DNA polymorphisms using next-generation sequencing (NGS) could be used to resolve differences between local populations.
NGS enables the measurement of genetic diversity via single nucleotide polymorphisms (SNPs), for example, which account for a large proportion of genetic variation and are frequently used as genetic markers in the field of population genetics (Morin et al., Reference Morin, Luikart and Wayne2004). When combined with genotyping methods, such as genotyping-by-sequencing (GBS), these techniques become powerful tools. GBS is used to simultaneously execute the discovery and determination of SNPs and the identification and estimation of allele frequencies (Stapley et al., Reference Stapley, Reger, Feulner, Smadja, Galindo, Ekblom, Bennison, Ball, Beckerman and Slate2010; Kakioka, Reference Kakioka2013). This approach is based on restriction enzyme digestion, which enables a reduction in the complexity of genomes (Poland et al., Reference Poland, Brown, Sorrells and Jannink2012; Beissinger, et al., Reference Beissinger, Hirsch, Sekhon, Foerster, Johnson, Muttoni, Vaillancourt, Buell, Kaeppler and Leon2013). Furthermore, aside from being relatively low-cost and rapid, these techniques are applicable to all organisms, even without prior genomic knowledge (Stapley et al., Reference Stapley, Reger, Feulner, Smadja, Galindo, Ekblom, Bennison, Ball, Beckerman and Slate2010; Kakioka, Reference Kakioka2013). Double-digest GBS is simple and can be performed with less DNA (e.g. Poland et al., Reference Poland, Brown, Sorrells and Jannink2012). Although GBS yields sequences with low coverage, it produces a sufficient amount of high-depth genotype information in a single sequencing run (Poland et al., Reference Poland, Brown, Sorrells and Jannink2012; Beissinger et al., Reference Beissinger, Hirsch, Sekhon, Foerster, Johnson, Muttoni, Vaillancourt, Buell, Kaeppler and Leon2013). To date, SNPs identified using GBS have been used for population genetics studies in mammals (White et al., Reference White, Perkins, Heckel and Searle2013; Wong et al., Reference Wong, Lai, Saw, Ong, Cheng, Pillai, Liu, Xu, Chen, Foo, Tan, Koo, Soong, Wenk, Lim, Khor, Little, Chia and Teo2014), plants (Labate et al., Reference Labate, Robertson, Strickler and Mueller2014), fungi (Wilson et al., Reference Wilson, Wickett, Grabowski, Fant, Borevitz and Mueller2015), fishes (Li et al., Reference Li, Waldbieser, Bosworth, Beck, Thongda and Peatman2014; Pujolar et al., Reference Pujolar, Jacobsen, Als, Frydenberg, Munch, Jonsson, Jian, Cheng, Maes, Bernatchez and Hansen2014), and insects (Silva-Brandão et al., Reference Silva-Brandão, Silva, Brandão, Omoto and Sperling2015). These species included non-model organisms and species with limited available genome information, indicating that GBS could be useful for clarifying the potential differences in BPH populations.
A genome map for the BPH was constructed in 2013 (Jairin et al., Reference Jairin, Kobayashi, Yamagata, Sanada-Morimura, Mori, Tashiro, Kuhara, Kuwazaki, Urio, Suetsugu, Yamamoto, Matsumura and Yasui2013), and the complete mitochondrial genome was sequenced using NGS (Zhang et al., Reference Zhang, Zhu, Rong, Zhang, Ding, Liu, Chen, Du and Hong2013). The whole genome of BPH was sequenced by Xue et al. (Reference Xue, Zhou, Zhang, Yu, Fan, Wang, Xu, Xi, Zhu, Zhou, Pan, Li, Colbourne, Noda, Suetsugu, Kobayashi, Zheng, Liu, Zhang, Liu, Luo, Fang, Chen, Zhan, Lv, Cai, Wang, Huang, Cheng, Zhang, Lou, Yu, Zhuo, Ye, Zhang, Shen, Yang, Wang, Wang, Bao and Cheng2014). Despite these advances in studies involving the BPH genome, GBS has not yet been utilized to study the BPH.
Hence, the objectives of this study were to analyze (1) the time alteration of BPH population in rice fields in the Takeo Province (interval sampling), and (2) the distribution and morphotype occurrence of BPH in the main Cambodian rice-producing area by focusing on the southern part of the country (random sampling). We also aimed to clarify (3) whether BPH populations from distinct regions are genetically differentiated based on GBS-obtained SNP information, by using BPH from three locations in south and northwest part of Cambodia during the peak rice-producing season (i.e. August in the rainy growing season).
Material and methods
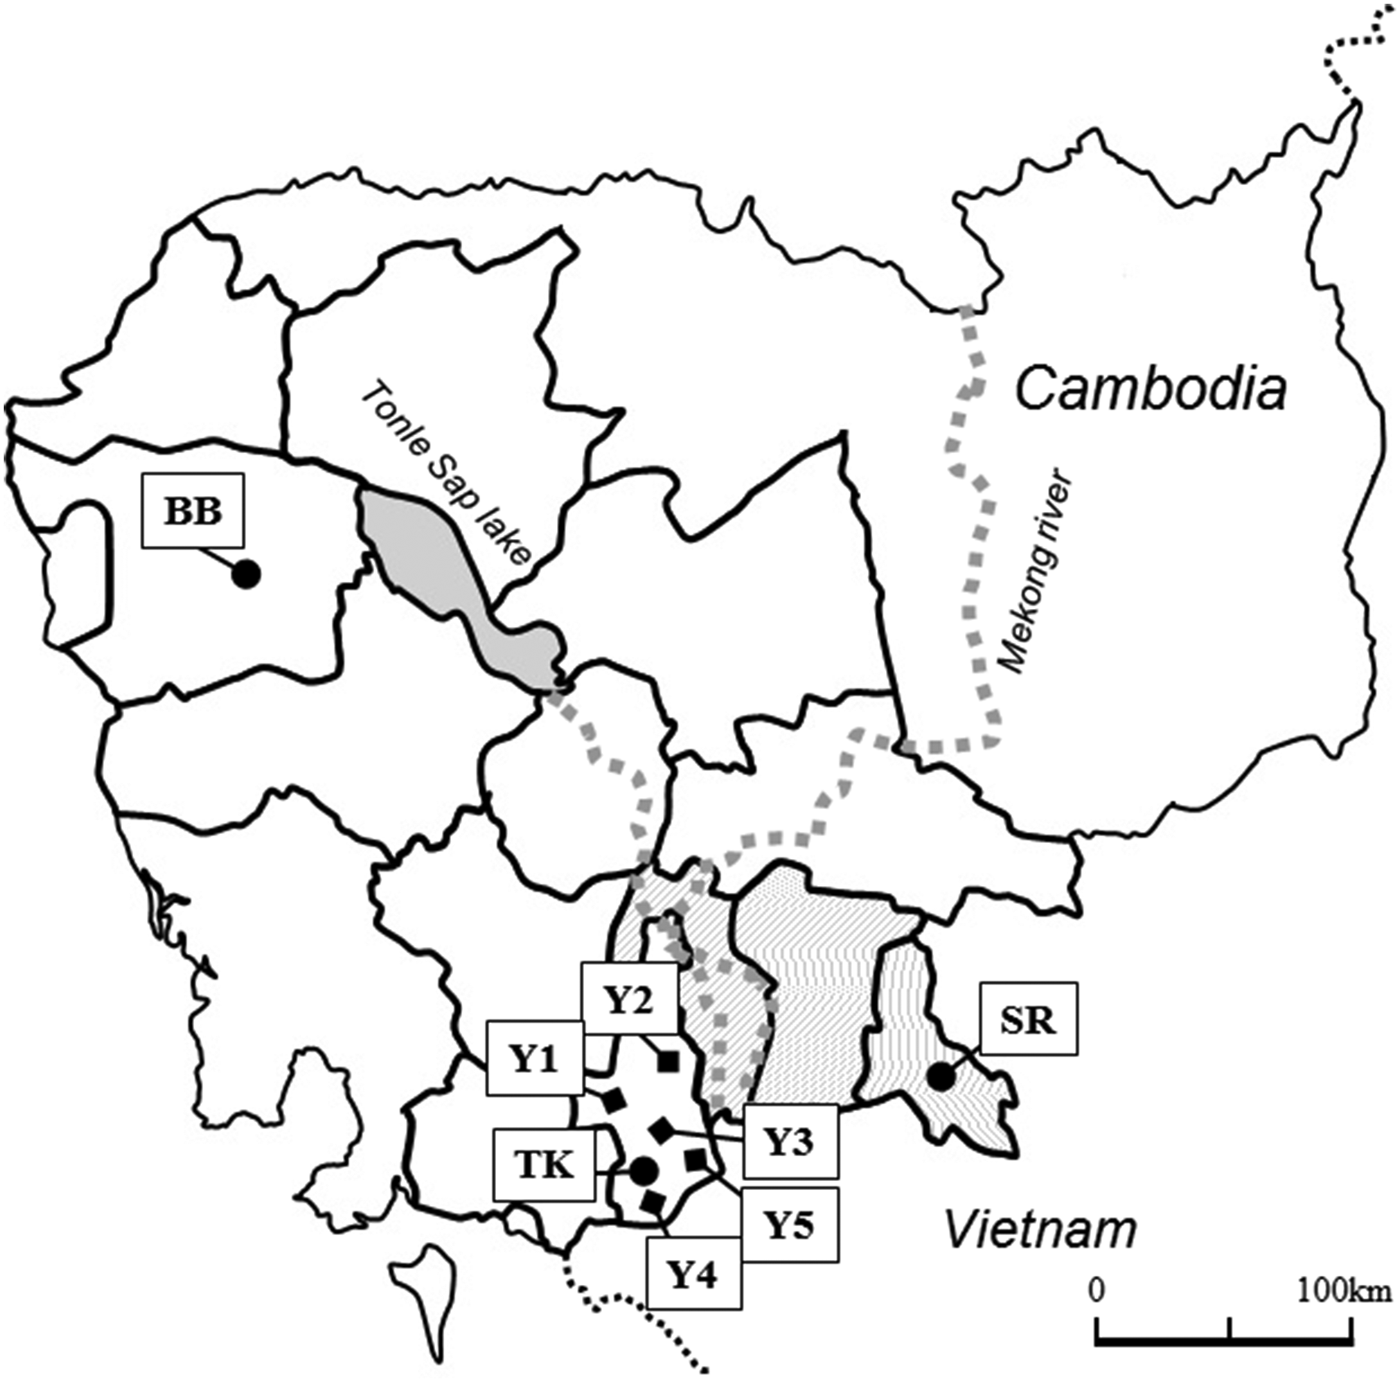
To confirm the population alternation in the rice fields, we collected BPH by yellow sticky traps method at weekly intervals in (a) five rice fields of the Takeo Province, which had experienced BPH damage (Matsukawa et al., Reference Matsukawa, Ito, Kawakita and Tanaka2014). The timing and distribution of BPH morphotypes, adults (macropterous and brachypterous) and nymphs, were confirmed by random sampling with aspirators in (b) the 13 main rice-producing provinces, including the provinces near the Vietnam border (86 rice fields in total). Then, we collected BPH specimens for GBS analysis in (c) a field in northwest (Battambong Province) and two fields in south (Takeo and Svey Rieng Provinces) (table 1; fig. 1).
Sampling site of brown planthoppers in Cambodia. Trap sampling was conducted in five rice fields in the Takeo Province (Y1–Y5). Random sampling was conducted in the main rice-producing provinces (bold line), including the provinces near the Vietnam border (Svay Rieng, Prey Veng, Kandal Provinces) (diagonal line). Sampling for GBS was conducted in BB (Battambang), TK (Takeo), SR (Svay Rieng Provinces).

Sampling data.

1 Provinces around the Tonle Sap Lake and Mekong River; Battambang, Banteay Meanchey, Pursat, Seam reap, Kompong Thom, Kompong Cham, Svay Rieng, Prey Veng, Kandal, Kampot, Kompong Spue, Kompong Chunang, Takeo Provinces shown with the bolded line in fig. 1.
2 Two fields in 25 fields were collected in the provinces close to Vietnam (Prey Veng and Kandal Provinces) on 12th and 13th August 2013.
3 Seven fields in 41 fields were collected in the provinces close to Vietnam (Prey Veng, Kandal, and Svay Rieng Provinces) on 25th and 26th June 2013.
Sampling with the yellow sticky trap method
To confirm the potential alterations within the population during the rainy growing season, we have collected BPH using the yellow sticky traps (only macropterous adults can be sampled by this method) sampled at regular intervals; three cruciform-shaped traps were set up at each rice field (sampling site), affixed to bamboo sticks approximately 20 cm above canopy, separated by 15–30 m. Each cruciform-shaped trap was combined with four yellow sticky sheets (size: 10 cm × 25 cm; Kamoi Co. Ltd., Japan). We exchanged the traps every 7–10 days in the five rice fields; two fields in the north (Y1, Y2), one in the center (Y3), and another two (Y4, Y5) in the south part of the Takeo Province (fig. 1). The survey was conducted during the rainy season of 2012 and 2013 (table 1).
Sampling with aspirator
BPH was collected using aspirators at 30–50 rice plant hills in each rice field to confirm the timing and distribution of morphotypes. Collected specimens were preserved in ethanol, and were subsequently counted and grouped by life stage (adult or nymph), sex, and wing form (macropterous or brachypterous). Samplings were conducted in rice fields located along the national roads in the main rice-producing area around the Tonle Sap Lake and Mekong River two times in 2013. Additionally, to confirm the potential alterations of BPH populations, we sampled another two times in the provinces near the border with Vietnam (i.e. Svay Rieng, Prey Veng, and Kandal Provinces) (fig. 1; table 1).
Specimen collection and laboratory conditions
To determine the genetic differences of BPH populations within the country, the specimens were collected using aspirators in the three locations: TK, Takeo Province; SR, Svay Rieng Province in the south; and BB, Battambang Province in the northwest part of the country (fig. 1; table 1) in August 2015, as BPH occurred in the entire main rice-producing area during the rainy season. At least 30 BPH individuals were collected in each field. The collected BPHs were then reared for two generations in a chamber in an isolated insect-breeding room at Nagoya University (26°C, 80% humidity, 16:8 h (Light:Dark)), where they were fed with rice seedlings of the BPH-susceptible variety (Oryza sativa L. cv. nipponbare). Subsequently, 14 macropterous females from each location (42 specimens in total) were used for GBS analysis.
DNA extraction and whole genome amplification
DNA was extracted from the heads of each individual using the DNeasy Kit (Qiagen, Valencia, CA, USA), and approximately 40 ng of the extracted DNA samples were used for whole genome amplification using a REPLI-g mini kit (Qiagen). The quality of the amplified DNA was analyzed using electrophoresis on 2% agarose gels in 1× Tris-acetic acid-EDTA (40 mmol l−1 Tris, 20 mmol l−1 acetic acid, and 0.5 mmol l−1 Na2-EDTA). A QuantiFluor dsDNA system and a Quantus fluorometer (Promega, Madison, WI, USA) were used for quantification of amplified, double-stranded DNA.
Library construction for GBS
A GBS library was prepared following the protocol of Poland et al. (Reference Poland, Brown, Sorrells and Jannink2012). In brief: (1) 200 ng (20 ng μl−1 × 10 µl) of each individual sample was digested with PstI (CTGCAG) and MspI (CCGG), which were used as ‘rare-cutters’ and ‘common-cutters’, respectively; (2) digested DNA was ligated to barcode adaptors (PstI site) and a ‘Y-adapter’ (MspI site); (3) ligated samples were pooled (multiplexed) and purified using a QIAquick PCR purification Kit (Qiagen); (4) pooled DNA was amplified by outer primers to add sequences for primer sites and flowcell-binding sequences for Illumina sequencing; (5) amplified pooled DNA was purified using the QIAquick PCR purification Kit, quantified with the QuantiFluor dsDNA system (Promega), and quality checked using a MultiNA electrophoresis instrument (Shimadzu); and (6) the library was diluted to 10 pM and used for NGS by MiSeq (Illumina Inc., San Diego, CA, USA) together with 5% of PhiX control (PhiX Control v3, Illumina). Two sequencing runs were conducted using MiSeq Reagent Kit v3 (150 cycles).
Processing of GBS data
The BPH genome (Xue et al., Reference Xue, Zhou, Zhang, Yu, Fan, Wang, Xu, Xi, Zhu, Zhou, Pan, Li, Colbourne, Noda, Suetsugu, Kobayashi, Zheng, Liu, Zhang, Liu, Luo, Fang, Chen, Zhan, Lv, Cai, Wang, Huang, Cheng, Zhang, Lou, Yu, Zhuo, Ye, Zhang, Shen, Yang, Wang, Wang, Bao and Cheng2014) was downloaded from GenBank (BioProject PRJNA177647) and used as reference genome to map our raw-sequence reads and to generate a variant call format (VCF) file using TASSEL-GBS (Glaubitz et al., Reference Glaubitz, Casstevens, Lu, Harriman, Elshire, Sun and Buckler2014). The VCF file was filtered using VCF tools (Danecek et al., Reference Danecek, Auton, Abecasis, Albers, Banks, DePristo, Handsaker, Lunter, Marth, Sherry, McVean and Durbin2011) with the following criteria: (1) minimum minor allele frequency = 0.05, (2) minimum read depth = 5, (3) no missing, and (4) P-value > 0.05 for the Hardy–Weinberg equilibrium test. PGDSpider (Lischer, Reference Lischer2014) was used for the file format conversion.
Population genetics
We used Arlequin version 3.5 (Excoffier & Lischer, Reference Excoffier and Lischer2015) to estimate the observed and expected heterozygosity for all identified SNPs (H o and H e). The fixation index (Fst) between the samples from the three locations was calculated using Genepop (version 4.5.1) (Rousset, Reference Rousset2015). We used Tassel 5 (Glaubitz et al., Reference Glaubitz, Casstevens, Lu, Harriman, Elshire, Sun and Buckler2014) for principle component analysis (PCA). To infer population structure, fastSTRUCTURE (Raj et al., Reference Raj, Stephens and Pritchard2014) was used with a change in the number of ancestry populations (K = 1 to 10).
Results
BPH occurrence
Occurrence in the Takeo Province
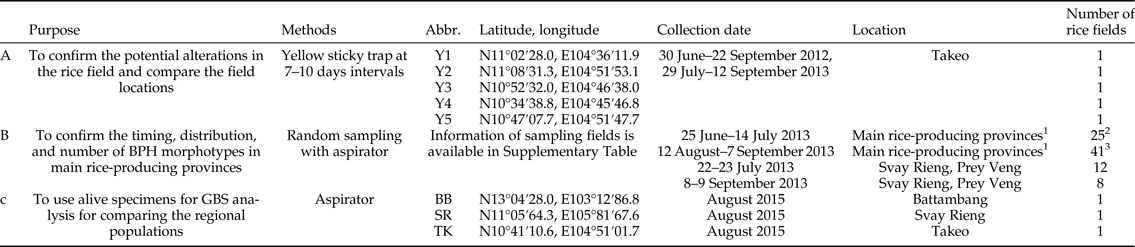
Three peaks in the density of macropterous adults were observed during the rainy season in 2012 and 2013; at the beginning and end of July and at the beginning of September (fig. 2) with the peak at the end of July to be the highest observed in either year. While a small number of BPH were observed in Y1 in both years, a large number was observed in Y4 in 2012 and in Y5 in 2013 (fig. 2).
Number of macropterous brown planthopper (BPH) collected using yellow sticky traps in five fields in the Takeo Province, Cambodia. The sampling was conducted during the rainy season over 2 years, 30 June–22 September 2012 and 29 June–12 September 2013, in the five target fields.

BPH occurrence in main rice-producing areas
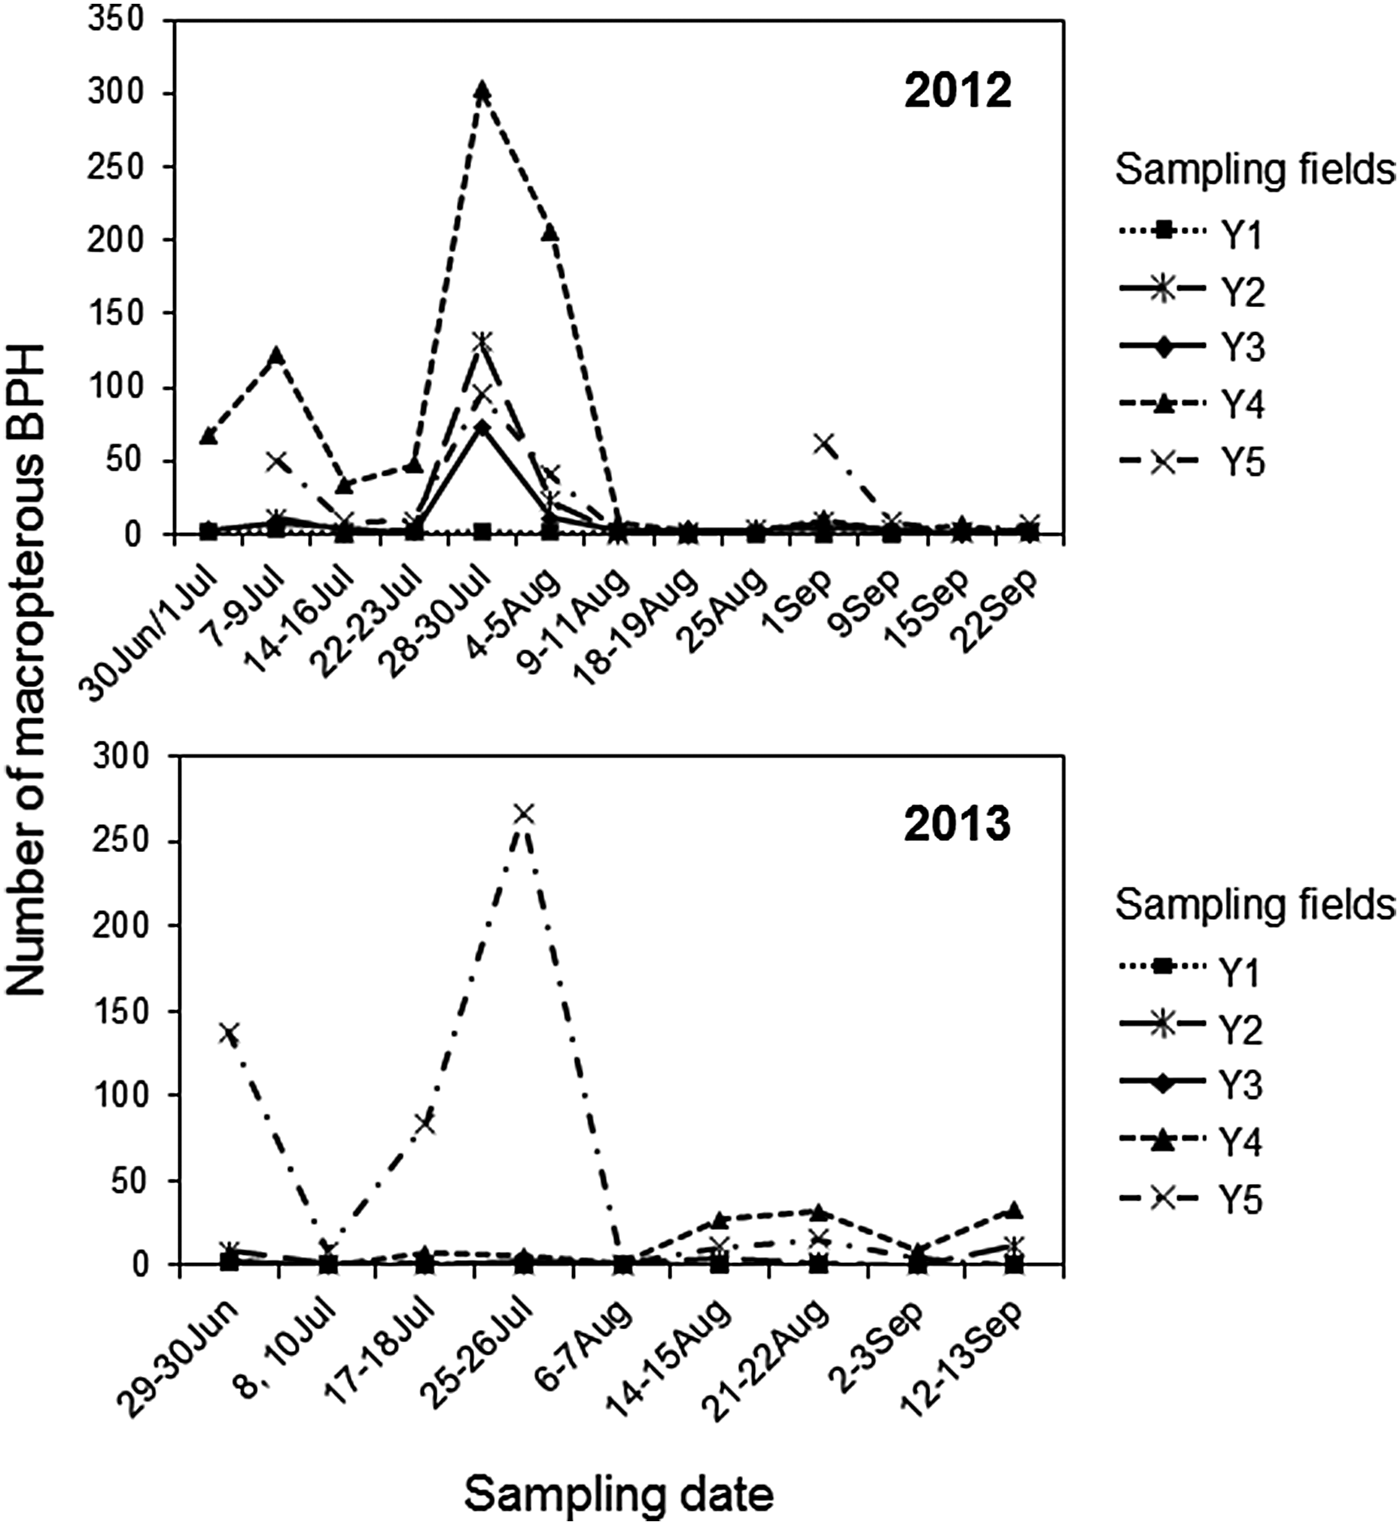
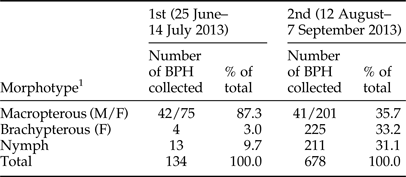
In 13 main rice-producing provinces in June–July (table 1), <10 individuals were collected in 22 fields, mostly in the central/northwestern part of the country, while relatively larger in south (fig. 3a). Macropterous adults accounted for 87.3% (n = 134) of the total BPH (table 2). In samples collected in August, the total number of collected individuals increased (fig. 3b), and the proportion of brachypterous and nymphs increased to 33.2 and 31.1% of the total (n = 678), respectively; whereas macropterous forms made up 35.7% of the samples (table 2).
Sampling of brown planthopper (BPH) via aspirator in main rice-producing areas in Cambodia. Samplings were conducted during the rainy season in 2013: (a) 25 June–14 July (b) and 21 August–7 September. The circles are drawn to scale from the number of BPH collected at each location, and shading is used to indicate the relative proportions of BPH life stage (adult or nymph), sex, and wing form, as indicated in the legend.

Number of BPHs collected in the main rice-producing area, grouped by morphotype.

1 Morphotype was grouped according to the sex, wing form, and life stage (adult or nymph).
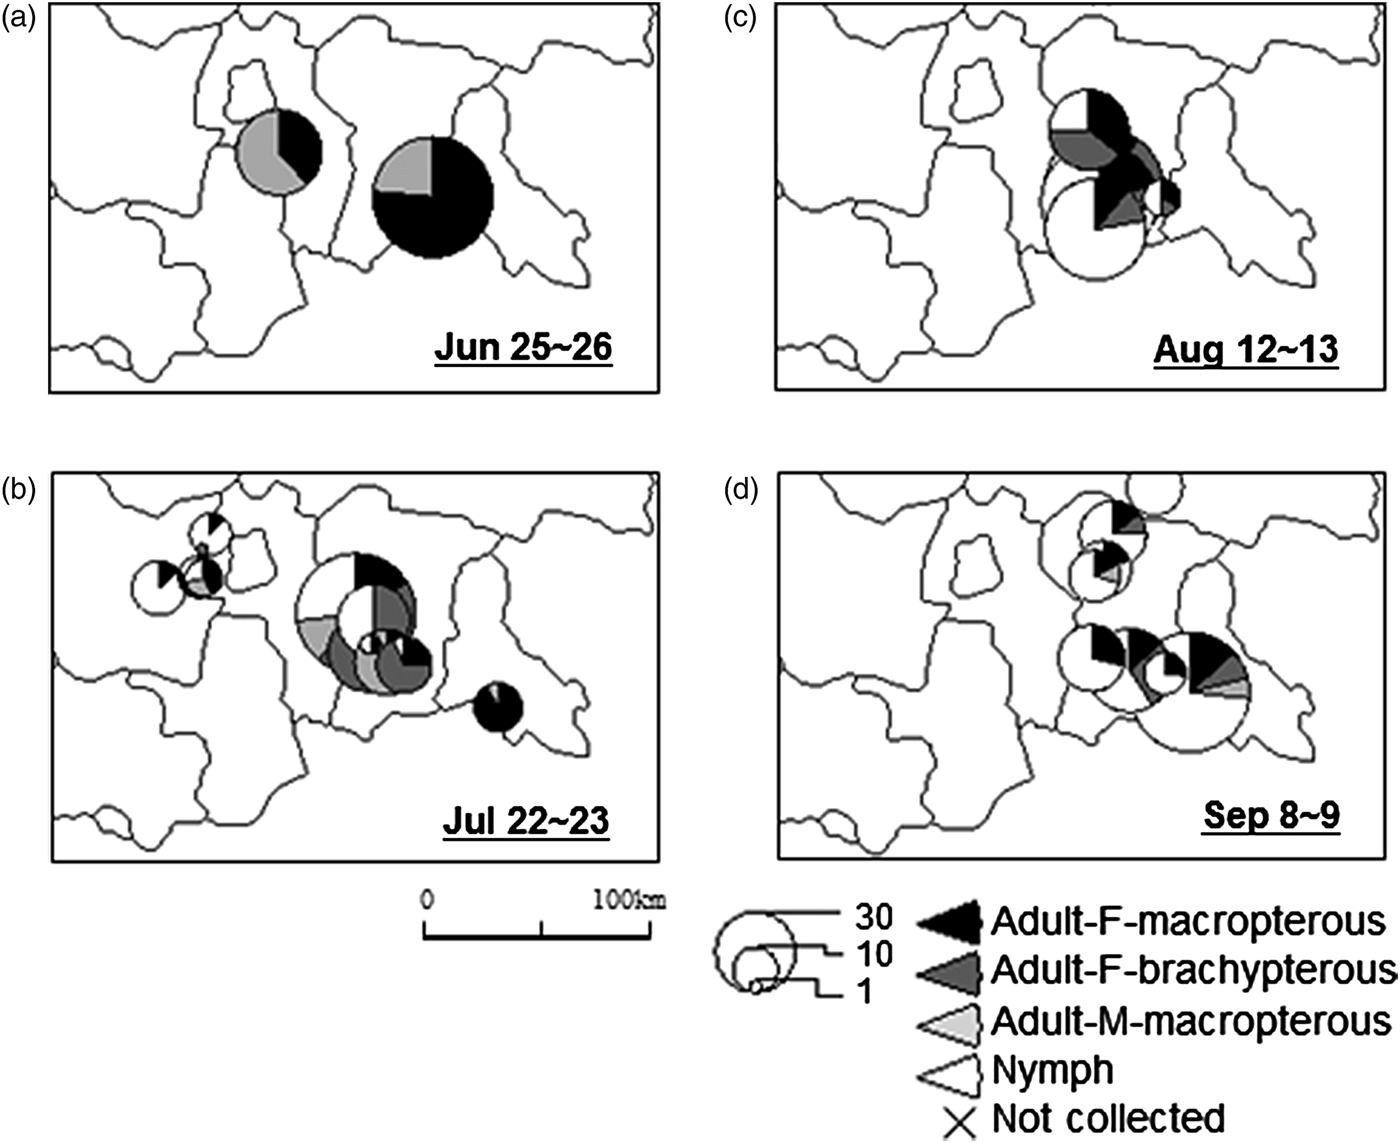
Particularly in the southern provinces of Cambodia, near the border with Vietnam, the collected individuals were primarily composed of macropterous forms in late June (fig. 4a, table 3). In three consecutive samplings, the percentage of brachypterous forms and nymphs became gradually higher than the first sampling (fig. 4b–d; table 3), although ‘hopperburn’ was not observed in any fields. The results showed that approximately 1 month was necessary to complete a single generation, and the occurrence of three generations was observed during the 2½ months after the peak in late June if the population was considered to be migrants. From these results, we used the specimens to compare local population differences genetically in the period when abundance of BPH was the highest in August.
Enlargement of Fig. 3 with a special focus on southern Cambodia, involving Svay Rieng, Prey Veng, and Kandal Provinces. Samplings were conducted during the rainy season: (a) 25–26 June, (b) 22–23 July, (c) 12–13 August, and (d) 8–9 September 2013. The size of the circles indicates the number of BPH collected at each location, and shading is used to indicate the relative proportions of BPH life stage (adult or nymph), gender, and wing form, as indicated in the legend.

Total numbers of BPHs collected from fields at each sampling in areas near the Cambodia/Vietnam border.

1 Morphotype was grouped according to the sex, wing form, and life stage (adult or nymph).
Regional population genetic differences in Cambodia
Genotypic-by-sequencing
From the two sequencing runs with the BPH specimens from the three locations, the total number of high-quality reads that included both barcodes and the PstI site was 36,178,288 (from 38,673,119 raw reads), representing 41 individuals, and the number of reads for each individual ranged from 356,123 to 1,147,580. Among them, 32,128,399 reads were matched to the BPH reference sequence (83.1%) (Xue et al., Reference Xue, Zhou, Zhang, Yu, Fan, Wang, Xu, Xi, Zhu, Zhou, Pan, Li, Colbourne, Noda, Suetsugu, Kobayashi, Zheng, Liu, Zhang, Liu, Luo, Fang, Chen, Zhan, Lv, Cai, Wang, Huang, Cheng, Zhang, Lou, Yu, Zhuo, Ye, Zhang, Shen, Yang, Wang, Wang, Bao and Cheng2014). In addition, 406,691 tags were identified, of which 183,486 aligned to unique positions (45.1%), 124,740 aligned to multiple positions (30.7%), and 98,465 could not be aligned (24.2%). The unfiltered number of SNPs was 100,744 SNPs, and finally 2455 SNPs were identified from each of specimens after filtering.
Genetic variation
The observed heterozygosity (H o) of each population was 0.30867, 0.27085, and 0.27459; and expected heterozygosity (H e) was 0.28225, 0.26192, and 0.27376 in BB, SR, and TK, respectively. To examine the differentiation among the BPH collected from three locations, the fixation index (Fst) across all three populations was calculated from the 2455 identified SNPs using Genepop. The Fst value among the three locations (Fst = 0.0451) indicated a low degree of differentiation. Pairwise Fst values showed relatively higher degree of differentiation between the BB and SR populations (Fst = 0.0501) and between the BB and TK populations (Fst = 0.0580) than between the SR and TK populations (Fst = 0.0254), although the three populations seemed to share ancestry and appeared to be mixed. The result implied that temporal separation of the populations occurs most notably between the SR/TK populations and the BB population.
Population genetic structure
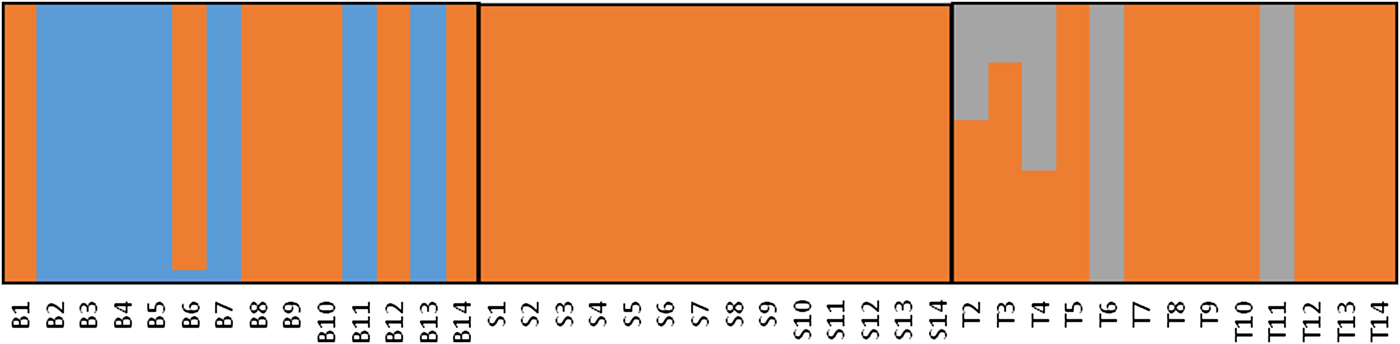
To further determine the differentiation of the SR, TK, and BB populations, individual samples were placed into estimated clusters, based on the 2455 SNPs using fastSTRUCTURE. The value of K with the highest log likelihood was adopted as the optimal number of clusters, which was estimated to be K = 3. The largest cluster included all individuals from SR and approximately half of the individuals from BB and TK. Half of the individuals from BB and two from TK formed clusters unique to their respective populations (fig. 5).
Population structure of brown planthopper (BPH) from three sampling locations in Cambodia. fastSTRUCTURE analysis was performed based on 2455 SNPs, and the most likely K was determined to be 3 (K = 3). Vertical line shows each individual from three sampling locations: BB, Battambang; SR, Svay Rieng; TK, Takeo Provinces, Cambodia.

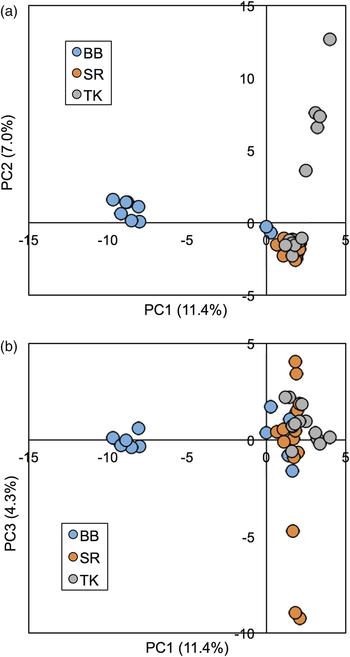
A PCA was conducted to clarify the relationships between the individual samples and among the three locations. The percentages of the variance, explained by the principle components (PC1, PC2, and PC3), were 11.4, 7, and 4.3%, respectively, and they accounted for 22.7% of the variance together. As seen in fig. 6a, PC1 separated half of the individuals from BB from the remaining BB individuals and those from both SR and TK, and PC2 separated part of the BB and TK populations from the main group. A similar trend was observed in the plot of PC1 and PC3 (fig. 6b). The individuals grouped according to PC1 formed a main group that included most of the samples and a small group that contained a portion of the BB samples, whereas PC3 showed another small group of SR individuals. These between-population differences were in accordance with the results of both the Fst and the fastSTRUCTURE analyses.
Principle component analysis (PCA) of the three sampling locations in Cambodia. PCA of brown planthopper (BPH) from the three sampling regions was conducted using identified SNP information (2455 SNPs). Percentages in parentheses indicated the amount of variation explained by each principal component (PC). Sampling locations: BB, Battambang Province; SR, Svay Rieng Province; TK, Takeo Province, Cambodia.

Discussion
This study is the first report that investigated the possibility of regional populations of BPH in Cambodia, where the related studies are limited. We investigated the different timing of BPH emergence in southern and northwestern part of Cambodia, and the number of BPH is higher in the south in August. Moreover, it was shown that GBS could provide us SNP information of BPH, and this SNP pattern clarified the difference of regional BPH populations. GBS techniques provided useful DNA information to clarify the genetic differentiation in small regional populations. The regional differences of emergence, amount, and genetic characteristic in south and northwest Cambodia might be influenced by the occurrence of BPH in the neighboring countries, in particular, the Mekong Delta of south Vietnam. The previous study showed that the damage by BPH occurred during the same period in the area nearby the Vietnam border in Cambodia, while the serious disaster has been reported in Mekong Delta of Vietnam (Heong & Escalada, Reference Heong and Escalada2008; Ho, Reference Ho2013; Matsukawa et al., Reference Matsukawa, Ito, Kawakita and Tanaka2014). In fact, at the end of June corresponding to the time of sowing or seedling stage of rainy season cropping (Nesbitt & Phaloeun, Reference Nesbitt, Phaloeun and Nesbitt1997), macropterous forms were mainly collected in the south of Cambodia (fig. 3a; table 2). During this period, in the northern Mekong Delta of Vietnam, which is near the Cambodian border, heading stage with fully visible panicle may occur in winter–spring cropping (Otuka et al., Reference Otuka, Sakamoto, Chien, Matsumura and Sanada-Morimura2014). Macropterous forms takeoff from the rice field at harvesting stage (Otuka et al., Reference Otuka, Sakamoto, Chien, Matsumura and Sanada-Morimura2014), implying that BPH migrates at the time of harvest from the fields of Vietnam to the fields in south part of Cambodia during the sowing period.
In northwest part of Cambodia, the late emergence and small number of occurrence was observed comparing with that of the south (fig. 3). Additionally, the genetic analysis implies a possibility of another regional population (fig. 5 and 6). Although the level of differentiation was low among three populations, similar with the report of mitochondrial DNA (Matsumoto et al., Reference Matsumoto, Matsumura, Sanada-Morimura, Hirai, Sato and Noda2013), SNP analysis revealed that the genetic admixture may occur between SR and TK, corresponding that these two locations were geographically closer to each other than that of BB (fig. 1). Distance of BPH migration had been estimated 6–30 km in the Philippines (Riley et al., Reference Riley, Reynolds and Farrow1987). Otuka et al. (Reference Otuka, Sakamoto, Chien, Matsumura and Sanada-Morimura2014) reported that the maximum flight distance seemed to be within 100 km in Mekong Delta of Vietnam. Hence, it is unlikely that population in south Cambodia move to northwest part of the country (about 360 km distance between SR and BB) within a short period. A limited rice cultivation area of dry season in central/northwest part (National Institute of Statistics, 2012) might also cause them abide in the region. However, the infestation by BPH was expanded to the central part of the country during the outbreak (Matsukawa et al., Reference Matsukawa, Ito, Kawakita and Tanaka2014). They indicate that each regional population was not completely isolated, and that their mixture could occur, especially during an outbreak even in 2007–2009 (Matsukawa et al., Reference Matsukawa, Ito, Kawakita and Tanaka2014).
Although it is still necessary to investigate BPH populations on more seasonal basis, in higher abundance, and in a wide range of Southeast Asia (e.g. neighboring countries Vietnam, Thailand, and Laos), this study demonstrated the possible population differences in south and northwest Cambodia, and highlights the molecular techniques available to pinpoint population differences in BPH. This information could be useful to establish a management system for BPH in entire Southeast Asia in the future.
Supplementary Material
The supplementary material for this article can be found at https://doi.org/10.1017/S0007485317000992.
Acknowledgements
The authors thank Dr Ngo Bunthan, Dr Seng Mom, and Dr Chay Chim for signing the material transfer agreement between Cambodia Royal University of Agriculture and Graduate School of Bioagricultural Sciences, Nagoya University. Materials were imported from Cambodia with the permission system of the Minister of Agriculture, Forestry and Fisheries, Japan, after obtaining the permission from General Directorate of Agriculture, Cambodia, based on the Material Transfer Agreement. The authors acknowledge the assistance and useful information of Dr Preap Visarto, Mr Nign Chhay (General Directorate of Agriculture), the officials of the Provincial Department of Agriculture in Battambang, Takeo, Svay Rieng, Prey Veng, Kampong Cham, Kampong Thom, Kampong Chhnang, Banteay Meanchey, and Siem Reap Provinces in Cambodia and Dr Ho Van Chien (the Southern Regional Protection Center in Vietnam). The authors also thank Dr Kazuki Kurita (Kyoto University) for critical advice on population analyses. This study was partially funded by the Japan Society for the Promotion of Science (KAKENHI Grant Number 14J03722).