INTRODUCTION
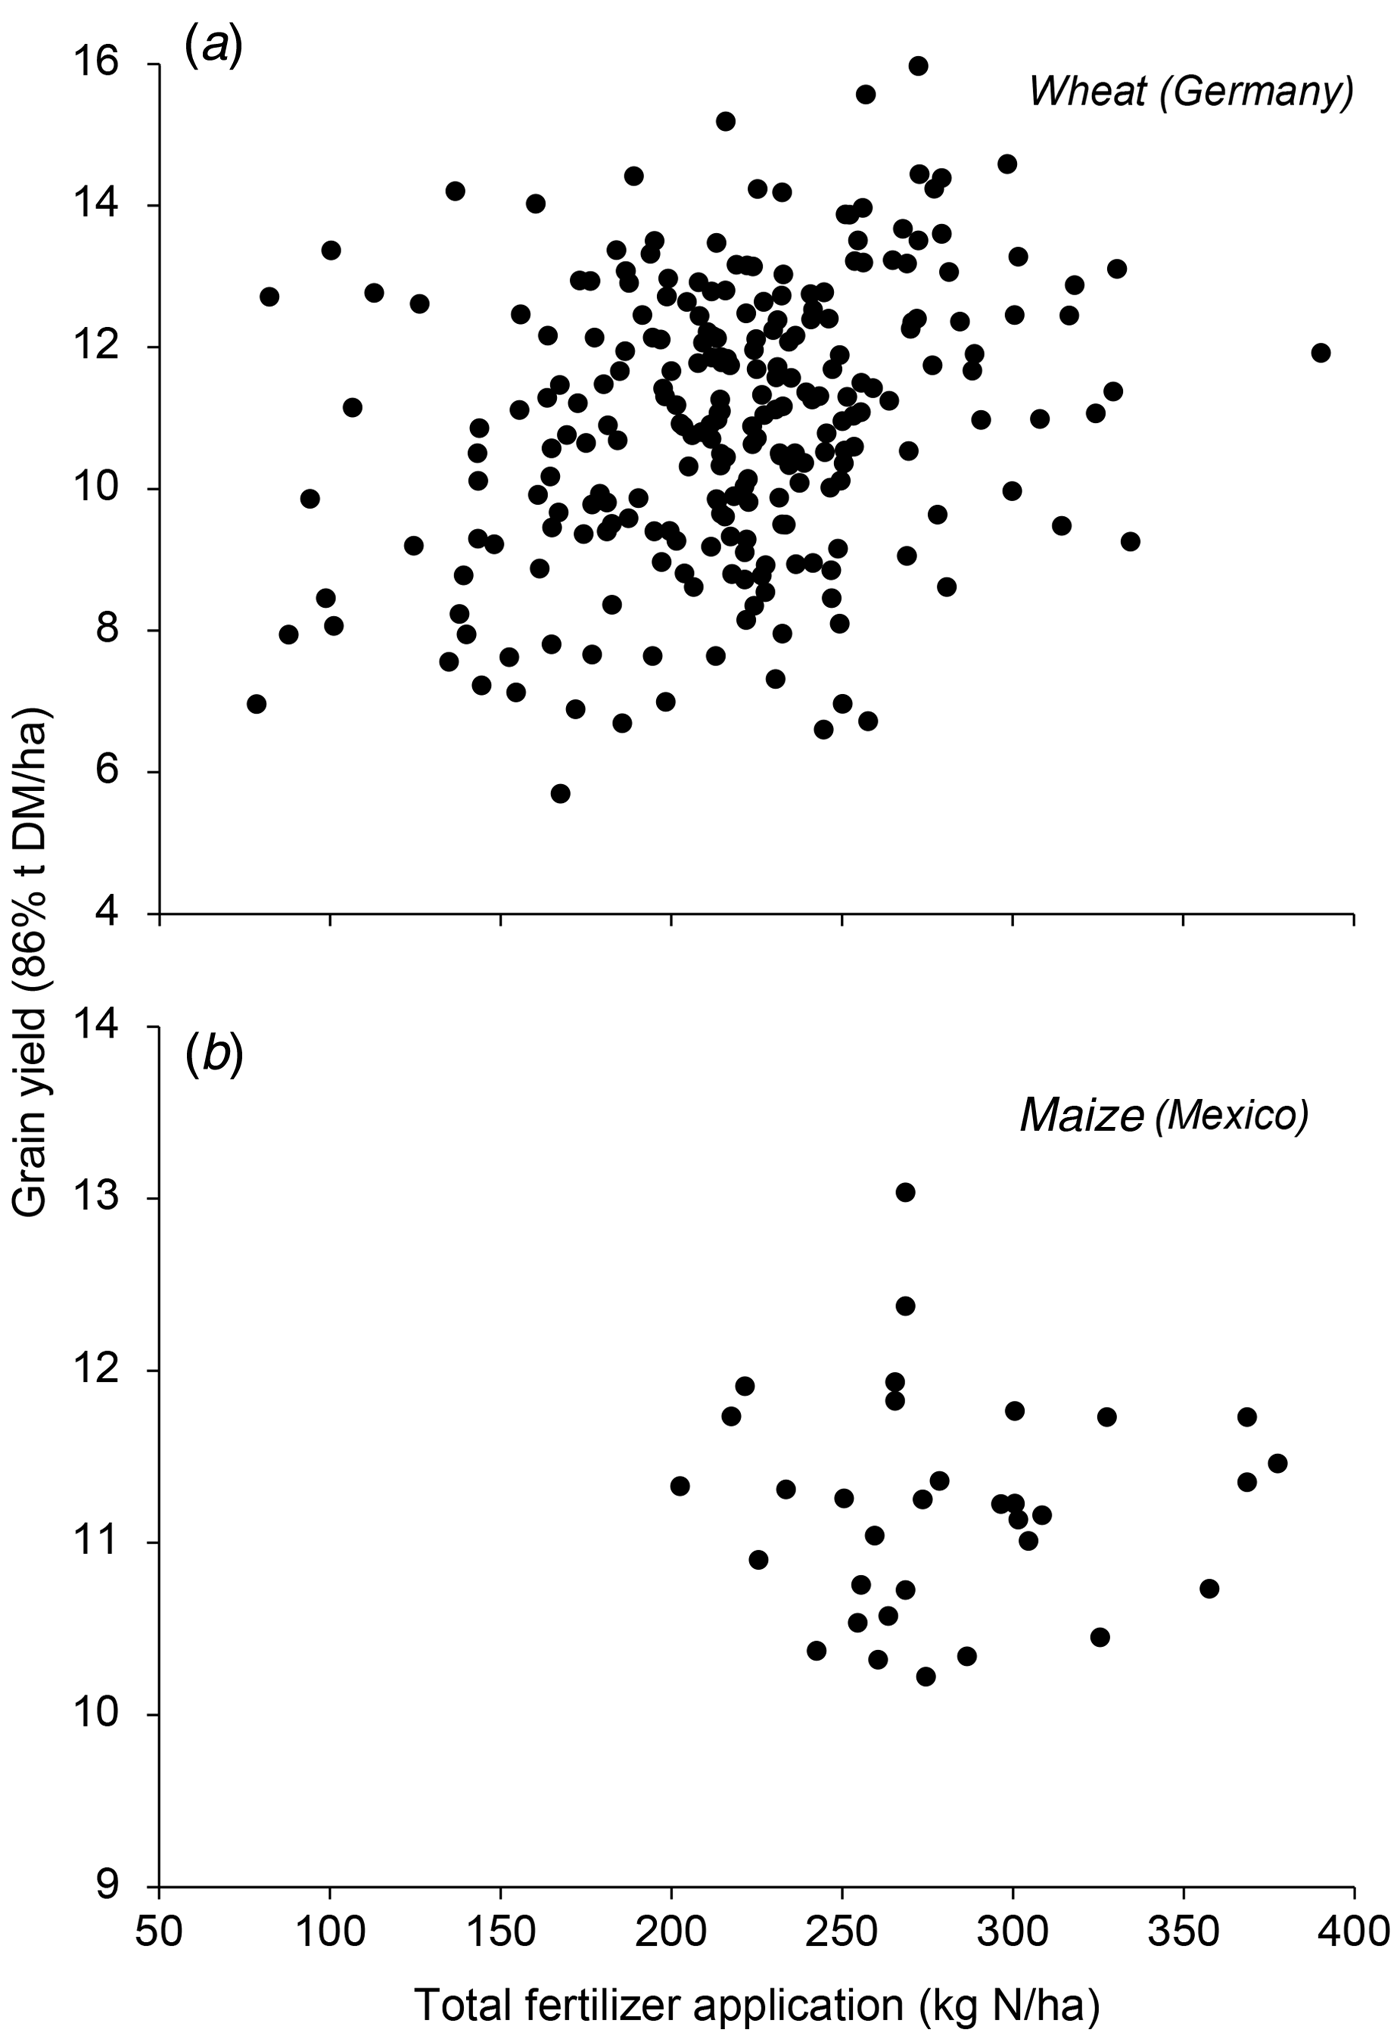
The recovery of applied fertilizer nitrogen (N) in maize ranges globally from about 0·35 to 0·65 (Cassman et al. Reference Cassman, Dobermann and Walters2002; Dobermann Reference Dobermann2007; Cantarella & Montezano Reference Cantarella, Montezano, Prochnow, Casarin and Stipp2010). In the tropics and sub-tropics, many growers still decide how much N to apply based on soil tests and/or pre-set fertilizer rates based on yield expectations for an entire region (Espinosa & García Reference Espinosa and García2009). Both annual and long-term trials have shown that in maize the fertilizer N rate, namely the economic optimum rate (Nopt), varies considerably between field sites and years, even for the same yield level. This confirms that there is no direct (a priori) relationship between fertilizer N rate and yield (Lory & Scharf Reference Lory and Scharf2003; Raun et al. Reference Raun, Solie, Stone, Martin, Freeman, Mullen, Zhang, Schepers and Johnson2005; Varvel et al. Reference Varvel, Wilhelm, Shanahan and Schepers2007). In cereal production in Western Europe, e.g. Germany, the lack of such a relationship between the optimum fertilizer N rate and wheat grain yield has long been known (Fig. 1(a)). A survey of farmer fields in the central lowlands (‘Bajío’) of Mexico also confirms, this is the case for maize in sub-tropical conditions (Fig. 1(b)). Thus, identification and application of the optimum fertilizer N rate represents a recurring challenge for farmers.
Grain yields as related to fertilizer nitrogen (N) application at experimental sites and farmer fields. (a) Wheat grain yield at economic optimum N rates (Nopt) in 248 field trials throughout Germany from 1996 to 2013 (Source: trials carried out by Research Centre Hanninghof, Yara International ASA). (b) Maize grain yields as related to common fertilizer N application in 33 farmer's fields during the 2011 season around Celaya city, located in the central region of Mexico (Source: INIFAP-Celaya).

Crop-based fertilizer management should account for the annual variability in soil and climatic conditions that affect crop growth and final yield (Torres-Dorante & Link Reference Torres-Dorante and Link2010). Tools to monitor crop N status are used to support fertilizer management aiming at increasing N use efficiency and crop productivity as they can predict actual N needs and allow in-season adjustments (Piekkielek & Fox Reference Piekkielek and Fox1992; Scharf Reference Scharf2001; Scharf et al. Reference Scharf, Brouder and Hoeft2006; Varvel et al. Reference Varvel, Wilhelm, Shanahan and Schepers2007; Ziadi et al. Reference Ziadi, Brassard, Bélanger, Claessens, Tremblay, Cambouris, Nolin and Parent2008). It has been shown that leaf chlorophyll concentration correlates positively with leaf N content. This suggests that chlorophyll measurements (CMs) can be used as an indicator of N status in several crops, e.g. wheat, potato and rice (Takebe & Yoneyama Reference Takebe and Yoneyama1989; Wood et al. Reference Wood, Reeves and Himelrick1993; Gianquinto et al. Reference Gianquinto, Goffart, Olivier, Guarda, Colauzzi, Dalla Costa, Delle Vedove, Vos and Mackerron2004), and also in maize (Markwell et al. Reference Markwell, Osterman and Mitchell1995; Chapman & Barreto Reference Chapman and Barreto1997; Bullock & Anderson Reference Bullock and Anderson1998; Rashid et al. Reference Rashid, Voroney and Parkin2005). Several hand-held devices are available which assess chlorophyll concentrations in plant tissues based on leaf light transmittance measurements, such as the CCM-200 plus (Apogee Instruments, USA), SPAD-502 (Konica-Minolta, Japan) and the N-Tester™ (Yara International ASA, Norway). Both the SPAD-502 and N-Tester (NT) devices are manufactured by Konica–Minolta. They measure the light transmittance between red (650 nm) and near-infrared (940 nm) chlorophyll absorption ranges using the same technical principles to generate 2- and 3-digit dimensionless values, respectively. The light transmission through the leaf is correlated with its greenness, providing a good estimate of the chlorophyll concentration (Markwell et al. Reference Markwell, Osterman and Mitchell1995). In order to convert NT into SPAD values, the following formula can be used: SPAD value = [(NT value + 90)/15] (Yara International ASA, Norway).
Crop monitoring technologies that measure crop canopy reflectance using remote sensing are being promoted as they account very well for biomass development and phenotypical parameters as well as in-field variability (Lammel et al. Reference Lammel, Wollring, Reusch, Horst, Schenk, Buerkert, Claassen, Flessa, Frommer, Goldbach, Olfs, Roemheld, Sattelmacher, Schmidhalter, Schubert, Wiren and Wittenmayer2001; Samborski et al. Reference Samborski, Tremblay and Fallon2009). However, the use of hand-held chlorophyll meters is still appealing, in particular because measurements can be carried out rapidly, in non-destructive ways and with easy-to-use devices. Leaf CMs are not often used directly to draw conclusions on crop N demand because of the influence of soil N availability, water supply, growth stage and cultivar type on chlorophyll readings. A method to account for variations other than N is based on data normalization such as well-fertilized N plot, no N reference plot or relative yield. This information has served to develop sufficiency/nutrition indices which in turn are related to chlorophyll readings (direct or relative) and/or fertilizer N rate for assessing whether additional N is needed (Scharf et al. Reference Scharf, Brouder and Hoeft2006; Samborski et al. Reference Samborski, Tremblay and Fallon2009) or for attempting to derive the amount of N to be applied (Varvel et al. Reference Varvel, Wilhelm, Shanahan and Schepers2007). The reference plot has to be established every time a fertilizer N application is to be done with the challenge of selecting the right location to set it up.
Reviews on crop N sensing technologies have highlighted key issues for final acceptance and implementation by farmers. Some of these refer to the practicability of use, which should be close to common local farm practices (Olfs Reference Olfs2009; Samborski et al. Reference Samborski, Tremblay and Fallon2009). The direct use of CMs without requiring a reference plot to derive fertilizer N rates could be a convenient option to improve fertilizer N management, particularly for small- and medium-scale maize farming systems. Both direct and normalized CMs have been correlated with Nopt and also grain yields. Scharf (Reference Scharf2001) found CM and side-dressed N rates to be significantly and linearly correlated. Similarly, Rashid et al. (Reference Rashid, Voroney and Parkin2005) found significant linear relationships between CM and the economic N rates. Further research carried out by Scharf et al. (Reference Scharf, Brouder and Hoeft2006) showed that direct CM (without normalization) could predict Nopt, particularly in soils with low N available to plants. However, it is often generalized that normalized CM is a better predictor of the optimum fertilizer N rate (Nopt) (Scharf et al. Reference Scharf, Brouder and Hoeft2006; Zhang et al. Reference Zhang, Blackmer, Ellsworth and Koehler2008; Ziadi et al. Reference Ziadi, Brassard, Bélanger, Claessens, Tremblay, Cambouris, Nolin and Parent2008). Some fertilizer N recommendation systems for wheat production in Western Europe are based on direct CM and have been shown to predict fertilizer N needs very well while increasing N use efficiency (Olfs et al. Reference Olfs, Blankenau, Brentrup, Jasper, Link and Lammel2005). This approach, however, is variety-specific and thus requires correction factors, which are updated annually as look-up tables. Alternatively, nowadays such updates can be uploaded into the chlorophyll meter's software.
There are no reports describing how to develop and calibrate algorithms using direct CM in order to assess the fertilizer N to be applied, or how to account for cultivar-related differences in greenness. The present paper describes a method and frame-work to develop algorithms using CM to predict economically optimal top-dressing fertilizer N rates (Nopt) for maize grain production, without requiring reference plots (without normalization). The specific objectives of the research were: (1) to evaluate the influence of fertilizer N supply at planting on chlorophyll concentrations at a key growth stage for fertilizer application in maize, namely the 7th leaf stage (GS 17, Zadoks et al. Reference Zadoks, Chang and Konzak1974); (2) to establish maize grain yield response curves to increasing fertilizer N supply in order to calculate Nopt; (3) to assess the relationship between chlorophyll concentrations and top-dressing Nopt at GS 17; (4) to evaluate the ability of an algorithm to predict a top-dressing Nopt within an adapted fertilizer recommendation system to local conditions; and (5) to assess cultivar-related differences in greenness and the development of correction factors.
MATERIALS AND METHODS
Sites and maize production system
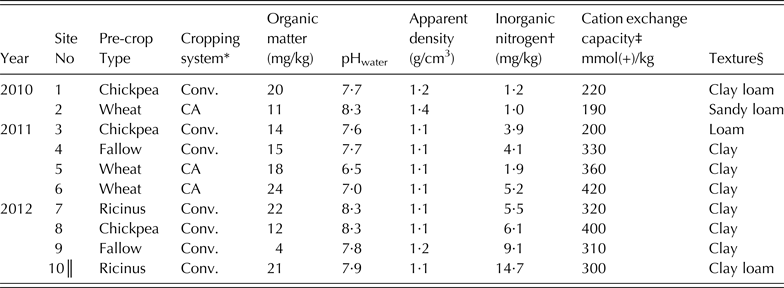
Field experiments were carried out in the lowlands (‘Bajío’) of central Mexico across the districts of Celaya, Valle de Santiago and Pénjamo located in the state of Guanajuato, and in José Sixto Verduzco in the state of Michoacán. In total, ten field experiments were established: in 2010 (two trials), 2011 (four trials) and 2012 (four trials). The trials were carried out at the experimental research station of the National Research Institute for Forestry, Agriculture and Animal Production (INIFAP-Celaya), located close by Celaya city (Guanajuato State) as well as on local farms. The sites were representative of both conventional and conservation tillage systems that are common for maize production in the region (Table 1). The soils were vertisols (IUSS Working Group WRB 2006) with a relatively high pH (with variable calcium-carbonate contents), no salinity problems and naturally occurring high potassium levels. Accumulated precipitation during the cropping periods (from May to October) ranged from 600 to 800 mm. Supplemental irrigation was applied during sowing to ensure uniform crop establishment, and about 40–50 and 100 days after crop emergence depending on rainfall pattern and amount. In the Mexican central region, rain-fed maize with or without supplemental irrigation commonly receives part of the N supply (half of total estimated rate) at planting. The rest of the N fertilizer requirement is top-dressed at about GS 14–17.
Site information and selected soil physical and chemical data (soil sampling depth 0–30 cm). Site locations were from 20°17′ N to 20°35′ N and from 100°25′ W to 101°49′W, and elevations ranged from 1700 to 1770 m asl
* Conv.: conventional tillage including discing, ploughing and levelling. CA: Conservation agriculture including minimum soil tillage, as well as soil cover and residue management.
† Potassium chloride (2 N) extraction.
‡ Ammonium-acetate (pH 7) extraction.
§ USDA Soil Taxonomy.
║ Site for developing greenness-related variety correction factors.
Fertilizer nitrogen treatments and experimental design
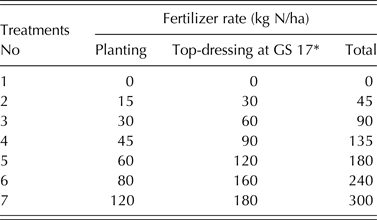
The experiments included seven treatments with increasing total fertilizer N application rates ranging from 0 to 300 kg/ha. The total N supply was split into two applications: one application at planting, and a top-dressing at GS 17 (Table 2). The application rates at planting increased from 0 to 120 kg N/ha, enabling the influence of the initial amount of N supplied on greenness at GS 17 to be studied. The top-dressing applications were also increased to supply the remainder of the total N input (planting + top-dressing), with the objective of generating maize grain yield response curves that would allow the calculation of optimum N rates (Nopt). The present study targeted Nopt because it represents the rate that gives the highest net financial return, taking into account crop (US$/kg maize grain) and fertilizer (US$/kg N) prices. The Nopt was calculated using average fertilizer and grain prices during the 3 years of the study, representing a fertilizer to grain price ratio of 5·9 US$/kg.
Fertilizer N treatments: nitrogen application rates and timing
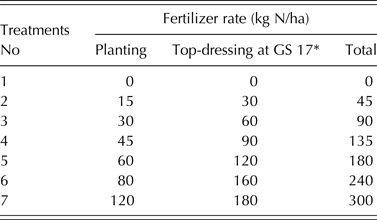
Nitrogen source: Calcium ammonium nitrate (27% N, 4% MgO, 6% CaO). *Growth stage according to the Zadoks scale (Zadoks et al. Reference Zadoks, Chang and Konzak1974).
The treatments were organized in complete randomized blocks design with four replications at sites 1–3 and three at sites 4–9 (Table 1). One single maize (Zea mays L.) variety was used throughout all experiments, namely Jabali. The experimental plots consisted of eight rows of 10 m length with inter-row spacing of 0·75 or 0·80 cm, resulting in population densities between 65 000 and 90 000 plants/ha. Leaf chlorophyll concentrations were measured using the N-Tester™ at GS 17. This device generates an average 3-digit output value only after computing 30 valid measurements. The readings were taken mid-way between the stalk and the leaf tip (and mid-way between the midrib and leaf margin) on plants randomly selected from the two central rows of each experimental plot. Maize grain was harvested manually from all plants within 8 m of the two central rows (16 m in total) of each experimental plot at physiological maturity. Grain yield was adjusted to 14% moisture content.
The N source used was calcium ammonium nitrate (0·27 total N, of which half was NO3−-N and half was NH4+-N) which also contained 0·04 magnesium oxide (MgO) and 0·06 calcium oxide (CaO) on a w/w basis. The experimental area received other macronutrients in quantities sufficient to prevent any nutrient limitations by applying 60 kg of phosphorus (P2O5), 50 kg of potassium (K2O) and 25 kg of magnesium (MgO) per ha applied at planting. The fertilizer sources used were triple superphosphate, potassium chloride and potassium magnesium sulphate. Micronutrients such as iron and zinc were provided via foliar application when considered necessary during GS 13–15. The application of N, phosphorus, potassium and magnesium at planting was banded at 5 cm below the seeds. The top-dressing fertilizer N application was done by banding it on the surface at 20 cm from the rows, either at GS 17 or at the latest 2 days after carrying out the CM.
Agronomic performance of the fertilizer nitrogen recommendation supported by algorithms
In 2011 and 2012, an additional treatment was included at each site in order to assess the ability of the proposed algorithm to predict the top-dressing economic optimum N rates (Nopt). This treatment was included with the other seven fertilizer N treatments in the complete randomized block design with three or four replications. In 2011, this treatment consisted of an application of 45 kg N/ha at planting, and the top-dressing fertilizer N rate was derived from CMs using an algorithm developed in 2010. In 2012, an amount of 80 kg N/ha was applied at planting, and the top-dressing fertilizer N rate was derived from CM using an algorithm integrating data from both 2010 and 2011. The agronomic performance was assessed by comparing attained maize grain yields, the partial factor of productivity (kg maize grain/kg fertilizer N applied) and the agronomic fertilizer N efficiency (kg grain increase/kg N applied) against the same parameters at Nopt calculated from grain yield response trials to increasing N application.
Field assessment to develop correction factors for cultivar-related differences in greenness
An additional test field was established in 2012 at INIFAP-Celaya experimental research station to assess specific-cultivar differences in greenness (Table 1, Site 10). For this, the 21 most widely used commercial cultivars in the region were grown, including the reference variety Jabali (used in the calibration trials). The plants were grown in randomized 2-replicated plots (eight rows of 10 m length) and were managed according to the best pest and disease control practices as well as receiving sufficient macro- and micro-nutrients to prevent nutrition-related growth limitation. Fertilizer sources used were the same as for the calibration trials. Chlorophyll measurements were also carried out in the same way as in the calibration trials: readings were taken at GS 17, mid-way between the stalk and leaf tip (and mid-way between the midrib and leaf margin) on plants randomly selected from the two central rows of each experimental plot.
Statistical analysis
Statistical procedures included analysis of variance (ANOVA) and comparisons of means and were carried out using statistical software STATGRAPHICS Centurion XV, version 15.2.06 (Statpoint Inc,). One-way or multifactor ANOVA for chlorophyll concentration or grain yield were carried out for every site and year and corresponding interactions. The factors were fertilizer N rate at planting, total fertilizer N rate, year and/or site. The ‘Least Significant Difference’ procedure (Fisher's test) at 95% confidence level was used for comparing means whenever differences were significant (P < 0·05). Regressions analyses were performed using statistical software SigmaPlot version 11.0 (Systat Software Inc). In order to evaluate slope, intercept and interaction significances among linear regressions, analysis of covariance (ANCOVA was performed with the statistical software R (R Core Team 2013) using lm () and aov () functions.
RESULTS
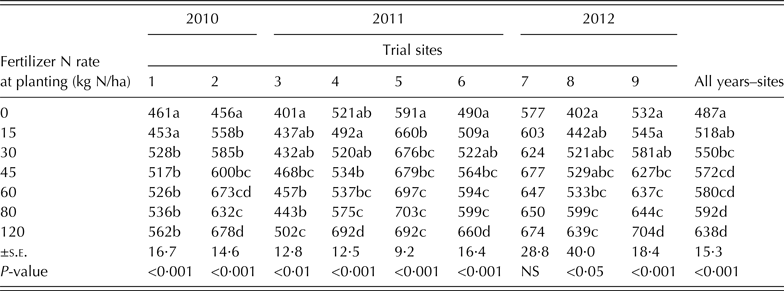
The CM at maize GS 17 increased significantly (P < 0·001) with increasing fertilizer N rate at planting, except for site 7 (Table 3). The interaction between sites and fertilizer N supply on CM was significant whereas the interaction between fertilizer N supply and year was not. The CM in control plots (without N) varied among fields and ranged from c. 400 to 600 NT units. Differences in CM between the control and fertilizer N supply treatments ranged from c. 100 to 240 NT units. The CM did not exceed the 700 NT units being achieved at fertilizer N rates at planting of c. 80–120 kg N/ha. The grouped data (site–year) ANOVA showed a highly significant effect (P < 0·001) of fertilizer N supplied at planting on the CM at GS 17, and the CM tended to level out after application of 45 N/ha. Higher fertilizer N rates did not result in significant increments in CM.
Chlorophyll measurement (N-Tester™ units) for maize (cvar Jabali) GS 17 as related to fertilizer N application at planting. Field trials were carried out in 2010, 2011 and 2012 in the central region of Mexico. Sites 1, 3, 4, 7, 8 and 2, 5, 6, 9 located at experimental station and at farmer fields, respectively. Values are means of n = 4 (sites 1–3) or 3 (sites 4–9)
For each site, means followed by same later are not significantly different at 95% confidence level of the Fisher's test. NS = Not significant (P > 0·05). s.e. = Standard error of the mean.
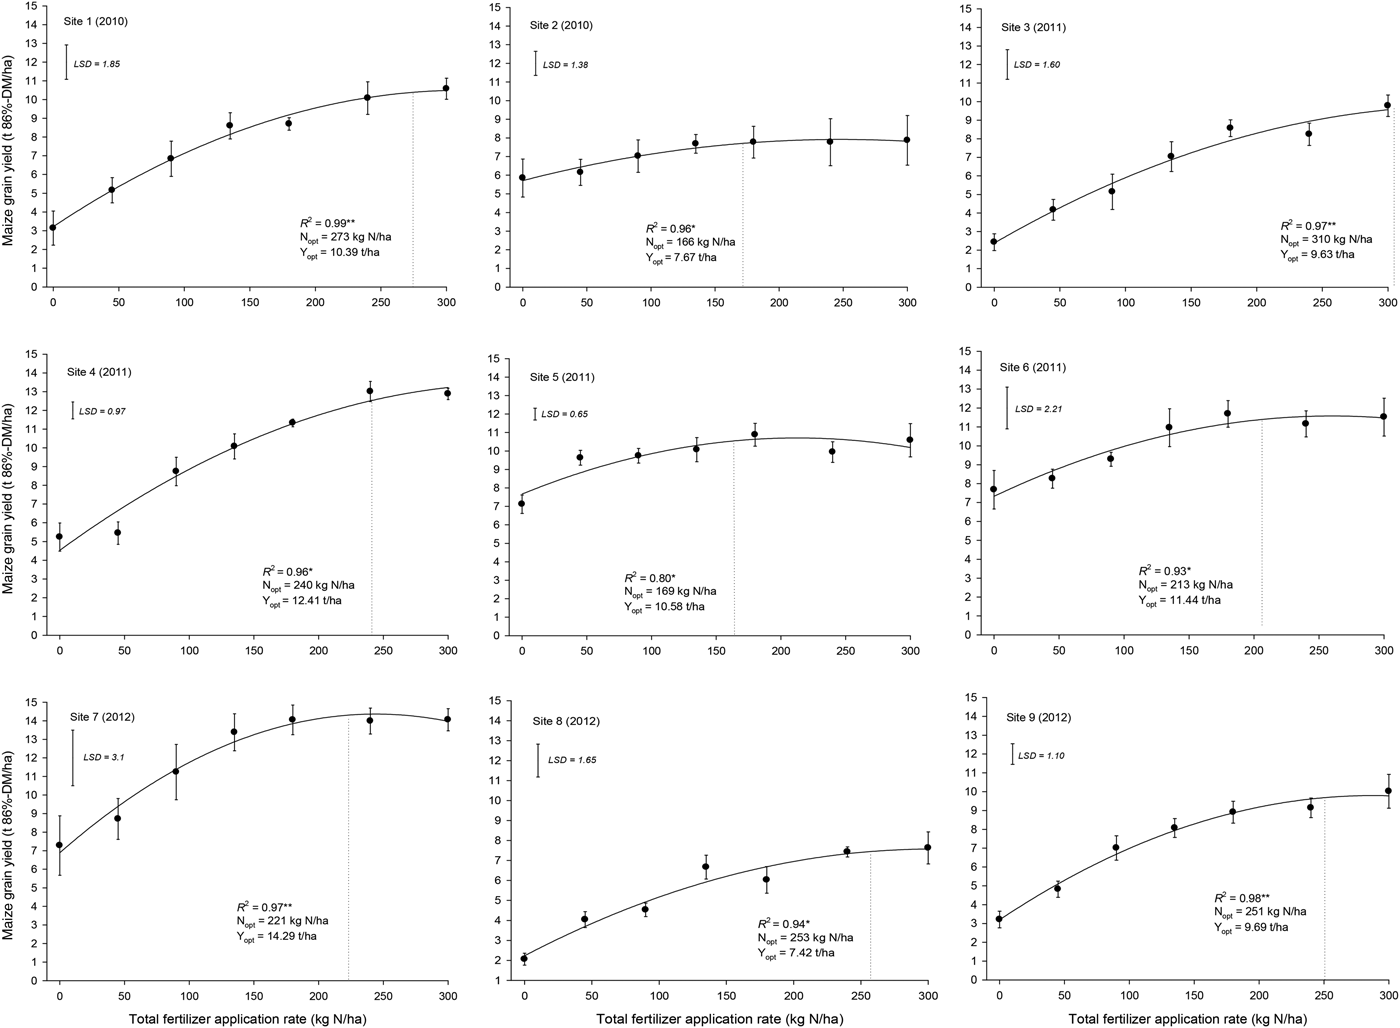
Grain yields responded to fertilizer N application. At all sites and years, grain yield increased significantly with increasing total fertilizer N supply (Fig. 2). Maize grain yield increased to a maximum and decreased thereafter as a consequence of N oversupply. At all sites, grain yield responses fitted quadratic regressions very well (R 2 = 0·80–0·99), allowing the optimum N rates (Nopt) to be calculated. The Nopt ranged from c. 160 to 300 kg N/ha and yields at Nopt ranged from c. 7·7 to 14 t/ha. The sites under conventional management (1, 3, 4, 7, 8 and 9), in particular, showed a strong response to increasing fertilizer N supply. At these sites, grain yield differences between the control treatment (without N) and Nopt ranged between c. 5·5 and 7 t/ha. Sites under conservation management (sites 2, 5 and 6) showed a weaker grain yield response and lower Nopt compared with conventional ones, although yields were at comparable levels and grain yield differences between the control treatment (without N) and at Nopt ranged from c. 1·7 to 3·9 t/ha.
Maize (cvar Jabali) grain yield responses to fertilizer nitrogen (N) application in field experiments carried out from 2010 to 2012 in the central region of Mexico. Sites 1, 3, 4, 7, 8 and 2, 5, 6, 9 located at the experimental station and at farmer fields, respectively. Nopt = calculated economic optimum fertilizer N rate. Yopt = grain yield at calculated Nopt. P levels <0·01 and 0·05 indicated by ** and * respectively. LSD = Least Significant Difference of Fisher's test at 95% confidence level. Values are means of n = 4 (sites 1–3) or 3 (sites 4–9).
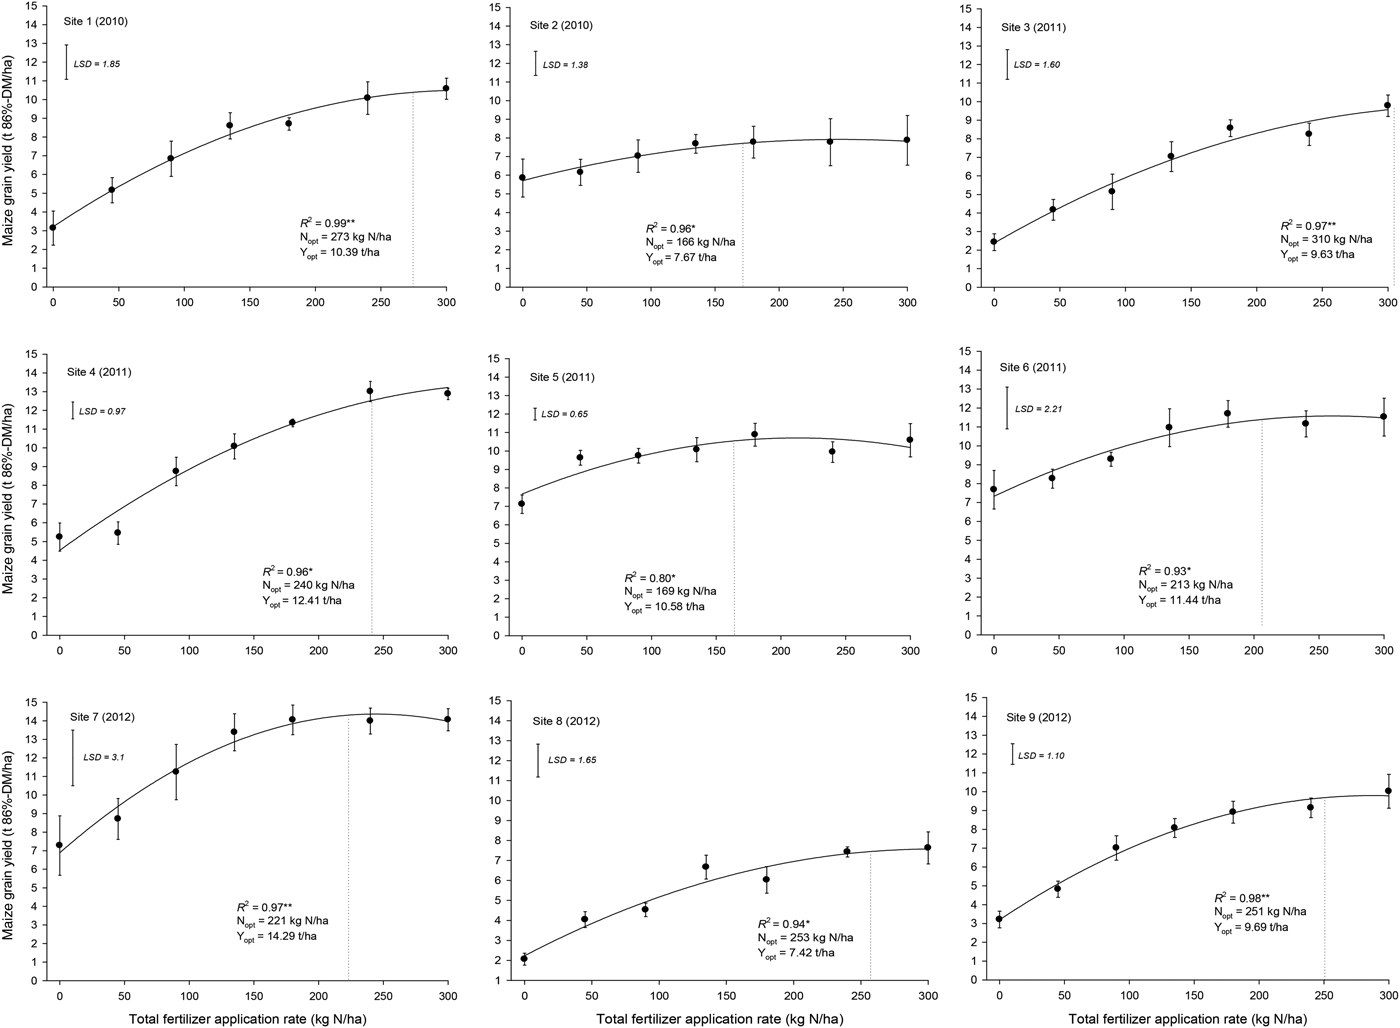
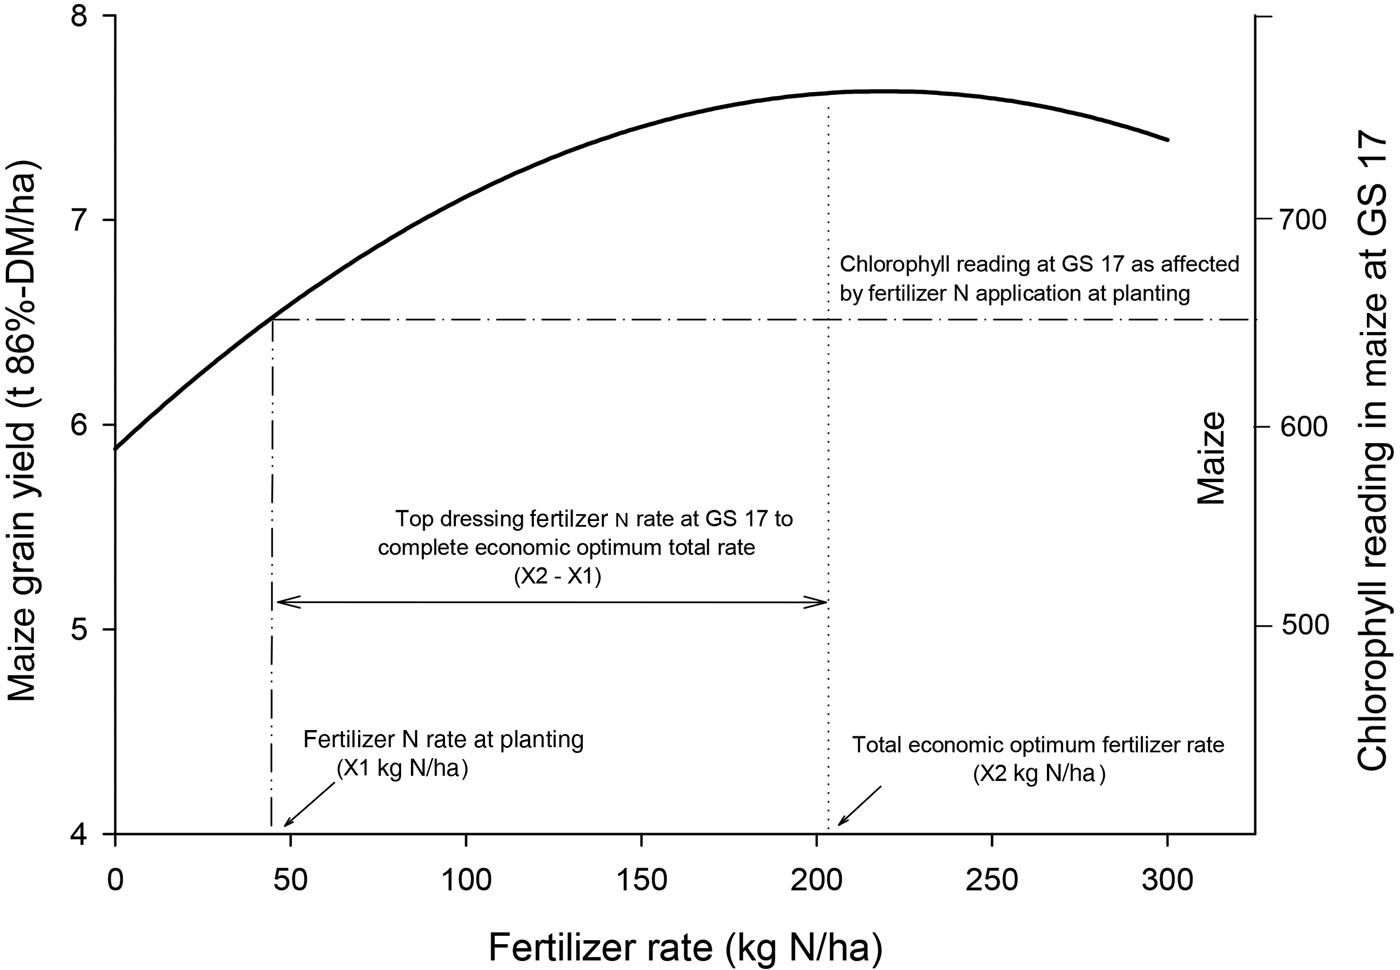
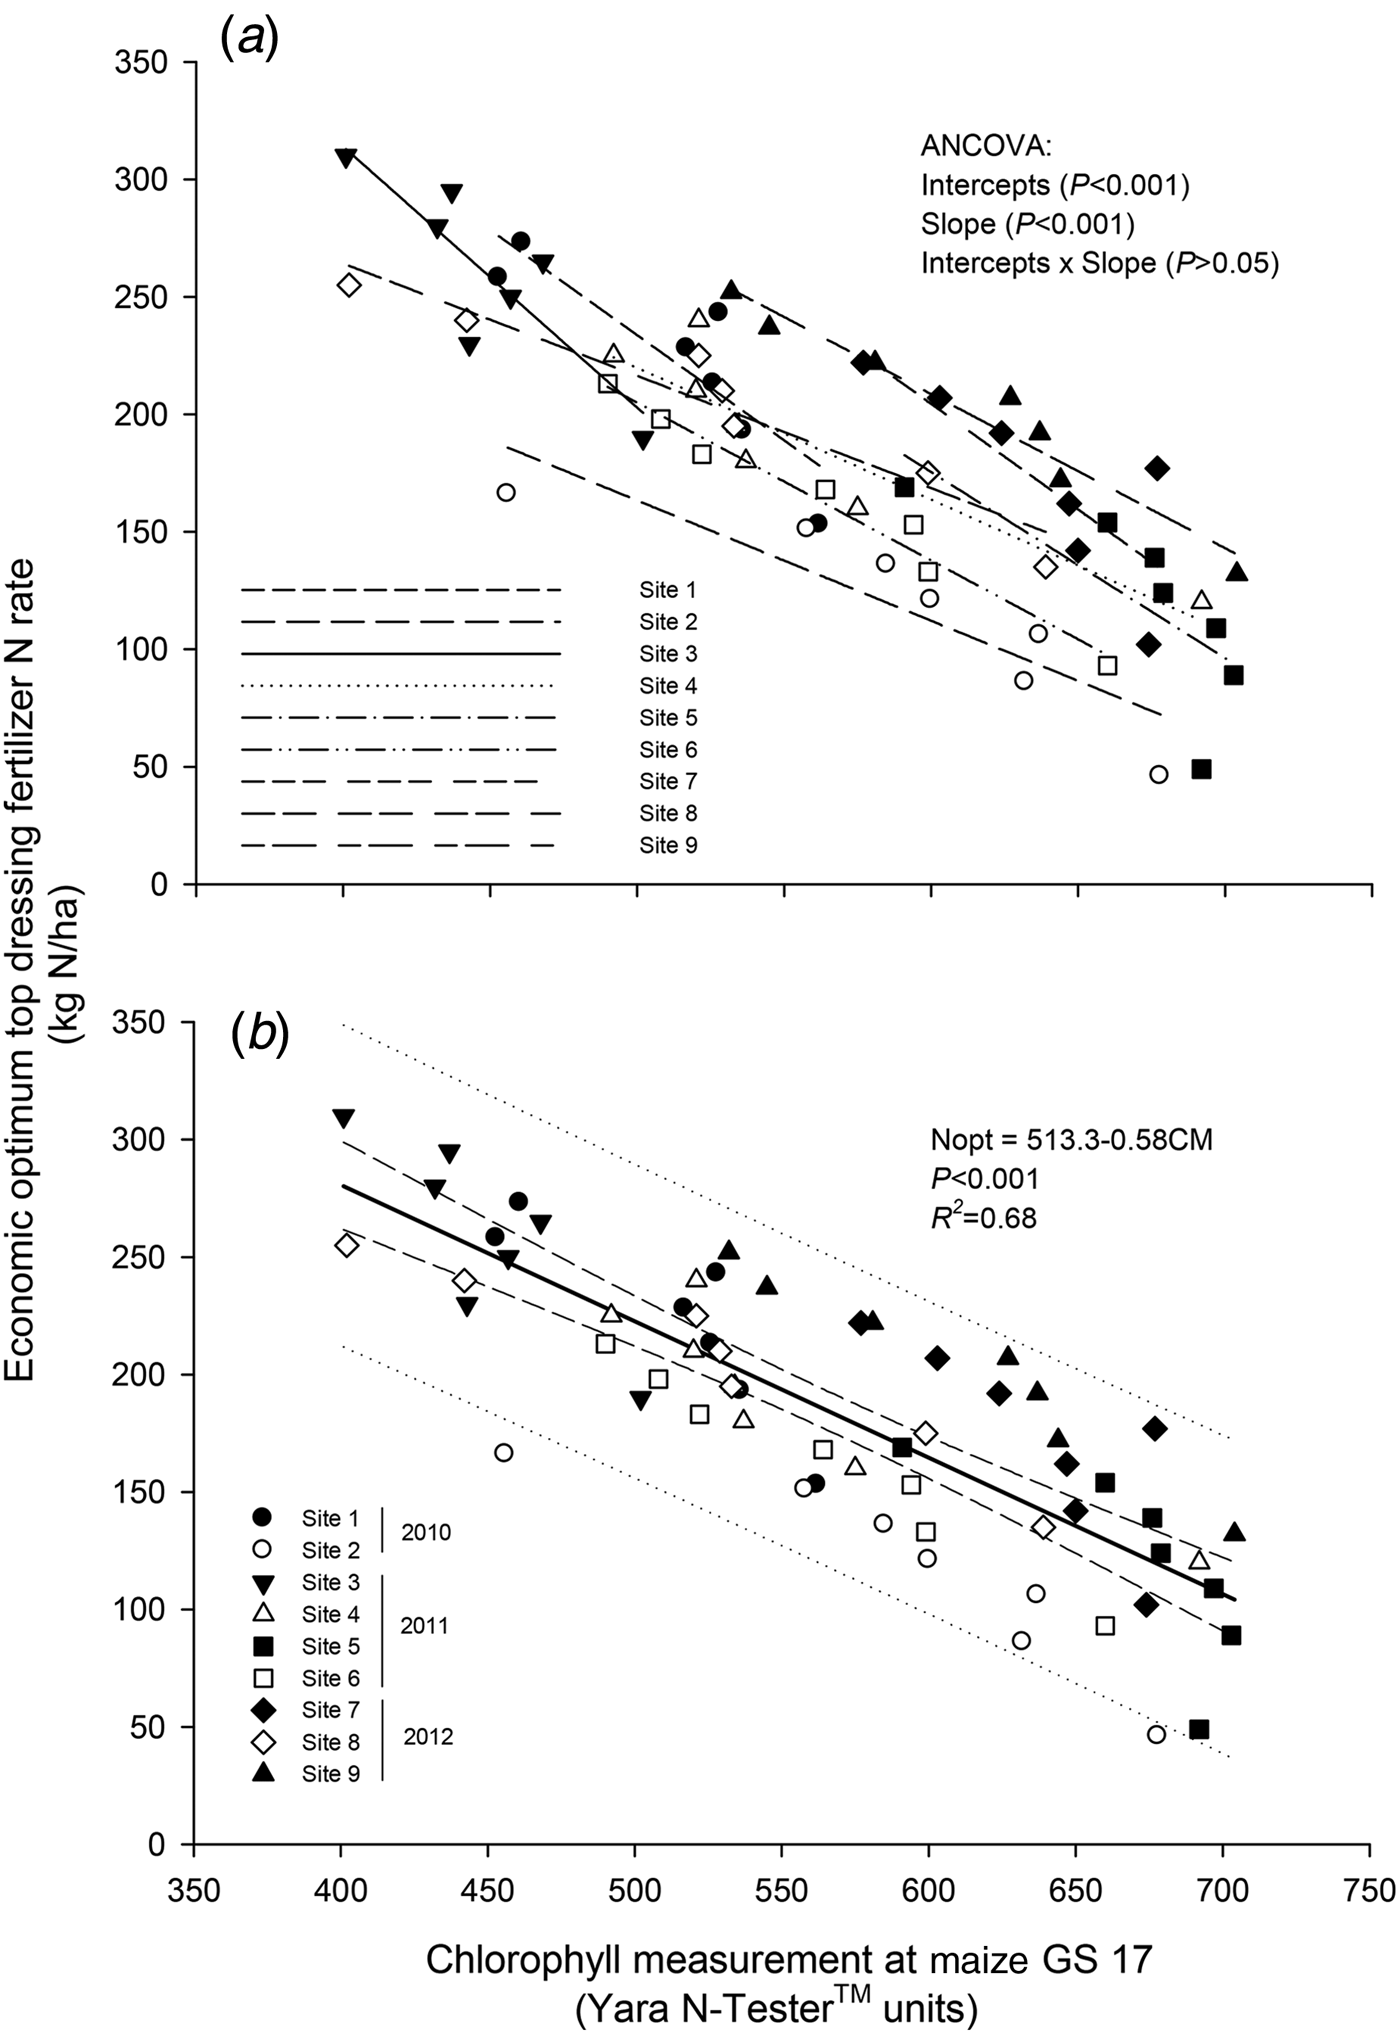
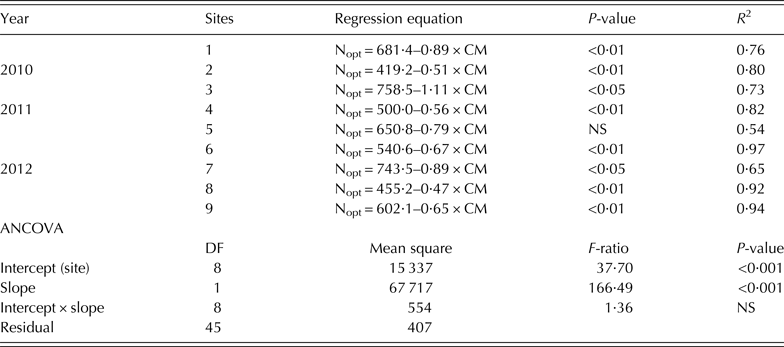
Figure 3 illustrates the data and background calculations required for subsequent relationship assessments and model fitting. The economic optimum fertilizer N rate for top-dressing (Nopt) was derived by deducting the fertilizer N supply at planting (X1 in Fig. 3) from the total Nopt calculated for that site based on field trials (X2 in Fig. 3). The resulting top-dressing Nopt rate is then regressed with the respective CM at GS 17 resulting from the X1. This calculation was performed for every treatment at every site. Following this approach, a relationship between the top-dressing Nopt and CM at GS 17 was found to fit linear regressions very well (R 2 = 0·65–0·97). Regressions were significant, except for site 5 (Table 4). The ANCOVA between site regressions showed highly significant (P < 0·001) differences between site intercepts and regression coefficient (slopes) but revealed no significant interactions (Table 4, Fig. 4(a)). Regression analysis based on grouped data (sites–years) for Nopt with CM was also highly significant and fitted a linear regression that explained 0·68 of the variation (R 2 = 0·68) (Fig. 4(b)).
Schematic representation of the background calculation of the top-dressing economic optimum fertilizer nitrogen (N) rate (Nopt) and chlorophyll concentration, i.e., a GS 17 required for relationship assessment and model fitting to develop chlorophyll-based algorithms to predict fertilizer N needs. Values for illustration only.
Regressions for economic optimum top-dressing fertilizer nitrogen (N) rate (Nopt) as a function of chlorophyll measurements in maize (cvar Jabali) at GS 17. Data based on field trials carried out in the central region of Mexico during 2010 (two sites), 2011 (four sites) and 2012 (three sites). Sites 1, 3, 4, 7, 8 and 2, 5, 6, 9 located at the experimental station and at farmer fields, respectively. (a) Linear regressions for each site. Covariance analysis (ANCOVA) included. (b) General linear regression model based on grouped data (sites–years). Data plots shown as per site (years indicated). Confidence and prediction intervals at 95% confidence level shown as short dash and dotted lines, respectively.
Regression equations as per site for top-dressing fertilizer economic optimum N rate (Nopt = kg N/ha) and chlorophyll measurement (CM = N-Tester™ units) for maize (cvar Jabali) GS 17. Field trials were carried out in 2010, 2011 and 2012 in the central region of Mexico. Sites 1, 3, 4, 7, 8 and 2, 5, 6, 9 located at experimental station and at farmer fields, respectively. Values are means of n = 4 (sites 1–3) or 3 (sites 4–9). Covariance analysis (ANCOVA) comparing linear regressions and interactions are included
DF = degrees of freedom. NS = Not significant (P > 0·05).
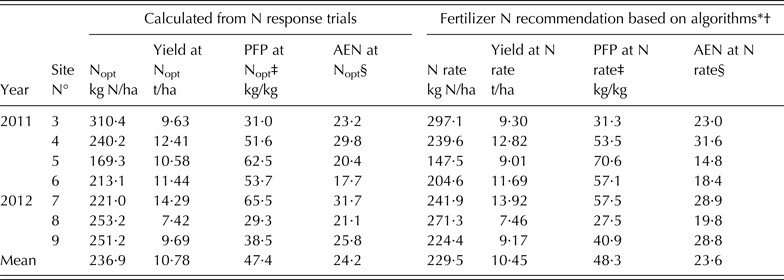
The ability of current algorithms to predict the top-dressing economic optimum N rate (Nopt) at maize GS 17 was assessed under field conditions during the trials carried out in 2011 (four sites) and 2012 (three sites). The algorithms predicted the Nopt reasonably well at all sites. On average, differences in recommended Nopt were only c. 7 kg N/ha as compared with the calculated Nopt from N response trials (Table 5) and grain yields at the respective Nopt were fairly similar. The partial factors of productivity (PFP) of the applied fertilizer N were also very similar, differing on average by c. 1 kg maize grain/kg N applied, whereas differences in the agronomic efficiency (AEN) averaged about 0·5 kg in maize grain increase/kg N applied.
Maize (cvar Jabali) grain yield, partial factor of productivity (PFP) and agronomic efficiency (AEN) of fertilizer N applied at economic optimum N rates (Nopt) derived from grain yield response trials to fertilizer N application and achieved with fertilizer N management supported by chlorophyll-based algorithms in field trials carried out in the central region of Mexico. Sites 1, 3, 4, 7, 8 and 2, 5, 6, 9 located at experimental station and at farmer fields, respectively. Values are means of n = 4 (sites 1–3) or 3 (sites 4–9)
* In 2011, fertilizer N supply = 45 kg N/ha at planting. Top-dressing N rate after chlorophyll measurement (CM) at GS 17 following the algorithm (2010): Nopt = 646·7–0·86 × CM (R 2 = 0·78).
† In 2012, Fertilizer N supply = 80 kg N/ha at planting. Top-dressing N rate after CM at GS 17 following the algorithm (2010 + 2011): Nopt = 595·9–0·69 × CM (R 2 = 0.75).
‡ PFP = Partial factor of productivity of applied nitrogen (kg maize grain/kg fertilizer N applied).
§ AEN = Agronomic efficiency of applied nitrogen (kg grain increase/kg N applied).
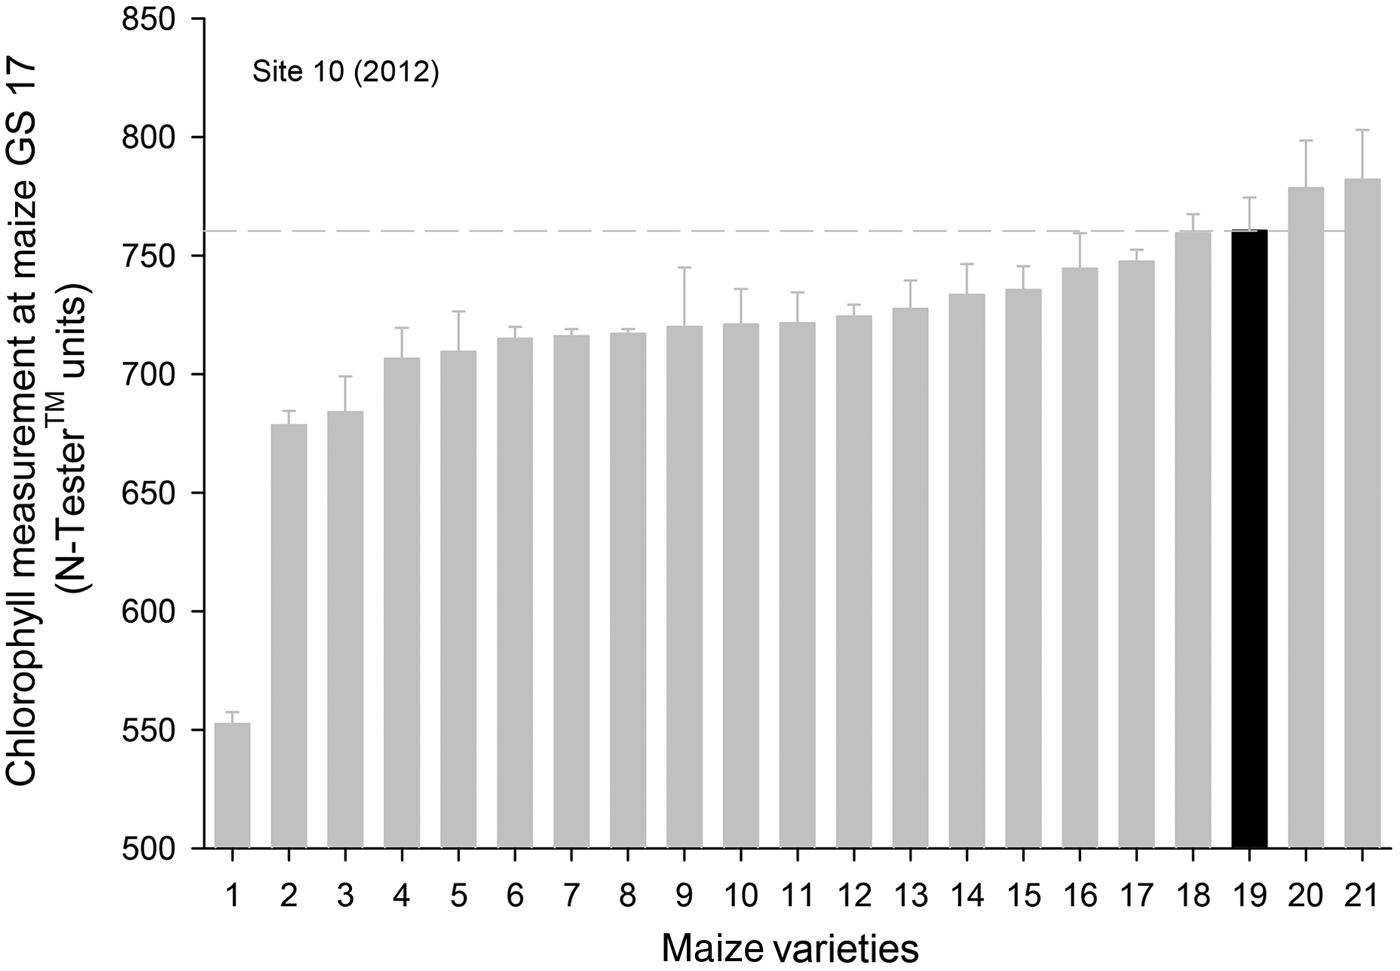
Figure 5 shows the CM at maize GS 17 of the most commonly grown commercial varieties in the region. The CM among the varieties ranged from c. 550–780 NT units. The variation in CM in relation to the reference cultivar Jabali ranged from c. + 20 to –200 NT units. There were only two ‘darker green’ cultivars and the rest were ‘lighter green’ as compared with the reference variety. Within the ‘lighter green’ varieties, one was a clear outlier, showing a difference of c. 200 NT units in relation to the reference variety.
Means of chlorophyll measurements at the seventh unfolded leaf (GS 17) of 21 maize cultivars commonly grown in the central region of Mexico. The filled-black bar corresponds to the reference variety Jabali. Values are means of n = 2, each represent an average of 30 readings.
DISCUSSION
Influence of fertilizer nitrogen supply on leaf chlorophyll concentration
The variations in CM at maize GS 17 in the control plots among sites confirm site-specific variability in N availability and/or mineralization potential. In the present study, the fertilizer N application at planting influenced CM significantly at GS 17, and the effect was pronounced in sites having relatively low CM (400–450 NT units) in control plots, i.e. sites 2, 6 and 8. The differences in CM between control plots and fertilizer N treatments were very variable and ranged up to 240 NT units, confirming not only important variations in crop N status but differences in the responses to fertilizer N supply, i.e. N need. These results are contrary to those reported by Ziadi et al. (Reference Ziadi, Brassard, Bélanger, Claessens, Tremblay, Cambouris, Nolin and Parent2008), who did not find significant effects of fertilizer N supply at early growth stages but did at later ones. Further to the impact of fertilizer N supply on CM, the present results showed that CM at GS 17 did not exceed 700 NT units, even at fertilizer N rates between 80 and 120 kg N/ha. Similar results were also reported by Ziadi et al. (Reference Ziadi, Brassard, Bélanger, Claessens, Tremblay, Cambouris, Nolin and Parent2008) and Rashid et al. (Reference Rashid, Voroney and Parkin2005). It appears that leaf chlorophyll concentration reaches a saturation level at growth stages between GS 15 and 17, being detected at levels approaching 700 NT units.
Significant effects of site and year on CM were expected; however, surprisingly, the year effect was not significant. The climatic conditions during the 3-year study were fairly similar. There was not much variation in temperature regime or in the amount of precipitation during cropping seasons. The grouped data (sites–years) ANOVA confirmed significant increments in CM with fertilizer N rates up to c. 45 kg N/ha. Higher N application rates resulted in small but not significant increments. This can be explained by the relationship between soil N supply and/or availability as related to the actual crop N demand at the specific maize GS 17. Up to this stage, the plant may have taken up N in an amount not exceeding one-fifth of the total uptake expected by harvest time (Abendroth et al. Reference Abendroth, Elmore, Boyer and Marlay2011). In the present study, taking into account attained grain yields, the apparent N uptake at GS 17 may be estimated to be c. 25–40 kg N/ha. This would explain why there was no further significant increase in chlorophyll concentrations at N application rates above 45 kg N/ha at planting. This fact should be carefully considered for trial design, because some soils may supply N in quantities (up to c. 30 kg/ha N) that are likely to cover the maize N demand at GS 17 either via initial soil mineral N availability and/or mineralization (Cassman et al. Reference Cassman, Dobermann and Walters2002). Therefore, calibration trials carried out at sites with high natural soil N contents (organic and mineral N), high mineralization potential and/or N high input levels (organic and mineral) would be likely to reach an ‘N over-supply’ situation after a fertilizer N application, particularly during the early growth stages, i.e. GS 14–15 up to GS 17. Furthermore, under conditions of high (over) soil N supply, CM have been found to be poor indicators of crop N status, because the total N taken up by the plant is not incorporated immediately into chlorophyll molecules and/or metabolized (Wood et al. Reference Wood, Reeves and Himelrick1993; Varvel et al. Reference Varvel, Schepers and Francis1997). Thus, the effects of fertilizer N supply on the chlorophyll concentration levels at early maize growth stages can easily be masked, thereby hindering the ability to detect true relationships. This may be one reason for the reported weakness of using direct CM to predict fertilizer N requirements (Scharf et al. Reference Scharf, Brouder and Hoeft2006; Ziadi et al. Reference Ziadi, Brassard, Bélanger, Claessens, Tremblay, Cambouris, Nolin and Parent2008).
There are several options for managing N source–sink relations during calibration trials, such as: (1) considering historical data on attainable maize yields and fertilizer N management in order to define, adapt and split fertilizer N applications accordingly, i.e. N rate at planting, (2) also conducting experiments on soils with relatively low N contents and average mineralization potentials and (3) taking CMs, earliest at GS 16, in order to ensure that an adequate growth and N demand level has been reached, allowing measurement of differences in the plant's N status. The quantification of the effect of fertilizer N supply on CM at a given growth stage is a pre-requisite for developing algorithms that are based on leaf greenness to support fertilizer N recommendations, without requiring normalization procedures. If fertilizer N supply does not have a measurable impact on CM at defined and/or relevant growth stages, it means that such a parameter is therefore not suitable for assessing N needs and/or it may be significantly influenced by factors other than N, meaning that further calibration work is no longer required. As the effects of fertilizer N supply on CM were significant and the increasing trend was consistent, these data can certainly be used for further analysis, i.e. these data can be related to fertilizer N rates expected to be applied and their level of relationship assessed. Thus, the next step for algorithm development is to identify and quantify the total optimum fertilizer N rate. For this, grain yield response curves to fertilizer N applications are required.
Maize grain yield response to fertilizer nitrogen and economic optimum fertilizer nitrogen rate
The adoption of technologies by farmers such as crop sensing is influenced to a large extent by economics, i.e. cost/benefit ratio, and their practicality of use (Cassman et al. Reference Cassman, Dobermann and Walters2002; Olfs Reference Olfs2009; Samborski et al. Reference Samborski, Tremblay and Fallon2009). Therefore, it is proposed that algorithms should target the prediction of an N rate which is meaningful from an agronomic, economic or environmental perspective, i.e. economic optimum N rate (Nopt). The economic Nopt represents the N rate which will give the maximum financial return to the farmer, taking into consideration both the prevailing crop and fertilizer prices. Although farmers may not know grain and/or fertilizer prices in advance, the fertilizer recommendation system should still consider the economics of fertilizer inputs and of crop produce. Furthermore, from an agronomic and environmental standpoint, the application of Nopt has resulted in low residual mineral N at harvest as well as in low N balances (N input/output), while giving optimum yields. Thereby the risks of environmental impacts from residual N are minimized, particularly leaching (Olfs et al. Reference Olfs, Blankenau, Brentrup, Jasper, Link and Lammel2005), greenhouse gas emissions and the carbon footprint of fertilizer use in terms of kg CO2-equiv/t of crop produce (Brentrup & Palliere Reference Brentrup and Palliere2008; Kindred et al. Reference Kindred, Berry, Burch, Sylvester-Bradley, Halford, Jones and Lawlor2008).
Maize grain yield responses fitted quadratic regressions that allowed calculation of total Nopt. Such models have shown to be able to describe the relation between fertilizer N rates and grain maize yields well (Cerrato & Blackmer Reference Cerrato and Blackmer1990; Ziadi et al. Reference Ziadi, Brassard, Bélanger, Claessens, Tremblay, Cambouris, Nolin and Parent2008). The sites under soil conservation management (sites 2, 5 and 6) showed rather lower fertilizer N requirements than the conventional sites, even at comparable yield levels. This could be explained by improved water storage and nutrient cycling buffer capacity as well as the crop residue and rotation management carried out in conservation agriculture (Grahmann et al. Reference Grahmann, Verhulst, Buerkert, Ortiz-Monasterio and Govaerts2013). The calculated Nopt in the present study averaged about 230 kg N/ha, which seems to be relatively higher than that reported in the literature (Dobermann Reference Dobermann2007). However, if average grain yields are considered (c. 10 t/ha), then the N input/output ratio would be fairly balanced. Furthermore, the local official recommendation for such productivity levels is c. 240 kg N/ha. The current results confirm the variability in terms of fertilizer N requirements and crop responses, supporting the need for crop- and site-specific fertilizer N management to improve sustainability of maize production in the region.
Prediction of economically optimum fertilizer nitrogen rates based on chlorophyll measurements
Algorithms for fertilizer N recommendations based on leaf CM rely on the relationship between fertilizer N supply and the chlorophyll concentration at a defined growth stage. Varvel et al. (Reference Varvel, Wilhelm, Shanahan and Schepers2007) attempted a similar approach, but used an N sufficiency index based on data between GS 18 and 22 instead of chlorophyll concentrations. The combination of growth stages is expected to add another source of variation into the algorithm development. Scharf et al. (Reference Scharf, Brouder and Hoeft2006) found important differences in algorithm slopes related to growth stage, suggesting the need for crop-stage specific calibration. This is another reason why algorithms using direct CM should target, and also be linked to, specific growth stages in order to be relevant for fertilizer application and crop nutrition. Following the current proposed method, a highly significantly linear correlation between the top-dressing fertilizer N rate and CM at GS 17 was found in all sites, except for site 5. This site showed relatively high CM in the control treatment (591 NT units) while maximum readings were c. 676–703 NT units, achieved after relatively low N applications at planting, e.g. 30 kg N/ha. Moreover, this site showed a weak grain response to fertilizer N application. This confirms fairly good N availability and/or mineralization potential at this site, and would explain the lack of significant predictability of N needs when using CM directly for model fitting. Nevertheless, for calibration purposes these sites are as important as those showing strong responses because they provide information for Nopt prediction at high soil N status. Scharf (Reference Scharf2001) found significant linear relationships between top-dressing Nopt and CM at GS 16. Rashid et al. (Reference Rashid, Voroney and Parkin2005) also found linear relationships between CM and Nopt, even at earlier stages, i.e. GS 15 and 16, with a very good correlation level (R 2 = 0·75). Later, Scharf et al. (Reference Scharf, Brouder and Hoeft2006) concluded that ‘absolute’ CM (direct measurements) were significant predictors of economically optimum N rates at both early and later stages but in N-responsive situations, i.e. sites without N fertilization or low soil N status. In sites with high natural soil N levels and/or receiving relatively high fertilizer N applications, the relationships between CM and Nopt were either poor or not detectable, particularly during the early stages, i.e. GS 14–17. Under the latter conditions, a measurable impact of fertilizer N applied at planting on chlorophyll concentrations at those growth stages is unlikely, and little or no grain yield response to fertilizer N supply is to be expected. Most studies appear not to have considered this fact sufficiently and have included several sites and years, but combining different fertilizer management (split), N application rates, application timings, fertilizer N types, different growth stages and even cultivars. The interaction between all these factors may have hindered the identification of true relationships between direct CM, Nopt and yields, particularly at early maize growth stages, i.e. GS 16 and 17.
With regard to relationship assessments, the ANCOVA showed that the interaction between intercepts and slopes was not significant. This means that slopes between sites are actually homogeneous allowing the data set to be grouped (site–year) to build up a ‘general’ linear algorithm. The multi-site and year analysis revealed a highly significant general linear relationship between CM and top-dressing Nopt, confirming its potential to predict the top-dressing fertilizer needs at maize GS 17 and showing that such algorithms can only be ‘built’ if data used to fit the model comprise information representative of high, medium and low fertilizer N requirements and situations. However, these results are contrary to those reported by Ziadi et al. (Reference Ziadi, Brassard, Bélanger, Claessens, Tremblay, Cambouris, Nolin and Parent2008), who found significant differences in the intercepts and slopes between sites and also years over a 3-year study. In their study, relationship assessments were based on relative CM and N nutritional indices, which included several sites and years but also different growth stages and varieties. Potential drawbacks of combining such factors, including growth stages, for algorithm developments have been already discussed. Samborski et al. (Reference Samborski, Tremblay and Fallon2009) highlighted that the value of algorithms for prediction of N needs is still limited to conditions similar to those where the calibration was conducted. For these reasons, there is no general algorithm using CMs that fits different agro-ecological and application systems, thus local calibration or adaptation is required. The prediction reliability of the current algorithm, although fairly good (P < 0·001, R 2 = 0·68), needs to be further improved given that it is based on a wide prediction band. Improvement can be achieved by including a high number of sites (and years) for model fitting. From a practical standpoint, to improve the algorithm's prediction reliability an adequate number of readings must be carried out over a representative area of the field, following a strict measurement protocol considering carefully the growth stage and part of the plant where readings are taken.
Agronomic performance of algorithms to predict fertilizer nitrogen needs
The predicted Nopt (and respective grain yields) with the proposed algorithms were shown to be fairly similar compared with the same parameters calculated from grain yield response trials. The Nopt were around those reported for well-managed and high yielding maize systems. The PFP and AEN of applied N were also very similar. The PFPs have been reported to be around the agronomic optimum yield and AEN were representative for improved maize production systems (Dobermann Reference Dobermann2007; Espinosa & García Reference Espinosa and García2009). Despite a number of important studies on chlorophyll-based algorithm development, there are very few reports on the agronomic performance of using specifically hand-held devices, e.g. a SPAD chlorophyll meter, for fertilizer N recommendations in maize. Scharf (Reference Scharf2001) tested an algorithm based on direct CMs (without normalization) at GS 16, which performed as well as local standard crop- and soil-based recommendation methods in terms of agronomy, while also providing economic benefits. Thereafter, Scharf et al. (Reference Scharf, Brouder and Hoeft2006) found that the use of CM (without normalization) may be a convenient option for supporting fertilizer N management in situations where N is limiting (low N plant availability). Nitrogen deficiency immediately results in low leaf chlorophyll concentrations that are quickly identified by optical chlorophyll meters, e.g. SPAD (Bullock & Anderson Reference Bullock and Anderson1998). Consequently, the current approach is going to be particularly useful under ‘nitrogen responsive situations’ where N is the limiting growth factor.
From a practical standpoint, a suggested fertilizer N management integrating the current algorithm for maize production under local conditions of the study could be carried out as follows: application of c. 80 kg N/ha during planting, and a top-dressing fertilizer N application at GS 16 and 17 as derived by the algorithm. In order to avoid an over- and under-N supply, the maximum top-dressing fertilizer N rate should not exceed 250 kg N/ha (if CM < 400 NT units), while the minimum application could be at least 70 kg N/ha (CM > 750 NT units).
So far, the algorithm has been developed using a single variety, i.e. Jabali. However, there are other varieties available in the market/region for farmers, which may differ in their genotype-related greenness. Thus, so-called ‘variety correction factors’ accounting for those cultivar-specific greenness differences shall be quantified in order to assess whether the fertilizer N rate to be recommended by the current algorithm should be adjusted accordingly.
Development of correction factors accounting for cultivar-related differences in greenness
The influence of factors related to specific variety greenness traits are well known, particularly when measured using optical devices such as hand-held chlorophyll meters as the N-Tester™ or SPAD-502 (Piekkielek & Fox Reference Piekkielek and Fox1992; Bullock & Anderson Reference Bullock and Anderson1998; Samborski et al. Reference Samborski, Tremblay and Fallon2009). Therefore, if CMs are intended to be used directly (without normalization), in addition to a strict measuring protocol this approach would require a ‘chlorophyll correction factor’ that accounts for genotype-related differences between varieties.
The field assessment showed that most of the varieties used in the region are ‘lighter green’ than the calibration variety Jabali and variations in the chlorophyll measurement would represent differences in fertilizer N rates up to c. 130 kg N/ha. Hence, it is very important to account for such differences and develop cultivar correction factors. If a correction for greenness is not implemented, the use of the current algorithm on ‘lighter green’ cultivars would result in an overestimation of the rate of fertilizer N to apply. This would lead to immediate reductions in fertilizer N use efficiency, and to increasing risks of environmental impacts related to N surpluses. A correction adjusting the recommended fertilizer N rate according to the specific variety can be done by adding or subtracting the absolute difference in the CM between the reference variety to any other, and compute this difference accordingly as per variety before the current algorithm is used to calculate the top-dressing Nopt. Such corrections can be easily implemented and uploaded in the chlorophyll meter device software.
The current assessment of the differences in greenness was carried out on a single field and year. However, it is also known that N use efficiency varies between genotypes, particularly when grown under different conditions (Cassman et al. Reference Cassman, Dobermann and Walters2002; Samborski et al. Reference Samborski, Tremblay and Fallon2009). As in the calibration trials, variety correction factors must also integrate agro-climatic conditions of the region and/or system. Consequently, such assessments are to be carried out over several sites and years.
CONCLUSION
Algorithms using chlorophyll data (without normalization) to predict top-dressing fertilizer N rates to be applied are variety- and growth stage-specific. Hence, the calibration methodology is to be adapted to local conditions and/or cropping system. The proposed approach is feasible if a top-dressing fertilizer N application is common and/or required, and if the following interactions are identified and statistically significant: (1) effect of fertilizer N supply on chlorophyll concentration at a relevant time or growth stage for fertilizer application; and (2) relationship between the top-dressing fertilizer N rate and chlorophyll concentration at the defined growth stage. Consequently, information on the optimum fertilizer N rate is essential. The agronomic reliability of such algorithms is based on the integration of a representative database for model fitting accounting for soil and climate variability within a region and/or cropping system. Furthermore, ‘variety correction factors’ considering genotype-related differences in greenness of local varieties as well as new varieties will be developed in order to make the use of such algorithms both practical and meaningful for farmers.
The authors thank the scientific and technical staff of the ‘National Research Institute for Forestry, Agriculture and Animal Production’ (INIFAP-Celaya) at Celaya's experimental research station, in particular Juan Francisco Buenrostro for the coordination of the field trials, as well the participating farmers. Special thanks are to Dr David Bilsborough and Dr Katharina Plassmann for improving the English as well as to Jens Tierling for supporting the statistical analyses. This research was funded by both Yara Mexico S.A. de C.V. and Yara International ASA (Oslo, Norway).