Introduction
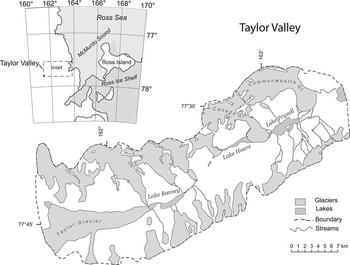
The largest ice-free region in Antarctica is the McMurdo Dry Valleys area of southern Victoria Land. These valleys are among the coldest and driest terrestrial environments on Earth. The McMurdo Dry Valleys receive a total annual precipitation of c. 3 cm and have an average annual temperature of c. -20°C (Fountain et al. Reference Fountain, Nylen, Monaghan, Basagic and Bromwich2010). The modern climate varies systematically with elevation and distance from the coast (Marchant & Denton Reference Marchant and Denton1996). In these valleys, there are a number of perennially ice-covered lakes that have been investigated since the early 1960s and in more detail since the establishment of the McMurdo Dry Valleys Long-Term Ecological Research (MCM-LTER) programme in 1993 (Fig. 1). As the majority of the lakes are located in closed basins, small changes in the climatic conditions that control the amount of freshwater flowing into the lakes can have profound effects on the surface ice thickness, water levels, aqueous chemistry and biogeochemical dynamics of the lakes. The palaeolimnology and limnology of these lakes have revealed important details about climate change in this region of Antarctica, an area that is affected by changes in both the West and East Antarctic ice sheets (Denton et al. Reference Denton, Bockheim, Wilson and Stuiver1989, Doran et al. Reference Doran, Wharton and Lyons1994, Hendy Reference Hendy2000).
Location map of Taylor Valley, southern Victoria Land, Antarctica.

Taylor Valley, part of the McMurdo Dry Valleys, is 33 km long and comprised of perennially ice-covered lakes, ephemeral streams, soils, bedrock and surrounding glaciers. The three major closed basin lakes within Taylor Valley (Lake Fryxell, Lake Hoare and Lake Bonney) are quite different from one another despite their geographic proximity (Fig. 1). The aqueous chemistry of the lakes ranges from relatively freshwater throughout the water column (Lake Hoare) to hypersaline hypolimnetic waters (Lake Bonney). Major ionic ratios, primary production rates, nutrient characteristics and algal distribution also vary among the lakes (Priscu Reference Priscu1995, Lizotte & Priscu Reference Lizotte and Priscu1998, Lyons et al. Reference Lyons, Welch, Neumann, Toxey, McArthur, Williams, McKnight and Moorhead1998b).
Lake Hoare and Lake Fryxell each have a perennial ice cover, ranging from 3.4–5.8 m in thickness (www.mcmlter.org). The gain and loss of ice surface on these lakes is important because the ice cover can preserve historical climate information (Matsubaya et al. Reference Matsubaya, Sakai, Torii, Burton and Kerry1979, Lyons et al. Reference Lyons, Tyler, Wharton, McKnight and Vaughn1998a, Poreda et al. Reference Poreda, Hunt, Lyons and Welch2004). The ice cover restricts the interaction between lake water and atmospheric gases, limits circulation within the lake and offers a shield for organisms against the harsh winter. During the summer, the combination of flow from the ephemeral streams, direct flow from the glaciers and melting of the ice cover can result in an area of melted water, commonly known as a moat, around the lakes’ perimeters. When this occurs, approximately 1–3% of the lake surface area is exposed to the atmosphere (Spigel & Priscu Reference Spigel and Priscu1998). The stream inflow to the lakes varies on a daily, seasonal and annual basis (www.mcmlter.org). Water is lost from these closed basin lakes only through sublimation and ablation of the ice cover and evaporation from the moats (Chinn Reference Chinn1993).
Processes such as freezing, evaporation, sublimation and mixing modify the isotopic and chemical composition of the lakes as compared to their primary source, the glacier meltwater (Gooseff et al. Reference Gooseff, Lyons, Mcknight, Vaughn, Foundation and Dowling2006). Both Lake Hoare and Lake Fryxell have a stable water column through thermal and salinity stratification. The minor interaction between the wind and the moat does not transfer enough wind energy into the lake in order to mix the entire stratified water column; however, moats are one location where very localized turbulence can generate laminar (smooth, non-turbulent) water movements that may produce mixing of the surface water to limited vertical depth (Spigel & Priscu Reference Spigel and Priscu1998). Another example of potential mixing within these lakes is the production of weak density currents due to solute concentration during the re-freezing of the moat (Miller & Aiken Reference Miller and Aiken1996). As surface water freezes to the bottom of the ice cover, solutes are often excluded from the ice crystal formation and a local convection current is produced (Miller & Aiken Reference Miller and Aiken1996). Once a sufficient amount of solutes are expelled from the ice crystal matrix and dissolved into the lake water, a denser saline layer under the moat ice can form and sink to deeper depths. Another type of localized mixing could result from the direct input of very cold water from the melting of glaciers that are in contact with lake water (e.g. Lake Hoare).
The location of the lakes within the landscape of Taylor Valley is a major factor influencing the local climate and, thus, the evolution of the lakes and their subsequent chemical and biological composition (Lyons et al. Reference Lyons, Fountain, Doran, Priscu, Neumann and Welch2000). The lakes have not experienced the same drawdown and refilling history during the Holocene period (Matsubaya et al. Reference Matsubaya, Sakai, Torii, Burton and Kerry1979, Lyons et al. Reference Lyons, Tyler, Wharton, McKnight and Vaughn1998a, Poreda et al. Reference Poreda, Hunt, Lyons and Welch2004). Lake Hoare's maximum depth is 34 m; it has a surface area of 17.5 km2 and a water volume of 1.9 x 10⁶ m3 (Lyons et al. Reference Lyons, Tyler, Wharton, McKnight and Vaughn1998a, Spigel & Priscu Reference Spigel and Priscu1998). Only a few ephemeral streams flow into Lake Hoare during the summer, the lake receives the majority of its water from the Canada Glacier (60–80%) (Fortner et al. Reference Fortner, Tranter, Fountain, Lyons and Welch2005). There is significant contact with the Canada Glacier throughout the water column. The lake water is relatively fresh, and there is a small overall increase in conductivity with depth (Spigel & Priscu Reference Spigel and Priscu1998, Lyons et al. Reference Lyons, Fountain, Doran, Priscu, Neumann and Welch2000). Lake Fryxell is situated east of Lake Hoare. It is the shallowest (c. 21 m depth) of the major Taylor Valley lakes. Approximately 14 ephemeral glacial meltwater streams flow into the lake during the summer (Chinn Reference Chinn1993). Lake Fryxell has a surface area of 7.06 km2 and a water volume of 25.2 x 10⁶ m3 (Miller & Aiken Reference Miller and Aiken1996, Spigel & Priscu Reference Spigel and Priscu1998, Lyons et al. Reference Lyons, Fountain, Doran, Priscu, Neumann and Welch2000). Even though there is some contact between its ice cover and Canada Glacier, there is little direct contact between the glacier and its water column (Spigel & Priscu Reference Spigel and Priscu1998). Conductivity increases with depth in Lake Fryxell, and the water column typically becomes anoxic below 9 m (www.mcmlter.org).
By temperate standards, slight climatic variations can have dramatic effects on the hydrologic budgets of these Antarctic lakes, as observed in the 2001–02 field season, an unusually high meltwater year. From 1991–2001, there was a slight decline in the annual lake levels of Lake Hoare and Lake Fryxell (Lake Hoare: 4.3 cm/year; Lake Fryxell: 6.2 cm/year). Sublimation and evaporation was greater than stream inflow or direct glacial melt (Doran et al. Reference Doran, Priscu, Lyons, Walsh, Fountain, McKnight, Moorhead, Virginia, Wall, Clow, Fritsen, McKay and Parsons2002). However, during the high meltwater year of 2001–02, the increased stream inflow and glacial melt caused the lake levels to rise close to 1991 levels (Lake Hoare: 40 cm; Lake Fryxell: 52 cm). As the climate changes in the polar regions, these high flow years may become more numerous. High meltwater years may affect the long-term physical limnology of the ice-covered lakes.
In this study, we use dissolved gas, tritium and chlorofluorocarbons (CFCs) to examine the effects of high meltwater on Lake Hoare and Lake Fryxell. We hypothesize that the upper waters will have undergone some degree of mixing with a large input of liquid water. Due to the large amount of ‘new’ water into the system, the concentrations of the dissolved gas, tritium and CFCs levels will have changed. As a result of stratification, this ‘new’ water will flow on top and not mix with the more saline bottom waters. However, if there is mixing between the top and bottom lake layers, then the levels of the dissolved gas, tritium and CFC throughout the water column will be different from that of previous years.
Methods
Water column samples for sodium, dissolved gas (helium isotopes [3He and 4He], neon [Ne], nitrogen [N2], argon [Ar]), and tritium were collected at Lake Hoare and Lake Fryxell during January 2000. Sodium, dissolved gas (3He, 4He, Ne, N2, Ar), tritium and CFC (CFC-11, CFC-12) samples were collected at Lakes Hoare and Lake Fryxell during December 2002. Sampling was done through a hole melted through the ice cover of the lakes to the water below, and the depths are reported relative to the ice-cover surface. The samples were coded based on lake name, field season and depth from ice surface. For example, LH-02-05 was sampled from Lake Hoare during the Antarctica field season 2002–03 at 5 m depth below the ice-cover surface.
The sodium samples were collected in Niskin bottles at discrete depths. They were stored in acid-washed polyethylene bottles, filtered through Nuclepore® 0.4 μm filters, and acidified to a pH < 2 with Ultrex nitric acid (HNO3). The samples were analysed using a Dionex ion chromatograph at the Crary Laboratory at McMurdo Station (Welch et al. Reference Welch, Lyon, Whisner, Gardner, Gooseff, McKnight and Priscu2010). The average percentage error as determined from the relative percentage difference between duplicates was 1% for sodium.
For dissolved gas and tritium samples, the lake water was also collected in Niskin bottles at discrete depths. The samples for dissolved gas and He isotope analysis were collected and stored using 3/8-inch (I.D.) copper tubes and sealed with refrigeration clamps according to methods established and used since the early 1970s (Poreda et al. Reference Poreda, Cerling and Solomon1988). In 1999–2000, seven dissolved gas samples were collected at both lakes. During the 2002–03 field season, ten dissolved gas samples were collected at Lake Hoare and nine at Lake Fryxell. Gas concentrations and isotopic ratio measurements for He were carried out at the Rare Gas Facility at the University of Rochester. The dissolved gas was extracted and processed on a high vacuum line (Poreda et al. Reference Poreda, Cerling and Solomon1988). Major gas constituents (e.g. N2) were measured using a Dycor quadruple mass spectrometer. He isotope ratio measurements were made with a VG 5400 noble gas mass spectrometer by peak height comparison to a calibrated air standard with errors of c. 2%. He isotope ratios are expressed as R/Rair, where R is the 3He/4He ratio in the sample and Rair is the 3He/4He ratio in the air standard. Errors in the reported values of R/Rair are c. 0.5%.
Tritium (3H) is the radioactive isotope of hydrogen with a half-life of 12.43 years and produced naturally in the upper atmosphere through cosmogenic reactions. It is a useful tracer in water because it becomes part of the water molecule (3H2O) and can be used to identify recent precipitation following the atmospheric thermonuclear testing of the 1950s and 1960s. Prior to aboveground nuclear testing, tritium levels in precipitation were estimated to be between 0.5 and 20 tritium units (TU) (Kaufman & Libby Reference Kaufman and Libby1954, Robertson & Cherry Reference Robertson and Cherry1989). Anthropogenic tritium reached peak concentrations in 1963 (the bomb-pulse). Water samples for tritium analysis were stored in amber glass bottles with polyethylene caps to minimize water vapour exchange. No headspace was allowed. Seven tritium samples in 1999–2000 and eleven samples in 2002–03 were collected from both Lake Hoare and Lake Fryxell. The tritium values were determined using the 3He ‘in-growth’ technique (Clarke et al. Reference Clarke, Jenkins and Top1976) and measured on the VG 5400 noble gas mass spectrometer at the Rare Gas Facility at the University of Rochester. The errors depend on the amount of 3H and are ± 0.5% at 30 TU, 2% at 5 TU and 4.5% at 0.05 TU (Groning et al. Reference Groning, Taylor, Winckler, Auer and Tatzber2001). The detection limit of 3H is 0.05 TU.
Another practical environmental tracer of young (< 50 years) precipitation is CFCs (CFC-11 and CFC-12). From the 1930s to 1996, CFCs were produced as an alternative to ammonia and sulfur dioxide for refrigeration (Plummer & Busenberg Reference Plummer and Busenberg2000). The gradual increase in CFC concentrations and their ratios have been used to accurately date water, especially young groundwater (Plummer & Busenberg Reference Plummer and Busenberg2000). The CFC samples were collected at depth using the purge and trap technique to ensure that the lake water had no interaction with the atmosphere (Busenberg & Plummer Reference Busenberg and Plummer1992). A stainless-steel bailer, via nylon tubing, was connected to a glass ampoule secured in a tripod. The sampling equipment was purged with ultra-pure nitrogen gas prior to each sample collection. The stainless-steel bailer, with a foot valve on the bottom, was lowered into the water column, under nitrogen pressure. At the appropriate depth, the pressure was released; the foot valve closed, and the lake water flowed to the surface. The first sample from each depth was used to purge the bailer and nylon tubing. After the air was purged from the borosilicate ampoule using ultra-pure nitrogen, the ampoule was filled with the sample and then flamed sealed. Two samples were collected from each bailer, samples denoted ‘a’ were the first from the bailer, samples denoted ‘b’ represented the next ampoule. During the 2002–03 field season, eleven depths were sampled at Lake Hoare and five at Lake Fryxell. The CFC samples were analysed at CSIRO (Commonwealth Scientific and Industrial Research Organization) in Adelaide, Australia for CFC-11 and CFC-12. Even though a number of samples were broken in shipment, each sampled depth was represented by at least one sample. Analytical precision for CFC-11 is approximately ±2% at 500 pg kg-1, decreasing to ±5% at 100 pg kg-1 and ±20% at 20 pg kg-1. Analytical precision for CFC-12 is ±2% at 500 pg kg-1, decreasing to ±10% at 100 pg kg-1 and ±30% at 20 pg kg-1. The detection limit for CFC-11 and CFC-12 is c. 5 pg kg-1.
Results
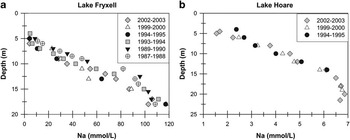
The sodium, dissolved gas, tritium and CFC data for Lake Fryxell during the 2002–03, 1999–2000, 1994–95, 1993–94, 1989–90 and 1987–88 summer seasons are shown in Table S1 (which can be found at http://dx.doi.org/10.1017/S095410201300062X). The sodium, dissolved gas, tritium and CFC data from Lake Hoare during the 2002–03, 1999–2000 and 1994–95 summers can be found in Table S2 (http://dx.doi.org/10.1017/S095410201300062X). During the summer, lake levels can change through either sublimation of the ice cover or the input of liquid water; therefore, sodium was used as an analogue for depth in the McMurdo Dry Valleys lakes (Fig. 2).
Sodium (Na) concentration vs depth. a. Lake Fryxell. b. Lake Hoare.

Dissolved gas
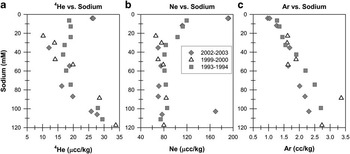
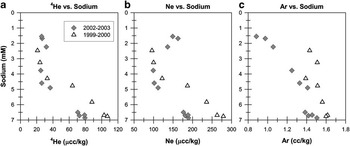
Figures 3a–c and 4a–c display the 4He, Ne and Ar data vs sodium (analogue for depth as discussed above) for Lake Fryxell and Lake Hoare, respectively. Ice formation affects the concentrations of dissolved gas in the water column. As the top of the perennial ice cover sublimes, new ice is created from the underlying water. During ice formation, the less soluble gases (e.g. He, Ne and N2) concentrate in the ice crystal matrix while the residual liquid water is more enriched in heavier, more soluble gases such as Ar.
Lake Fryxell: 4He, Ne and Ar vs sodium for the 1993–94, 1999–2000 and 2002–03 summers. a. 4He vs sodium. b. Ne vs sodium. c. Ar vs sodium. Data sources: this study and Hood et al. (Reference Hood, Howes and Jenkins1998).

Lake Hoare: 4He, Ne and Ar vs sodium for the 1999–2000 and 2002–03 summers. a. 4He vs sodium. b. Ne vs sodium. c. Ar vs sodium.

In the shallow waters of Lake Hoare, 4He, Ne, and Ar data from the 2002–03 samples are typically closer to equilibrium solubility than those samples collected during the 1999–2000 season (Fig. 4). Late in the short summers, after the lake moat forms, the moat and stream waters equilibrate with the atmosphere. These air-equilibrated waters combine with the existing lake water that is deficient in 4He and Ne, and enriched in Ar from the constant ice formation, causing the surface water concentrations to shift closer to equilibrium solubility values.
In the deeper waters of Lake Hoare, the 4He concentrations are elevated 1.5–3 x compared to 4He solubility (48.7–47.3 μcc 4He kg-1 (H2 O) for 1–6°C) and the 3He/4He ratios are significantly lower. The increasing 4He levels and the decreasing 3He/4He ratios with depth indicate that He is being introduced into the water column via underlying sediments (Poreda et al. Reference Poreda, Hunt, Lyons and Welch2004). The 1999–2000 Ne levels in the deeper water are higher than equilibrium solubility while the 2002–03 concentrations are less than solubility. In the deeper waters, Ar concentrations are 2–3 x greater than the equilibrium solubility ones (0.48–0.42 cc Ar kg-1 for 1–6°C).
In the bottom waters of Lake Hoare, the noble gas values differ from 1999–2000 to 2002–03. The 4He, Ne and Ar data indicate that the 2002–03 samples have shifted closer to equilibrium solubility values, which may have resulted from dilution from density currents (Fig. 4).
In Lake Fryxell, 4He and Ne values are below equilibrium solubility (< 47 μcc 4He kg-1 and < 210 μcc Ne kg-1) and Ar levels are above solubility (> 0.48 μcc kg-1) throughout the water column for the 1993–94, 1999–2000 and 2002–03 seasons. The surface water and some deep water samples from 2002–03 indicate that, at these depths, values have shifted closer to equilibrium solubility. Again, these results could be product of dilution of the bottom waters with surface water.
Tritium
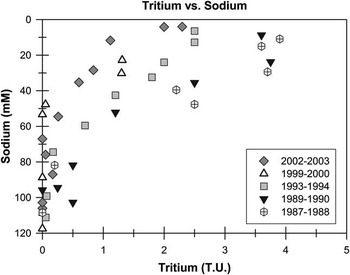
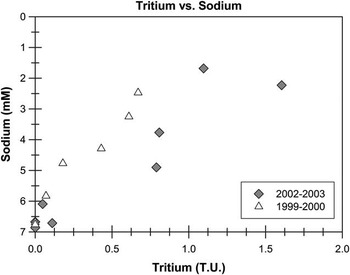
Figures 5 & 6 plot tritium vs depth for Lake Fryxell and Lake Hoare, respectively. There are five different sets of data for Lake Fryxell and two for Lake Hoare, collected by different investigations since 1987. Both lakes show a similar decrease in tritium with increased depth. The tritium values from the 2002–03 sampling indicate that the water above the chemocline has not been sufficiently mixed. We interpret that this is due to the large input of water during 2001–02 high water year.
Lake Fryxell: tritium vs sodium for the 1987–88, 1989–90, 1993–94, 1999–2000 and 2002–03 summers. TU = tritium unit. Data sources: this study, Hood et al. (Reference Hood, Howes and Jenkins1998) and Tyler et al. (Reference Tyler, Cook, Butt, Thomas, Doran and Lyons1998).

Lake Hoare: tritium vs sodium for the 1999–2000 and 2002–03 summers. TU = tritium unit.

In 1999–2000 (the first year of tritium data for Lake Hoare), Lake Fryxell had higher tritium values in the upper layers and the chemocline than Lake Hoare. However, in 2002–03, the tritium concentrations were similar in both lakes, possibly reflecting a similar source of ‘old’ glacial meltwater from the recent high inflows of 2001–02. After the high inflow years (e.g. data from 2001–02, 1989–90 and 1986–87, where available), Lake Hoare shows increases in tritium in the bottom-most waters, suggesting that recent or ‘new’ water have been introduced. However, in Lake Fryxell, the samples did not have measurable amounts of tritium, and the data indicate the surface waters have not been transported to depth. Tritium decay curves from 1987 to 2002 indicate that there is no ‘new’ water being added to the bottom waters of Lake Fryxell.
Chlorofluorocarbons
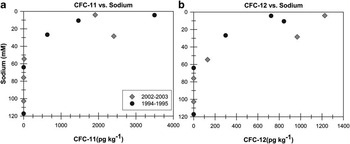
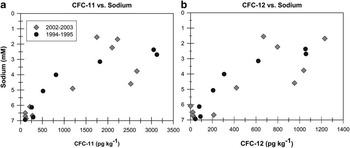
Figures 7 & 8 display the CFC-11 and CFC-12 data for Lake Fryxell and Lake Hoare, respectively. Both lakes show an overall exponential decrease of CFC concentrations with increased depth. Measurable CFC-11 and CFC-12 were observed throughout the water column in Lake Hoare (Fig. 8). Near the ice–water interface, the data from 2002–03 are more variable than those from 1994–95. Again, the 2002–03 data suggest that the water column above the chemocline is no longer well-mixed, most likely due to the large volume of water introduced during the high meltwater year of 2001–02. For Lake Hoare, this volumetric increase was c. 11 x 106 m3 (Doran et al. Reference Doran, Mckay, Fountain, Nylen, McKnight, Jaros and Barrett2008). This water primarily comes from the direct melting of the Canada Glacier (Fig. 1) so that the melted ice may not have any contact with the atmosphere prior to entering the lake.
Lake Fryxell: chlorofluorocarbons (CFCs) vs sodium for the 1994–95 and 2002–03 summers. a. CFC-11 vs sodium. b. CFC-12 vs sodium. Data sources: this study and Tyler et al. (Reference Tyler, Cook, Butt, Thomas, Doran and Lyons1998).

Lake Hoare: chlorofluorocarbons (CFCs) vs sodium for the 1994–95 and 2002–03 summers. a. CFC-11 vs sodium. b. CFC-12 vs sodium. Data sources: this study and Tyler et al. (Reference Tyler, Cook, Butt, Thomas, Doran and Lyons1998).

The higher concentrations of CFC-11 and CFC-12 below the chemocline in Lake Hoare are consistent with the dissolved gas and tritium data, suggesting that there has been movement of post-nuclear-age air-equilibrated water (< 50 years) to below the chemocline, possibly due to density driven currents. As with the tritium, the CFCs measured in the bottom waters of Lake Hoare cannot be explained by only diffusion from above or below the chemocline. In Lake Fryxell, there is a considerable decline of CFC values below the chemocline in the anoxic portion of the lake. No CFC-11 is measured below the chemocline and no CFC-12 is detected 13 m or below for both the 2002–03 and 1994–95 sampling seasons. As there was no measurable tritium in 2002–03, it is unlikely that CFCs have been transported to deeper depths in Lake Fryxell.
Discussion
Model
Processes beyond the air–water equilibrium affect the concentrations of dissolved gas in polar lake water. The cold and dry climate of Taylor Valley, the perennial ice covers, and the freezing and thawing of the moats of Lake Hoare and Lake Fryxell all have potential effects on the dissolved gas concentrations measured in the lake water columns. Colder recharge temperatures will yield higher dissolved gas concentrations, and noble gas ratios are affected by freezing. Other processes such as mixing of different aged waters, diffusion and lake circulation can affect the concentrations and ratios of the dissolved gas (Plummer & Busenberg Reference Plummer and Busenberg2000, Solomon et al. Reference Solomon, Cook and Sanford1998).
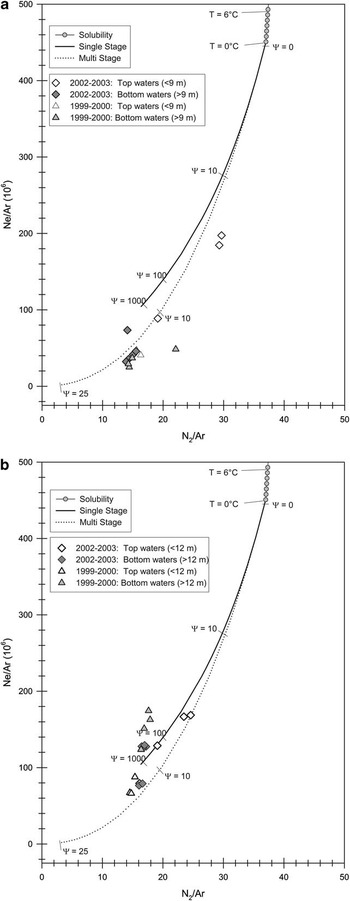
As water freezes to the bottom of the ice cover, the less soluble gases reach concentrations that exceed solubility and bubbles form that become trapped within the ice (which is approximately 10% air by volume). It is the lighter gases (e.g. He, Ne and N2) that typically partition into the bubbles in the ice lattice. This preference for the incorporation of lighter gas in the ice crystal lattice results in the remaining liquid water being more enriched in heavier gas (e.g. Ar). Craig et al. (Reference Craig, Wharton and McKay1991) determined the gas enrichment in liquid water by modelling bubble formation in the Lake Hoare ice cover using a single phase partitioning model. In Fig. 9a & b, we fit the Ne/Ar and N2/Ar data from Lake Fryxell and Lake Hoare to the model of Craig et al. (Reference Craig, Wharton and McKay1991) (where Ψ equals the ratio of gas volume to liquid water in cc STP litre-1 in the single stage partitioning model). The N2/Ar vs Ne/Ar plots for 1999–2000 and 2002–03 show that ice formation in the surface waters of Lake Hoare and Lake Fryxell concentrated the gases in the residual waters.
Lake Fryxell and Lake Hoare: N2/Ar vs Ne/Ar. The solid curve is the single stage trajectory and the dotted curve is the multi-stage trajectory for ice formation and gas loss using the model of Craig et al. (Reference Craig, Wharton and McKay1991). Ψ is the gas/fluid ratio that tracks the extent of ice formation and bubble entrapment. a. Lake Fryxell. b. Lake Hoare.

The effects of ice formation on the dissolved gas chemistry differ between the lakes and vary between the two summers within the same lake. Even though the dissolved gas concentrations in Lake Fryxell vary between 1999–2000 and 2002–03, the data support a continuous (or multi-stage) partitioning model in which the dissolved gases partition into the void space between the ice crystals in an infinite series of steps. The shallow 2002–03 samples from Lake Fryxell show some input of ‘new’ water (from the 2001–02 flood year) that has not undergone extensive freezing and thawing cycles similar to the 1999–2000 or deep 2002–03 samples. The deep water samples from both summers do not exhibit the dilution effects from surface waters.
The high meltwater year of 2001–02 altered the dissolved gas chemistry differently in the two lakes. In Lake Hoare, all 2002–03 surface water samples (≤ 6 m) lie along the single stage model in which the dissolved gases partition into ice crystals in one step (Fig. 9b). These data indicate incomplete ice formation from ‘new’ water. ‘New’ water at depth in Lake Hoare could be derived from the direct input of water from Canada Glacier in addition to potential density currents. The 1999–2000 surface water (< 12 m) and some of the 2002–03 bottom water (10–12 m) plot on the multi-stage partitioning model, demonstrating that these waters have undergone a sequence of freeze–thaw cycles. The data from deep water indicate that they have been diluted with surface water.
Upper water column mixing
Tyler et al. (Reference Tyler, Cook, Butt, Thomas, Doran and Lyons1998) developed a model to predict residence times of the upper mixed layer of Lake Hoare and Lake Fryxell using CFC concentrations. For a well-mixed reservoir, each year's input contributes to the mean concentration, resulting in an inverse exponential function. The contribution from any past year is diminished exponentially with time. By using Tyler et al. (Reference Tyler, Cook, Butt, Thomas, Doran and Lyons1998) factor of concentration (F(t)) equation, we calculated the residence time of the upper layers of these two lakes. Due to the high meltwater year, there is no longer a uniformity of concentrations within the very upper parts of the water column (0.5–1 m in Lake Hoare), which suggests that this equation cannot be applied. However, at slightly lower depths (e.g. 5–6 m in Lake Hoare), there is an area of homogeneous concentration and its calculated residence time has been increased from 25 years to 37 years, which indicates that this ‘new’ water input is an important influence on the residence time of the well-mixed upper water columns. Over time, it is probable that the unmixed layer of freshwater is incorporated into the lower mixed layer through repeated freezing, summer ice surface melting and stream inputs, and will reduce the residence time closer to 25 years as calculated by Tyler et al. (Reference Tyler, Cook, Butt, Thomas, Doran and Lyons1998).
Lower water column mixing
Based on the multiple years of data, there is no evidence found for lower water column mixing in Lake Fryxell. However, the changes in the noble gas values, as well as the presence of CFC levels, in the bottom waters of Lake Hoare confirm the previous work of Tyler et al. (Reference Tyler, Cook, Butt, Thomas, Doran and Lyons1998). Some of the ‘new’ moat water is excluded from ice formation, becomes denser as the solutes are cryo-concentrated, and sink below the chemocline as density currents. In Fig. 4a–c, the 4He, Ne and Ar concentrations at the bottom of Lake Hoare are more concentrated during the 1999–2000 than the 2002–03 season, indicating the bottom waters were diluted after the influx of the water pulse. The complementary occurrence of tritium and CFCs below the chemocline suggests that there has been water movement of some post-nuclear-age water (< 50 years) to the bottom of lake. Tyler et al. (Reference Tyler, Cook, Butt, Thomas, Doran and Lyons1998) suggested that the cluster of values seen above the chemocline in 1994–95 resulted from this interval being well-mixed from repeated freezing, ice cracking, ice surface melting during the summer and meltwater-stream inputs, and used a simple diffusion model to explain the observed profiles of CFC-11, CFC-12 and CFC-113 in Lake Hoare. Their models were unable to predict either the profile shapes or the concentrations without using unrealistic diffusion coefficients. Simple diffusion can neither explain the dilution of the noble gases nor the existence of tritium and CFCs at the base of Lake Hoare. To produce the profiles for CFCs and tritium observed in the bottom waters of Lake Hoare, another transport mechanism is needed.
Our data strongly indicate some vertical mixing is occurring in Lake Hoare. Lake Hoare is a relatively freshwater lake with small overall changes in density with depth, therefore advection could take place. An alternative mechanism for mixing is buoyancy-induced convection, such as density currents. The role of density currents is an important mechanism for bringing surface water to depth in these lakes. It is possible to estimate the amount of surface water transported to the bottom of Lake Hoare by using concentrations of sodium, tritium and CFCs, and a simple mixing model. During the 2000–01 summer and autumn, we estimate that only a small amount of surface water (0.1–1.5%) was transported downwards in Lake Hoare.
Tyler et al. (Reference Tyler, Cook, Butt, Thomas, Doran and Lyons1998) argues that the density current mechanism in Lake Hoare may be overwhelmed by induced advection from Canada Glacier. We favour density currents as the source for CFCs measured at the bottom of Lake Hoare and not the direct input of melt from Canada Glacier because it could not introduce the tritium- and CFC-enriched water observed in Lake Hoare.
Based on the observed profiles, the density currents may not be constant over time. There are summers when moats are small or do not form at all. In these cases, little or no dense water is developed or the water is not dense enough to sink and flow (Miller & Aiken Reference Miller and Aiken1996). With an increase of stream water inflow (e.g. during the high meltwater year of 2001–02) the moats expand. Therefore, higher density waters develop during the moat re-freezing. We hypothesize that density driven mixing may only occur in Lake Hoare during warmer-than-usual summers when the moat is extensive. Hydrologic models suggest that these warming periods may be quasi-decadal events (Ebnet et al. Reference Ebnet, Fountain, Nylen, McKnight and Jaros2005).
Conclusions
Slight climatic variations can have dramatic effects on the hydrologic budgets of the lakes of the Dry Valleys. From 1991–2001, there was a slow decline in annual lake levels of Lake Hoare and Lake Fryxell because sublimation and evaporation rates were greater than the inputs of stream inflow and/or direct glacial melt. However, during the high meltwater year of 2001–02, the increased stream inflow and glacial melt caused the lakes to rise to the levels prior to 1991.
We have compiled all the data of dissolved gas, tritium and CFCs for Lake Fryxell and Lake Hoare to determine the effects of a high meltwater year on the lakes. The similarities between the CFC datasets in the upper water column indicate that the pulse of freshwater that flowed onto the lakes’ surfaces did not mix extensively with the existing water. Comparable findings for the upper water column were found with the dissolved gas and tritium data.
In Lake Hoare, the measurable CFC values at the bottom waters signify that ‘young’ water has mixed with the older bottom waters. The noble gas data clearly indicate that air-equilibrated surface waters diluted noble-gas enriched bottom waters during the high meltwater year. The probable mechanism for the transportation of surface waters to the bottom of the lakes is density currents. Based on a simple mixing model, 0.1–1.5% of surface water was transported downwards in Lake Hoare during the 2000–01 summer and autumn. However, the data indicate that these density currents, along with subsequent mixing, did not occur in Lake Fryxell.
The density currents in Lake Hoare are not constant with time. Due to the requirement for moat enlargement to generate the appropriate circumstances for density current formation, it is more probable for density currents to fully develop during high meltwater years. These density currents, while not constant, may have significant consequences on the chemistry and biology of the bottom waters of Lake Hoare over time.
The evolution of the lakes and the development of the density stratification are more complex than previously documented. Density currents, such as described in this paper, need to be included in future hydrologic modelling of Lake Hoare and when reconstructing its history.
Acknowledgements
We thank Peter Cable and Timothy Fitzgibbon for their assistance in the field, and Kathy Welch and Thomas Darrah for their assistance in the laboratory. Financial support was provided by National Science Foundation grants (OPP-0087915 and OPP-9813061), and logistical support was provided by Raytheon Polar Services. The constructive comments of the reviewers are also gratefully acknowledged.