




No CrossRef data available.
Article contents
Indices of slowness of information processing in head injury patients: Tests for selective attention related to ERP latencies
Published online by Cambridge University Press: 01 October 2004
Abstract
We explored the relation between neuropsychological (attention tests involving time constraints) and neurophysiological (N2 and P3 event-related potential (ERP) latencies) indices of slowness of information processing after closed head injury (CHI). A group of 44 CHI patients performed worse than healthy controls on most neuropsychological indices, and had significantly longer ERP latencies. Significant correlations between neuropsychological measures and ERP latencies were found only for the 3 subtasks of the Stroop test. In additional multiple regression analyses P3 latency appeared the best predictor in Stroop Color only. A possible explanation is that stimulus evaluation processes comprise a relatively large part of performance on this subtask. In Stroop Color-Word, response related processes are supposed to play a greater role, reducing the role of the preceding input related processes. The absence of significant correlations between P3 latency and scores on the other attention tests suggests a relatively small role of stimulus evaluation processes in these tasks, implying that these tasks are not sensitive to slowness of these processes. The Stroop test appears to be the only attention test administered in which slowness in stimulus evaluation processes requiring selective attention contributes significantly to the delay in final performance on the task. (JINS, 2004, 10, 851–861.)
Information
- Type
- Research Article
- Information
- Journal of the International Neuropsychological Society , Volume 10 , Issue 6 , October 2004 , pp. 851 - 861
- Copyright
- © 2004 The International Neuropsychological Society
INTRODUCTION
Slowness of information processing is a major consequence of a closed head injury of at least moderate severity (Brouwer, 1985; Ponsford & Kinsella, 1992; Richard Ferraro, 1996; Spikman et al., 1996; Stuss et al., 1989b). There are at least two categories of methods for measuring mental slowness: (1) clinical and experimental neuropsychological tests; and (2) neurophysiological methods. In this study, performance on neuropsychological tests that are considered to tap the selectivity dimension of attention was related to neurophysiological measurements in order to determine which brain processes are slowed when behavioral tasks demonstrate slowness of information processing.
Studies using neuropsychological tests thought to tap selectivity of attention under time pressure demonstrate poorer performance in patients than in healthy controls (Ponsford & Kinsella, 1992; Spikman et al., 1996; Stuss et al., 1989b; van Zomeren & Deelman, 1976, 1978). Selectivity of attention refers to the selection of relevant stimuli in an environment rich in potentially distracting information. According to the framework of attention which van Zomeren and Brouwer (1994) developed, the selectivity of attention expresses itself on a behavioral level as focused attention (the controlled processing of some stimuli at the expense of others) or as divided attention (the limited amount of attention must be shared when two or more tasks have to be performed simultaneously). Both constructs have been operationalized in different types of neuropsychological tests and tasks (Spikman et al., 1996). Spikman et al. (2001) performed a factor analytic study on a series of well known attention tests to investigate the construct validity of the concepts focused and divided attention. The authors concluded that the components found did not match the two hypothesized aspects of attention and that other factors affected performance on tests of attention, namely, the trade-off between speed and control that the subject makes while performing the task and the amount of structure the task offers, which influences this trade-off. Since tests differ with respect to the relative importance of these factors speed, control and structure, it is more informative to refer to such tests as tests of selective attention under time pressure. The poorer performance of moderately to severely injured CHI patients on this type of task can be explained almost entirely by a basic slowing of information processing, indicating that there are no specific deficits in the selectivity aspects of attention (Ponsford & Kinsella, 1992; Spikman et al., 1996). This slowness is still present in the chronic stage, that is, more than 1 year post trauma (Spikman et al., 1999; Stuss et al., 1989a; Van Zomeren & Deelman, 1976, 1978).
However, the poor performance of CHI patients on neuropsychological tests is the final result of slowing in various mental processes. Because these tests manipulate cognitive operations rather crudely, they do not allow an analysis of which aspects of information processing are slowed. There are several models which explain how information is processed. Structural models of information processing are based on the assumption that information processing can be described as a series of transformations carried out in fixed structures, whereas resource models are driven by the notion of variable activation: processing structures can be selectively activated in order to achieve efficient processing (Kok, 1997). An example of a structural, computational model is Sternberg's additive factor model, which divides information processing into four discrete stages: stimulus encoding, memory comparison (input stages concerning the selection of relevant stimuli), decision-making and response selection (output stages concerning the selection of the response). According to the additive factor model, these stages can be manipulated independently. Such manipulations in studies with patients with CHI (Schmitter-Edgecombe et al., 1992; Shum et al., 1990; Stockx & Gaillard, 1986) have yielded inconsistent conclusions with respect to the existence of a locus of slowness and the stage at which it may be found. Grön (1996) concluded that, although patients with CHI appeared to be generally slower in all cognitive operations, this slowness becomes more evident with increasing task complexity, and therefore, the output stages of decision making and response selection seem to contribute more to the slowing of the final RT.
With event-related potential recordings (ERP's), the electrical activity of the brain associated with various information processing operations can be monitored in real time. ERP's are influenced by mental processes such as attention to specific stimulus qualities, the relevance of the stimulus and the expectation that a particular stimulus will occur. Kok (1997) states that ERP's are composed of a sequence of separate components that overlap to some extent in time. The latency to the peak of a component is considered as the time required to activate certain subroutines in the brain, whereas amplitude variation is usually considered as an index of variation in intensity of the subroutine (Donchin et al., 1986a, 1986b; Kok, 1990). Several ERP components in the latency range between 100 and 600 ms have been found to be associated with selective attention (Hillyard & Picton, 1987; Kok, 1997, 2000). The N1 is an early negative potential which indexes basic processes related to automatic attention and attentional selection and which reflects the allocation of perceptual resources: its amplitude is larger for attended stimuli than for stimuli which are ignored (Kok, 1997). The N2 is considered a middle-latency potential, which reflects perceptual registration following earlier classification of the stimulus as relevant; its amplitude is thought to index the effort associated with categorization of the stimulus (Clark et al.,1992; Rugg et al., 1988). Several authors (Bokura et al., 2001; Falkenstein et al., 1999, 2002) consider the N2, elicited in frontal regions by means of a GoNogo task, as an indication of response inhibition, but Bruin et al. (2001) concluded that the traditional GoNogo N2 effect has to be explained in terms of response activation. This negative phase is followed by a late positive one, the P3 or P3b, with a latency range of 300–600 ms depending on the experimental manipulations. The P3 is usually larger at the posterior (parietal) scalp sites and is minimal at the frontal electrode. In so called ‘oddball’ tasks in which subjects are presented with rare and frequent stimuli in a random sequence, the P3 is generated by the occurrence of the rare stimuli, indicating that they have been identified as a target (Donchin, 1981; Donchin & Coles, 1988; Hillyard & Kutas, 1983; Hillyard et al., 1995; Kok, 1997, 2000). The P3 is thought to mark the end of the stimulus evaluation stages which precede the output stages of response selection and execution, although in fact response related processes can start before stimulus evaluation is finished (Donchin & Coles, 1988; McCarthy & Donchin, 1981). Interpretations of the cognitive processes reflected by the P3 stress that it probably results from a varied set of processes including working memory or context updating as well as selective attention (Picton, 1992).
Campbell and de Lugt (1995) state that while many different processes determine RT latency, only some of them determine P3 latency. Because it is affected primarily by stimulus evaluation processes and only minimally by response related processes, P3 latency is a potential indicator of slowness in the perceptual and evaluative attentional processes preceding response preparation. Slower task performance accompanied by an increased P3 latency indicates a delay in the selective attentional processes preceding response selection and preparation. Slower task performance in the absence of an increased P3 latency means that the slowness affects only the response related output processes.
Few studies have investigated the relationship between P3 latency and performance on neuropsychological tests tapping selectivity of attention under time pressure. Since a delay in P3 latency is thought to reflect a slower evaluation of the significance of stimuli, it is relevant to determine to what extent such a delay affects performance on specific neuropsychological tests used to predict performance in daily life activities. Potter et al. (2001) did not find longer P3 latencies in a group of patients with a mild head injury. However, many studies of neurophysiological processes in patients with moderate to severe CHI have found that these patients have longer P3 latencies than healthy controls, which indicates that stimulus evaluation processes take more time in seriously injured patients (Clark et al., 1992; Curry et al., 1996; Mazzini et al., 2001; Reinvang et al., 2000; Sangal & Sangal, 1996). Keren et al. (1998) found that P3 latency was related to severity of injury as indicated by the Glasgow Coma Scale (GCS) score. In a series of studies (Campbell et al., 1990; Rugg et al., 1988; Unsal & Segalowitz, 1995) it was found that RT differences between patient and control groups were consistently larger than those found for P3 latency. Clark et al. (1992) expected a correlation between RT and the latency of the ERP components N2 and P3 because all measures are indices of speed of information processing. They found that N2 and P3 latency were correlated with RT in the control group but not in the CHI group, suggesting a dissociation between the evaluation of stimulus information and the response to that information after CHI. Potter et al. (2002) investigated the effect of mild head injury on ERP correlates of Stroop task performance. They found no evidence of reduced amplitude of N2 or P3b deflections, but ERP negativity in the latency range of 350 to 450 ms was increased. This was interpreted as a sign of greater allocation of attention resources on this task. However, the latencies of the ERP's were not studied. As far as we know, no studies have investigated the relationship between P3 latency and neuropsychological tests in which speed of processing plays an essential role (other than RT tasks), in patients with moderate to severe CHI.
The present study describes a group of patients with moderate to severe CHI who were assessed repeatedly with a series of attention tests in the first year post injury. The initial deficits and recovery over time on these tests are described in previous reports (Spikman et al., 1996, 1999). A major conclusion from the first study pertained to the presence of specific deficits in focusing or dividing attention. For each test included, the main test variable, tapping the focusing or dividing of attention, was controlled for the influence of slowness of information processing by partialling out a basic test variable. It was found that, compared to healthy controls, patients with CHI were not specifically impaired on tests of attention and that their poorer performance could be explained in terms of a slowing of information processing: they were slower on all attentional test variables, regardless of the demand on selective attention. The major conclusion of the second study was that, after 1 year, despite some reduction in mental slowness, patients were still impaired compared to healthy controls. The present study concerns the fourth test session, which took place at 1 year post injury when patients were in the chronic stage of recovery. The aim of this study was to determine whether slower performance on any of these well known attention tests was associated with slowness in the N2 and/or the P3. Since the N2 and the P3 are thought to index the stimulus evaluation processing stages that precede the response related stages, this would allow a more specific interpretation of what these selective attention tests are exactly sensitive to.?1?
METHODS
Research Participants
A group of 44 closed head injured patients, admitted to the Academic Hospital in Groningen during a 5-year period, participated in this study. The criteria for inclusion were: age between 15 and 60 years, no history of previous neurological or psychiatric disturbance and a primary school education. The minimum duration of Post Traumatic Amnesia (PTA) was 1 day. Mean PTA duration was 6.8 days (SD 6.8; range 1–30 days) indicating moderately severe to very severe injury according to Russell's classification (1971). Glasgow Coma Scale (GSC) scores after stabilization were documented. About 20% (9 patients) had a score in the range 6–10, another 20% (9 patients) had a score of 11–12, and the remaining 60% (26 patients) had a score of 13–14. Patients were tested in the chronic stage, 1 year post injury.
For logistic reasons there were two different control groups. The control group for the neuropsychological test results (C1) consisted of 60 healthy subjects, matched for age, sex, educational, and professional level. This group was assessed with the same neuropsychological tests as the patient group. A second control group (C2) consisted of 36 healthy subjects (20 men and 16 women, who functioned as controls for the ERP data. Their mean age was 35.7 year (SD 12.6; range 19–67).
The mean age of the patients was 29.8 years (SD 12.6; range 16–59). The mean age of the control subjects in C1 was 28.5 years (SD 12.1; range 15–61). Educational and professional level were both measured on a 7-point scale; the higher score was taken as the best measure for the level of functioning (LOF). The mean score of the patients was 5.0 (SD 1.1; range 3–7) and of the control subjects 5.1 (SD 1.1; range 3–7). Sixty-four percent of the patient group and 60% of the control group was male. Statistical testing (Mann-Whitney U and chi-square tests) showed no difference between the patient group and C1 with respect to age, sex, and level of functioning. However, there was a significant difference between the patient group and C2 with respect to age. With regression analyses the influence of age was calculated for both N2 and P3, and it appeared that age was a significant predictor for P3 only (r = .41, t = 2.6, p < .05). The regression formula is given in the following section.
Materials and Procedure
The present report concerns one part of a longitudinal study investigating a broad range of cognitive functions after CHI. The study focused on measures of attention. Patients were tested repeatedly with the same battery in the 1st year post trauma. A healthy control group (C1) was tested at the same intervals. The ERP's were recorded during the fourth test session, which took place 12 months post injury (in the chronic stage) for the patient group. A previous study (Spikman et al., 1999) of retest effects due to repeated testing with the same battery had shown that, even when corrected for retest effects, significant differences between patients and controls persisted to the fourth test session.
The tests included were the following:
The Stroop Color-Word Test (Stroop, 1935)
The test (Stroop, 1935) was designed to assess the presence of focused attention deficits. It consists of three subtasks: reading 100 printed color names (Stroop Word), naming the colors of 100 printed blocks (Stroop Color), and naming the colors of 100 words that are themselves color names (Stroop Color–Word). The first two subtasks address well trained response tendencies and do not require much controlled attention. The third however does, because the automatic tendency to read the words has to be suppressed in order to name the colors. This requires careful processing of the correct aspect of the stimulus. Thus, focused attention is operationalized with this paradigm as response interference. The task is considered to be memory driven since the subject has to keep the purpose of the task constantly in mind in order to counter the automatized tendency to read the words (Spikman et al., 2001). The task offers little structure, because its purpose is not directly indicated by the task stimuli. It therefore requires a relatively high degree of conscious attentional control. The subject is instructed to perform the task as quickly as possible. The test performance is expressed in time in seconds needed for each subtask, yielding three variables, STW, STC and STCW, respectively. Error scores were not recorded.
The Paced Auditory Serial Addition Task (PASAT) (a modification of the PASAT of Gronwall & Sampson, 1974)
The PASAT (Gronwall & Sampson, 1974) is often referred to as a divided attention test because it addresses the ability to perform different subtasks simultaneously. In this study, a simple version was used in which tape-recorded one-digit numbers (ranging from 1–6) are presented at a fixed rate (paced). Subjects are required to add every pair of successive numbers and to give the answer immediately. This requires dividing attention between listening to stimuli, storing numbers in long-term memory, performing mental operations and responding. On the basis of a previous study (Spikman et al., 2001) the task is considered to be mainly memory driven, since the subject has to keep in mind constantly which operations have to be performed on the stimuli. However, the operations themselves (adding up two one-digit numbers in the range from 1–6) are so simple and well learned that these can be said to proceed automatically. An important component of correct task performance is the updating of working memory after each transformation in time to perform the next transformation, and it is this mental operation that requires conscious attentional control. The different subtasks involved (listening, storing, etc.) will overlap more when the rate of presentation is increased, which increases the task load. The task was presented at five different rates with interstimulus intervals of 3.2, 2.8, 2.4, 2.0 and 1.6 s, respectively. In each condition the subject is required to add 60 pairs of numbers. The dependent variable is the number of correct answers, with a maximum of 60 per subtask. The first condition was considered an extended practice condition. The last condition, with the smallest ISI and thus the most time pressure, was conceived as the best index of divided attention (see also Spikman et al., 1996). Conditions 2, 3 and 4 were grouped together, because, in this previous study, scores of patients and controls differed to the same extent in each of these conditions. The task thus yields three scores, PAS1, PAS2-4 and PAS5, respectively.
The Reaction Time Task (Van Zomeren, 1981)
This visual manual reaction task is extensively described by van Zomeren (1981). The apparatus was designed to enable reaction time to be split up into a decision component and a movement component. The decision time, recorded in milliseconds was taken as an index of speed of information processing. The instruction stresses the essence of the task: “React as quickly as possible.”
The task consists of four conditions administered in the sequence described below. In each of the visual conditions, a subject has to depress a central button until one of eight target lights (push buttons themselves) is presented. The subject must then release the central button and switch the target light off by depressing it. The interval between the moment that the target lights up and the moment the subject releases the button is the decision time. In the standard four-choice condition, the subject has to react to one of four possible target lights that are presented in a random sequence of 28 trials.
- In the distraction condition, the target lights are the same as in the four-choice condition, but this time the remaining four lights act as distractors. One distractor may light up simultaneously with one of the targets. The subject must inhibit the response to the non-target, and depress the target light. This task taps the ability to focus attention on a selective set of stimuli. However, attention must be directed not to an intrinsic aspect of a stimulus, but to its location. The subject has to determine the location of the target and the direction of the response, but not the response itself (depressing a button). The task thus provides considerable structure and hence can be considered to be mainly stimulus-driven, requiring little conscious attentional control.
- As a control condition for the subsequent dual-task, a simple auditory pedal reaction task, in which the subject has to react to 1400 Hz tones by pressing a foot pedal, was administered.
- The dual-task consists of the visual four-choice basic task combined with the simple auditory pedal reaction task. The subject does not know in advance whether the stimulus will be a light or a tone, and must switch quickly between two response modes, which taps the ability to divide attention between two different subtasks. The flexibility of response can be said to be stimulus-driven, because the task offers so much structure that it requires little conscious attentional control.
The measures analyzed were the medians of the reaction times in each of the conditions. In the dual task, the medians of both subtasks were summed to provide a single score. This resulted in the following variables: RT4, RTDIS, RTDUAL, and RTA, respectively.
The Trailmaking Test (Reitan, 1958)
This is a paper and pencil test (Reitan, 1958) designed to measure the speed of visual search and memory driven flexibility. The test consists of two versions. In the simple version, A, the subject has to draw an uninterrupted line between a series of randomly distributed circles, numbered from 1–25, in ascending order. In Version B, both numbers and letters are used to designate the circles and the subject has to alternate between the two types of stimulus in ascending order. Version B is often considered a measure of set switching, because the subject has to switch between two response modes and therefore attention has to be divided between two mental tracks. In both versions, the instruction is: “Perform the task as quickly as possible.” The dependent variables are the times to finish each of the versions, called TMT–A and TMT–B, respectively.
Event-related potentials (ERP's)
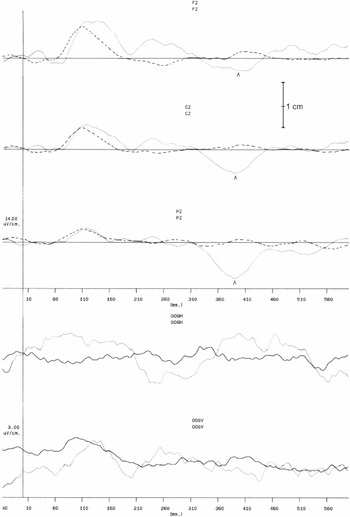
ERP's were recorded during an auditory task. Stimuli were presented according to an oddball paradigm in which a 1000-Hz tone occurred on 80% of trials and a 2000-Hz tone occurred on 20% of trials, in random order. Tone bursts (50 ms duration with 10 ms rise and fall times) at 65 dB HL were presented binaurally every 1.5 seconds through earphones. Subjects were instructed to count rare tones and to ignore frequent tones. Furthermore, they were instructed to keep their eyes open to minimize blinking or eye movements. Rest periods were provided between test runs as appropriate. After each run, patients reported the number of rare tones they had heard. Counting accuracy was defined as the difference between the total number of targets reported by the subject and the total number of targets administered. Counting accuracy varied from 0.92–1.14 with a mean of 1.00 and a SD of 0.044. Electroencephalograms were recorded from scalp electrodes placed at Fz, Cz, and Pz (according to the International 10–20 Electrode System) and were referenced to linked mastoids. Electrodes above and below the right eye were used to monitor eye movements. Sweeps in which the electro–oculographic activity exceeded a preset criterion were automatically rejected. Evoked potentials were averaged separately for the rare and frequent tones. In total, three blocks of 100 tones were administered. In cases of frequent blinking the block was repeated until a total of at least 25 blink-free target segments was obtained over all blocks. Segments with blinks were excluded from further analysis, artefact rejection was set at 10 μV. The responses were amplified with filters set at 0.2 and 30 Hz and were averaged separately for rare and frequent tones. Analysis time was 580 ms including 40 ms of pre-stimulus baseline. The interstimulus intervals were 1.5 s with 750 Hz sample frequency. The control group consisted of 36 healthy subjects with a mean age of 35.7 year (SD 12.6, range 19–67 years). P3 latency was considered abnormal when it exceeded the age-adjusted P3 latency + 2 SD [regression equation = 283 ms + 0.68 × age (SD = 19)]. In the control group mean P3 latency was 306.8 (SD 21.0, range 258–357) and mean N2 latency was 206.0 (SD 19.8, range 154–261). Typical recordings for CHI patients and normal controls are shown in Figures 1a and 1b.

P3 recording of a healthy control with a P3 latency of 295 ms. Plotted lines represent non-target tones and straight lines are target tones. X-axis = time (s) and Y = P3 latency (μV).

P3 recording of a patient with a P3 latency of 390 ms. The patient was a 35-year-old male, who had a PTA duration of 10 days. Plotted lines represent non-target tones and straight lines are target tones. X-axis = time (s) and Y = P3 latency (μV).
Component analysis: N2 and P3 components were analyzed in accordance with recommended standards (Goodin et al., 1994). P3 was defined as the largest positive peak occurring after the N1, P2, and N2 components that increased in amplitude from the frontal to parietal scalp areas after 250 ms. In case of bifurcated peaks, the second peak with a centroparietal maximum was selected for P3 latency determination. N2 was identified as the last negative component recorded with maximal amplitude on the midcentral and parietal regions preceding the P3 component. The N2 and P3 recordings were evaluated by an experienced neurophysiologist unaware of severity of injury or outcome of patients.
RESULTS
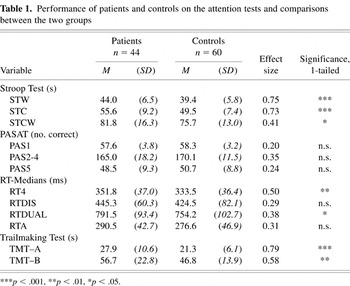
Table 1 shows the mean scores of the patient and control groups on each of the attention test variables. T tests were applied to determine the significance of the differences between the groups. Levene's test for equality of variances was applied to test the homogeneity of variance in the two groups. It was significant for PAS2-4, RT4 and TMT–A. Although the mean performance of the patient group on all measures appeared to be poorer than that of the controls, one-tailed t tests revealed that only the scores on the Stroop test, the RT four-choice task, the RT–dual task, and both parts of the Trailmaking test differed significantly. Because all tasks were performed under time pressure, this indicates that at 1 year posttrauma, patients are still slower than healthy controls. In order to appreciate the magnitude of the differences, effect sizes are shown: medium to large effect sizes are found for STW, STC, RT4 and TMT–A.
Performance of patients and controls on the attention tests and comparisons between the two groups

In the patient group, the mean N2 latency was 234.1 (SD 29.2, range 171–309) and the mean P3 latency was 346.1 (SD 30.3, range 287–421). These were significantly slower than in the control group: mean N2 latency 206.0 (SD 19.8); mean P3 latency 306.8 (SD 21.0) (p < .001). This indicates that, 1 year post trauma, the N2 and P3 deflections of the ERP's have longer latencies in patients with CHI than in healthy controls.
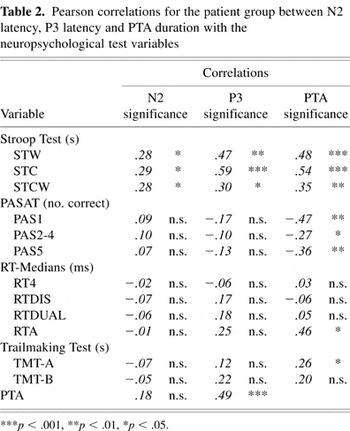
Table 2 shows the correlations of N2 and P3 latency with the scores on the neuropsychological tests. The correlations between PTA and both the ERP's and the neuropsychological test scores are also shown. Except for the three Stroop variables, no significant correlations were found between ERP latencies and neuropsychological test scores. Even the tests with auditory stimuli did not correlate significantly with the ERP latencies, also elicited in an auditory task. With respect to the Stroop variables, the Stroop Word and Stroop Color subtasks correlated more strongly with P3 than with N2. The correlation of the Stroop Color-Word subtask with P3 was lower than those of the Stroop Word and Stroop Color with P3, and was approximately equal to its correlation with N2. PTA correlated significantly with P3, but not with N2. Furthermore, significant correlations with PTA duration were found for all three Stroop variables, for all variables of the PASAT, for the RTA and for the TMT–A.
Pearson correlations for the patient group between N2 latency, P3 latency and PTA duration with the neuropsychological test variables

Both N2 and P3 latencies correlated with performance on the Stroop test variables. Multiple regression analyses were carried out to determine the relative contributions of the ERP's to performance on the Stroop test. PTA was also included as a predictor. Stroop Color was also included as a predictor in the analysis of Stroop Color-Word, because the two subtasks tap, to a large extent, the same cognitive processes (see also Spikman et al., 1996).
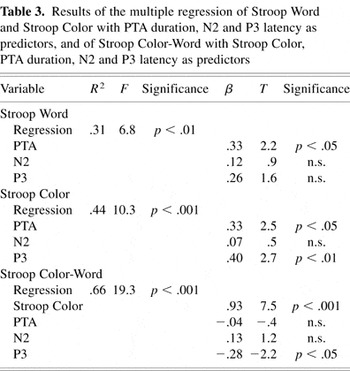
In Table 3, the regression equations for Stroop Word, Stroop Color and Stroop Color-Word respectively are shown. Only PTA duration contributed significantly to the performance in the Stroop Word condition, explaining 31% of the variance. The best predictor of performance in the Stroop Color condition was P3 latency, but PTA also contributed significantly. Together they explained 44% of the variance. Finally, Stroop Color score contributed significantly to performance on the Stroop Color-Word subtask, explaining 66% of the variance. The indirect effect of P3 latency has to be taken into account here. P3 latency made a significant contribution in the prediction of Stroop Color. This means that the significant direct negative contribution of P3 to the prediction of Stroop Color reduces the indirect positive contribution of Stroop Color slightly. The remaining variance can be conceived as representing at least partly the specific interference effects of the Stroop Color-Word subtask.
Results of the multiple regression of Stroop Word and Stroop Color with PTA duration, N2 and P3 latency as predictors, and of Stroop Color-Word with Stroop Color, PTA duration, N2 and P3 latency as predictors

DISCUSSION
One-year post-injury patients with CHI performed more poorly than healthy controls on several neuropsychological tests tapping the selectivity of attention under time pressure. This is consistent with conclusions from earlier studies (Spikman et al., 1996, 1999) and is considered to provide evidence for slowness of information processing in the chronic stage of recovery. Furthermore, severity of injury, as indicated by PTA duration, was associated with the Stroop scores, the PASAT scores and TMT–A. This indicates that, even for the PASAT scores, which did not differ significantly across the groups, severity of injury was related to poorer performance in patients. Apparently the PASAT can still be considered sensitive to the consequences of CHI at 1 year post trauma.
PTA duration was not found to be related to N2 latency, which is an indication of detection of a potentially relevant stimulus. However, it was associated with P3 latency, which marks the identification of targets requiring responses, preceding the output stages of decision making and response preparation. The finding that both N2 and P3 latency were increased in patients with CHI, but that only P3 latency was correlated to PTA duration, means that CHI in general affects these later stages of information processing, but that severity of injury influences P3 latency only. The significant correlations of N2 and P3 latency with the Stroop test scores show that slowing of stimulus identification and evaluation processes can only be demonstrated with this test and not with the other attention tests. Both ERP's were elicited in an oddball task, in which infrequent stimuli had to be detected and identified as targets, leading to a (covert) response (counting the targets silently). In the Stroop Word and Stroop Color subtasks, the stimuli are names of colors or colors themselves, which have to be read or named, respectively. The mental operations that have to be performed on the stimulus in order to find the correct response involve only the transfer from a visual to a verbal representation and do not require additional operations. These stimulus identification processes were found to be particularly slow in the Stroop Color subtask, which showed the highest correlation with P3 latency of all three Stroop scores and was most strongly predicted by P3 latency in the regression analysis. Probably, reading a color name is more automatized and thus requires less selective attention to be directed to stimulus identification than does naming a color, which takes more identification time as indicated by P3 latency. Nevertheless, these findings suggest that in both subtasks selective attention directed to output processes (response preparation and execution) makes up a relatively small part of the whole process.
However, it seems strange that the Stroop Color-Word subtask, a test that specifically requires attention to be focused on the evaluation of a single stimulus aspect, correlated least strongly with P3 latency. The regression analysis demonstrated that the Stroop Color score was a highly significant predictor of Stroop Color-Word score. The effect of P3 latency is taken into account in the effect of Stroop Color score, which means that P3 latency contributed indirectly to the prediction of Stroop Color-Word score. In addition, P3 latency made a small, significant negative contribution to the prediction, which slightly reduced the indirect positive contribution of Stroop Color. This means that the total contribution of P3 latency to the prediction of the Color-Word score is smaller than its contribution to the Color score. The significance of Stroop Color as a predictor demonstrates that the Color-Word subtask is very similar to the Color subtask because both tasks involve naming colors. However, the Color-Word subtask also includes an interference component because each of the stimuli whose color must be named, is printed in another color. Apparently, the interference does not slow the stimulus identification processes, which would have been visible in a stronger correlation with P3 latency. Rather, it mainly affects the duration of the output processes, which is seen in slower scores on the Color-Word subtask than on the Color subtask. This is consistent with the results of a study by Warren and Marsh (1979) with healthy subjects. They demonstrated that the interference effect of the Stroop Color-Word subtask was mainly attributable to response incompatibility, rather than to perceptual interference, because P3 latency was the same for the Color and for the Color-Word subtask, but the time required to perform the tasks differed significantly. This shows that subjects did not have difficulty identifying the stimuli in the Color-Word subtask as colors, so that their slower performance must be due to slowness in the selection of the correct response. It also shows that, in tasks requiring selective attention to be mainly directed to more complex output processes, the delay in the preceding perceptual processes becomes relatively smaller. This in turn might explain why no significant correlations were found between the ERP's and the other attention tasks. In most of these tests, rather complex operations have to be performed on stimuli to find the correct response. For example, the PASAT requires an arithmetic operation applied to the initial stimuli, in order to find the correct response. These tests may therefore draw less heavily on the selective attention processes involved in stimulus evaluation than on those involved in the preparation of a response to the stimuli.
This suggests that slowness on this type of attention test can be explained almost entirely by slowness in the output related stages of information processing involved in the preparation and execution of a response.
In conclusion, CHI thus affects the input stages of information processing related to identification and evaluation of a stimulus which are reflected in increased N2 and P3 latencies. Severity of injury affects P3 latency only. Heinze et al. (1992) conceive N2 as an exponent of parallel, automatic information processing reflecting feature analysis of the stimulus, whereas P3 is conceived to be an exponent of serial, controlled information processing reflecting feature conjunction and target identification. In their study they also found increased latencies of ERP measures in patients with chronic CHI. This was interpreted as an indication of CHI induced dysfunctions in both parallel, automatic and serial, controlled perceptual processes. Timmerman and Brouwer (1999) explain mental slowness in patients with CHI in terms of impaired access to declarative memory. This is the result of decreased strength of association between conceptual nodes of neuronal networks due to diffuse lesions of white matter. In their study, they convincingly demonstrated that the slower retrieval from declarative memory affects both early automatic as well as controlled selective attentional processes.
However, the slowness in the stimulus evaluation processes can only be demonstrated with neuropsychological tests or tasks that draw mainly on these processes and do not require a great deal of attention to be directed to response related output processes. When tasks require selective attention to be directed largely to output related processes, slowness in these processes appears to be the major determinant of the general slowness in information processing. Thus, tasks that tap output related processes in particular tend to mask the increased duration of the preceding input related stages. Our results appear to confirm the conclusions of Grön (1996). Patients with CHI in the chronic stage are slower in both the input and the output related stages of information processing. However, in tasks requiring complex operations to be performed on stimuli, the output related stages involved in the preparation and execution of the response contribute most to the slowing of the final reaction time.
ACKNOWLEDGMENTS
The authors would like to express their sincere thanks to Dr. Phillipa Butcher for her valuable contribution.
References
REFERENCES
Bokura, H.,
Yamaguchi, S., &
Kobayashi, S.
(2001).
Electrophysiological correlates for response inhibition in a
Go/NoGo task.
Clinical Neurophysiology,
112,
2224–2232.Google Scholar
Brouwer, W.H.
(1985).
Limitations of attention after closed head injury.
Doctoral dissertation,
State University of Groningen,
The Netherlands.
Bruin, K.J.,
Wijers, A.A., &
Staveren, A.S.J. van
(2001).
Response priming in a go/nogo task: Do we have to explain the
go/nogo N2 effect in terms of response activations instead of
inhibition?
Clinical Neurophysiology,
112,
1660–1671.Google Scholar
Campbell, K.B.,
Suffield, J.B., &
Deacon, D.L.
(1990).
Electrophysiological assessment of cognitive disorder in closed
head-injured patients. In
P.M. Rossini &
F. Mauguiere (Eds.),
New trends and advanced techniques in clinical
neurophysiology (pp.
202–215).
Amsterdam:
Elsevier.
Campbell, K.B. &
de Lugt, D.R.
(1995).
Event-related potential measures of cognitive deficits following
closed head injury. In
R. Johnson, Jr., &
J.C. Baron (Eds.),
Handbook of neuropsychology,
Volume 10 (pp.
269–298).
Amsterdam:
Elsevier.
Clark, C.R.,
O'Hanlon, A.P.,
Wright, M.J., &
Geffen, M.G.
(1992).
Event related potential measurement of deficits in information
processing following moderate to severe closed head injury.
Brain Injury,
6,
509–520.Google Scholar
Curry, S.H.,
Cummins, B.H.,
Eames, P.,
Rogers, D., &
Chaudhry-Dijkerman, S.
(1996).
The use of P300 as a mental chronometer in closed head injury
patients.
Electroencephalography and Clinical Neurophysiology,
46,
283–300.Google Scholar
Donchin, E.,
Karis, D.,
Bashore, T.R.,
Coles, M.G.H., &
Gratton, G.
(1986a).
Cognitive psychophysiology and human information processing. In
M.G.H. Coles,
E. Donchin, &
S. Porges (Eds.),
Psychophysiology: Systems, processes and applications (pp.
244–266).
New York:
Guilford Press.
Donchin, E.,
Kramer, A.F., &
Wickens, C.D.
(1986b).
Applications of brain event-related potentials to problems in
engineering psychology. In
M.G.H. Coles,
E. Donchin, &
S. Porges (Eds.),
Psychophysiology: Systems, processes and applications (pp.
702–778).
New York:
Guilford Press.
Donchin, E. &
Coles, M.G.H.
(1988).
Is the P300 component a manifestation of context updating?
Behavioral and Brain Sciences,
11,
355–372.Google Scholar
Falkenstein, M.,
Hoormann, J., &
Hohnsbein, J.
(1999).
ERP components in go/nogo tasks and their relation to
inhibition.
Acta Psychologica,
101,
267–291.Google Scholar
Falkenstein, M.,
Hoormann, J., &
Hohnsbein, J.
(2002).
Inhibition-related ERP components: Variation with modality, age,
and time-on-task.
Journal of Psychophysiology,
16,
167–175.Google Scholar
Ferraro, F.R.
(1996).
Cognitive slowing in closed-head injury.
Brain and Cognition,
32,
429–440.Google Scholar
Goodin, D.S.,
Desmedt, J.,
Maurer, K., &
Nuwer, M.R.
(1994).
IFCN recommended standards for long-latency auditory event related
potentials. Report of an IFCN committee.
Electroencephalography Clinical Neurophysiology,
91,
18–20.Google Scholar
Grön, G.
(1996).
Cognitive slowing in patients with acquired brain damage: An
experimental approach.
Journal of Clinical and Experimental Neuropsychology,
18,
406–415.Google Scholar
Gronwall, D. &
Sampson, H.
(1974).
The psychological effects of concussion.
Auckland, New Zealand:
Auckland University Press.
Heinze, H.J.,
Münte, T.F.,
Gobiet, W.,
Niemann, H., &
Ruff, R.M.
(1992).
Parallel and serial visual search after closed head injury:
Electrophysiological evidence for perceptual dysfunctions.
Neuropsychologia,
30,
495–514.Google Scholar
Hillyard, S.A. &
Kutas, M.
(1983).
Electrophysiology of cognitive processing.
Annual Review of Psychology,
34,
33–61.Google Scholar
Hillyard, S.A. &
Picton, T.W.
(1987).
Electrophysiology of cognition. In
V.B. Mountcastle,
F. Plum, &
S.R. Geiger (Eds.),
Handbook of physiology, Vol. V. Higher functions of the brain, Part
2 (pp.
519–584).
Bethesda, MD:
American Physiological Society.
Hillyard, S.A.,
Mangun, G.R.,
Woldorff, M.G., &
Luck, S.J.
(1995).
Neural systems mediating selective attention. In
M.S. Gazzaniga (Ed.),
The cognitive neurosciences (pp.
665–681).
Cambridge, MA:
MIT Press.
Keren, O.,
Ben-Dror, S.,
Stern, M.J.,
Goldberg, G., &
Groswasser, Z.
(1998).
Event-related potentials as an index of cognitive function during
recovery from severe closed head injury.
Journal of Head Trauma Rehabilitation,
13,
15–30.Google Scholar
Kok, A.
(1990).
Internal and external control: A two-factor model of amplitude
change of event-related potentials.
Acta Psychologica,
74,
203–236.Google Scholar
Kok, A.
(1997).
Event-related -potential (ERP) reflections of mental resources: A
review and synthesis.
Biological Psychology,
45,
19–56.Google Scholar
Kok, A.
(2000).
Age-related changes in involuntary and voluntary attention as
reflected in components of the event-related potential (ERP).
Biological Psychology,
54,
107–143.Google Scholar
Mazzini, L.,
Zaccala, M.,
Gareri, F.,
Giordano, A., &
Angelino, E.
(2001).
Archives of Physical and Medical Rehabilitation,
82,
57–65.
McCarthy, G. &
Donchin, E.
(1981).
A metric of thought: A comparison of P300 latency and reaction
time.
Science,
21,
171–186.Google Scholar
Picton, T.W.
(1992).
The P300 wave of the human event-related potential.
Journal of Clinical Neurophysiology,
9,
456–479.Google Scholar
Ponsford, J. &
Kinsella, G.
(1992).
Attentional deficits following closed head injury.
Journal of Clinical and Experimental Neuropsychology,
14,
822–838.Google Scholar
Potter, D.D.,
Bassett, M.R.A.,
Jory, S.H., &
Barrett, K.
(2001).
Changes in event-related potentials in a three-stimulus auditory
oddball task after mild head injury.
Neuropsychologia,
39,
1464–1472.Google Scholar
Potter, D.D.,
Jory, S.H.,
Bassett, M.R.A.,
Barrett, K., &
Mychalkiw, W.
(2002).
Effect of mild head injury on event-related potential correlates of
Stroop task performance.
Journal of the International Neuropsychological Society,
8,
828–837.Google Scholar
Reinvang, I.,
Norby, H., &
Nielsen, C.S.
(2000).
Information processing deficits in head injury assessed with
ERP's reflecting early and late processing stages.
Neuropsychologia,
38,
995–1005.Google Scholar
Reitan, R.M.
(1958).
Validity of the Trail Making Test as an indicator of organic brain
damage.
Perceptual and Motor Skills,
8,
271–276.Google Scholar
Rugg, M.D.,
Cowan, C.P.,
Nagy, M.E.,
Milner, A.D.,
Jacobson, I., &
Brooks, D.N.
(1988).
Event-related potentials from closed head injury patients in an
auditory “Oddball” task: Evidence of dysfunction in
stimulus categorisation.
Journal of Neurology, Neurosurgery and Psychiatry,
51,
691–698.Google Scholar
Russell, W.R.
(1971).
The traumatic amnesias.
London:
Oxford University Press.
Sangal, R.B. &
Sangal, J.M.
(1996).
Closed head injury patients with mild cognitive complaints without
neurological or psychiatric findings have abnormal visual P300
latencies.
Biological Psychiatry,
39,
305–307.Google Scholar
Schmitter-Edgecombe, M.E.,
Marks, W.,
Fahy, J.F., &
Long, C.J.
(1992).
Effects of severe closed-head injury on three stages of information
processing.
Journal of Clinical and Experimental Neuropsychology,
14,
717–737.Google Scholar
Shum, D.H.,
Mc Farland, K.,
Bain, J.D., &
Humphreys, M.S.
(1990).
Effects of closed-head injury on attentional processes: An
information processing stage analysis.
Journal of Clinical and Experimental Neuropsychology,
12,
247–264.Google Scholar
Spikman, J.M.,
van Zomeren, A.H., &
Deelman, B.G.
(1996).
Deficits of attention after closed-head injury: Slowness
only?
Journal of Clinical and Experimental Neuropsychology,
18,
755–767.Google Scholar
Spikman, J.M.,
Timmerman, M.E.,
van Zomeren, A.H., &
Deelman, B.G.
(1999).
Recovery versus retest effects in attention after closed head
injury.
Journal of Clinical and Experimental Neuropsychology,
21,
585–605.Google Scholar
Spikman, J.M.,
Kiers, H.A.L.,
Deelman, B.G., &
van Zomeren, A.H.
(2001).
Construct validity of concepts of attention in healthy controls and
patients with CHI.
Brain and Cognition,
47,
446–470.Google Scholar
Stockx, L.C. &
Gaillard, A.W.K.
(1986).
Task and driving performance of patients with a severe concussion
of the brain.
Journal of Clinical and Experimental Neuropsychology,
8,
421–436.Google Scholar
Stroop, J.R.
(1935).
Studies of interference in serial verbal reactions.
Journal of Experimental Psychology,
18,
643–662.Google Scholar
Stuss, D.T,
Stethem, L.L.,
Hugenholtz, H., &
Richard, M.T.
(1989a).
Traumatic brain injury: A comparison of three clinical tests and
analysis of recovery.
Clinical Neuropsychologist,
3,
145–156.Google Scholar
Stuss, D.T.,
Stethem, L.L.,
Hugenholtz, H.,
Picton, T.,
Pivik, J., &
Richard, M.T.
(1989b).
Reaction time after head injury: Fatigue, divided and focused
attention, and consistency of performance.
Journal of Neurology, Neurosurgery and Psychiatry,
52,
742–748.Google Scholar
Timmerman, M.E. &
Brouwer, W.H.
(1999).
Slow information processing after very severe closed head injury:
Impaired access to declarative knowledge and intact application and
acquisition of procedural knowledge.
Neuropsychologia,
37,
467–478.Google Scholar
Unsal, A. &
Segalowitz, S.J.
(1995).
Sources of P300 attenuation after head injury: Single-trial
amplitude, latency jitter, and EEG power.
Psychophysiology,
32,
249–256.Google Scholar
van Zomeren, A.H.
(1981).
Reaction time and attention after closed head injury.
Doctoral dissertation,
State University of Groningen,
the Netherlands.
van Zomeren, A.H. &
Brouwer, W.H.
(1994).
Clinical neuropsychology of attention.
New York:
Oxford University Press.
van Zomeren, A.H.,
Brouwer, W.H., &
Deelman, B.G.
(1984).
Attentional deficits: The riddles of selectivity, speed and
alertness. In
N. Brooks (Ed.),
Closed head injury; Psychological, social and family consequences.
Oxford, UK:
Oxford University Press.
van Zomeren, A.H. &
Deelman, B.G.
(1976).
Differential effects of simple and choice reaction time after
closed head injury.
Journal of Neurology, Neurosurgery, and Psychiatry,
41,
452–457.Google Scholar
van Zomeren, A.H. &
Deelman, B.G.
(1978).
Long term recovery of simple and choice reaction after closed head
injury.
Clinical Neurology and Neurosurgery,
79,
81–90.Google Scholar
Warren, L.R. &
Marsh, G.R.
(1979).
Changes in event-related potentials during processing of stroop
stimuli.
International Journal of Neurosciences,
9,
217–223.Google Scholar

P3 recording of a healthy control with a P3 latency of 295 ms. Plotted lines represent non-target tones and straight lines are target tones. X-axis = time (s) and Y = P3 latency (μV).
P3 recording of a patient with a P3 latency of 390 ms. The patient was a 35-year-old male, who had a PTA duration of 10 days. Plotted lines represent non-target tones and straight lines are target tones. X-axis = time (s) and Y = P3 latency (μV).
Performance of patients and controls on the attention tests and comparisons between the two groups
Pearson correlations for the patient group between N2 latency, P3 latency and PTA duration with the neuropsychological test variables
Results of the multiple regression of Stroop Word and Stroop Color with PTA duration, N2 and P3 latency as predictors, and of Stroop Color-Word with Stroop Color, PTA duration, N2 and P3 latency as predictors
 You have
Access
- 14
- Cited by