


1. Introduction
Landform evolution in tectonically active regions is governed by various processes, including tectonics, lithology, climate and sea-level change (Kirby and Whipple, Reference Kirby and Whipple2001; Keller and Pinter, Reference Keller and Pinter2002; Gaidzik and Ramírez-Herrera, Reference Gaidzik and Ramírez-Herrera2017). Understanding the relationships between landform deformation and active tectonic processes is fundamental to reconstructing the tectonic history of regions undergoing uplift and relief development (Burbank and Anderson, Reference Burbank and Anderson2012; Mahmood and Gloaguen, Reference Mahmood and Gloaguen2012). Geomorphometric investigations, based on the analysis of stream networks, drainage basin morphology and relief characteristics, represent a robust approach for assessing the relative influence of tectonic deformation and erosional processes on landscape evolution (Keller and Pinter, Reference Keller and Pinter1996; Montgomery et al. Reference Montgomery, Balco and Willett2001; Segura et al. Reference Segura, Pardo-Pascual, Rosselló, Fornós and Gelabert2007; Onosemuode et al. Reference Onosemuode, Adetimirin and Aboderin2010; Moumeni et al. Reference Moumeni, Delchiaro, Della Seta, Nozaem, Ballato, Leonard, Clementucci and Rouhi2024).
Cameroon offers a particularly suitable natural laboratory for such investigations. Its landscape is divided into distinct geomorphological units – the Low Cameroon Plateau, Coastal Plain, West Cameroon Highlands (WCH), Adamawa High Plateau and the Benue and Chad Troughs – all of which are crossed by active tectonic structures (Ségalen, Reference Ségalen1967; Owona et al. Reference Owona, Mbola Ndzana, Mvondo Ondoa, Nsangou Ngapna, NKabsaah, Ratschbacher and Ekodeck2012; Balla Ateba et al. Reference Balla Ateba, Owona, Nsangou, Manga, Minyem and Mvondo2021; Wabo Defo et al. Reference Wabo Defo, Owona, Nsangou Ngapna, Balla Ateba and Mwabanua Mutabi2022; Nsangou Ngapna et al. Reference Nsangou Ngapna, Owona, Balla Ateba, Mboudou and Wabo Defo2022, Reference Nsangou Ngapna, Owona, Mboudou, Balla Ateba and Wabo Defo2023, Reference Nsangou Ngapna, Balla Ateba and Owona2026 a, b). The WCH, in particular, exhibits a complex tectonic evolution, expressed by an uneven NE–SW stepped topography associated with the Cameroon Volcanic Line (CVL; Figure 1), which forms part of the Central African surface (Fitton and Dunlop, Reference Fitton and Dunlop1985; Boulvert, Reference Boulvert1996; Déruelle et al. Reference Déruelle, Ngounouno and Demaiffe2007; Njome and De Wit, Reference Njome and De Wit2014). This zone comprises several distinct morphological units that correlate with a variety of endogenous processes. Geologically, the area is underlain by a Precambrian basement, resulting from the Eburnean and Pan-African orogenies and overlain by the Cretaceous to Recent Mamfe Basin (Njonfang et al. Reference Njonfang, Ngako, Kwekam and Affaton2006; Djouka-Fonkoué et al. Reference Djouka-Fonkwé, Schulz, Schussler, Tchouankoué and Nzolang2008; Ngako et al. Reference Ngako, Affaton and Njonfang2008; Njiékak et al. Reference Njiékak, Dörr, Tchouankoué and Zulauf2008; Eyong et al. Reference Eyong, Wignall, Fontong, Best and Hell2013, Reference Eyong, Ngueutchoua, Bessong, Hell, Bokanda, Wignall and Best2019; Kwékam et al. Reference Kwékam, Talla, Fozing, Tcheumenak Kouémo, Dunkl and Njonfang2020). It is crossed by several active tectonic features (Figures 1 and 2), including the Tcholliré–Banyo, Foumban–Bankim and Central Cameroon shear zones (TBSZ, FBSZ, CCSZ; Ngako et al. Reference Ngako, Affaton, Nnangue and Njanko2003, Reference Ngako, Affaton and Njonfang2008; Njonfang et al. Reference Njonfang, Ngako, Kwekam and Affaton2006, Reference Njonfang, Ngako, Moreau, Affaton and Diot2008), the Benue Trough (Dumont et al. Reference Dumont, Toteu and Penaye1985; Benkhelil, Reference Benkhelil1988) and the Fodjomekwet–Fotouni Shear Zone (FFSZ; Kwékam et al. Reference Kwékam, Liégeois, Njonfang, Affaton, Hartmann and Tchoua2010; Njanko et al. Reference Njanko, Nédélec, Kwékam, Siqueira and Esteban2010; Tcheumenak Kouémo et al. Reference Tcheumenak Kouémo, Njanko, Kwékam, Naba, Bella Nké, Yakeu Sandjo, Fozing and Njonfang2014). During the Miocene, the main reactivations of the Benue Triple Junction (BTJ), which includes the Mamfe basin, provided further evidence of neotectonic activity affecting the region (Ambraseys and Adams, Reference Ambraseys and Adams1986; Ambeh et al. Reference Ambeh, Fairhead and Stuart1988; Benkhelil, Reference Benkhelil1988; Unternehr et al. Reference Unternehr, Curie, Olivet, Goslin and Beuzart1988; Guiraud, Reference Guiraud1991).
Geological framework of the study area. (a) Simplified geologic sketch of Africa; (b) geological map of the Western Cameroon Highlands margin showing the study area (modified after Toteu et al. Reference Toteu, Van Schmus, Penaye and Michard2001; Ngako et al. Reference Ngako, Affaton, Nnangue and Njanko2003; Thiéblemont et al. Reference Thiéblemont, Liégeois, Fernandez-Alonso, Ouabadi, Le Gall, Maury, Vidal, Ouattara, Tchameni, Michard, Nehlig, Rossi and Chêne2016); (c) geological map of the BMR (modified after Dumort, Reference Dumort1968); (d) chrono-lithostratigraphic columns of the Mamfe basin (modified after Le Fur, Reference Le Fur1965; Abolo, Reference Abolo2008; Eyong et al. Reference Eyong, Wignall, Fontong, Best and Hell2013). Abbreviations: MNSZ, Mayo Nolti Shear Zone; TBSZ, Tchollire-Banyo Shear Zone; CCSZ, Central Cameroon Shear Zone; SF, Sanaga Fault; FBSZ, Foumban-Bankim Shear Zone; CrF, Cross-River Fault; NgF, Nguti Fault; FFSZ, Fodjomekwet–Fotouni Shear Zone. In (b), the blue dashed corridor and the white solid line in (b) represent the Cameroon Volcanic Line (CVL) and the Cameroon–Nigeria boundary, respectively. The lithostratigraphic log in (d) comprises six members: the Esaghem/Munaya Member, conglomeratic and arkosic sandstones alternating with purple sandy mudstones; the Bagba Member, laminated purple-green mottled shales and marlstones alternating with cross-bedded sandstones; the Okoyong Member, cross-bedded sandstones and conglomerate layers downlapping onto the Nfaitok Formation; the Mamfe Member, laminated carbonaceous shales, siltstones, oolitic shales, marlstones, algal mats and volcanoclastics; the Manyu Member, siltstones and shales alternating with siliceous, calcareous and arkosic sandstones showing ripple and desiccation marks; and the Basai/Inokun Member, clast-supported conglomerates with basement-derived fragments alternating with arkosic sandstones showing crude cross-stratification and horizontal lamination. Cg1–Cg5 correspond to Le Fur’s stratigraphic subdivisions: Cg5: Cross-River Sandstone Series (Cenomanian?); Cg4: Cross-River Sandstone/Shale Series (Albian?); Cg3: Upper conglomeratic sandstone Series (Albian?); Cg2: Manyu sandstone/Shale Series (Albian?); Cg1: Lower conglomeratic Series (Albian).

Figure 1. Long description
Panel A: A simplified geologic sketch of Africa, showing major geological regions and features. The map includes the West African Craton, Saharan Metacraton, Congo Craton, Kalahari Craton, and various orogenic belts. Panel B: A geological map of the Western Cameroon Highlands margin, displaying different geological formations and features. The map includes faults such as the Mayo Nolti Shear Zone, Tchollire-Banyo Shear Zone, Central Cameroon Shear Zone, Sanaga Fault, Foumban-Bankim Shear Zone, Cross-River Fault, Nguti Fault, and Fodjomekwet-Fotouni Shear Zone. Various geological units are color-coded, including Quaternary sedimentary cover, Paleogene to Pleistocene sedimentary cover, Cenozoic volcanic cover, Upper Cretaceous sedimentary rocks, Lower Cretaceous sedimentary rocks, Neoproterozoic to Cambrian granitoids, Neoproterozoic metasedimentary rocks, and Paleoproterozoic migmatitic gneiss and granulites. The Cameroon Volcanic Line and the Cameroon-Nigeria boundary are also marked. Panel C: A detailed geological map of the Bamenda Mountain Range, showing specific geological formations and faults. The map includes areas such as Mamfe, Nguti, Nkambé, Santchou, and Bana, with various geological units color-coded. Panel D: A chrono-lithostratigraphic column of the Mamfe basin, showing different members and their lithological descriptions. The members include Esaghem/Munaya, Bagba, Okoyong, Mamfe, Manyu, and Basai/Inokun, each with specific lithological characteristics and stratigraphic subdivisions.
Geomorphological and tectonic setting of the study area. (a) Major African landform surfaces; (b) Western Cameroon Highlands margin (WCHM) showing principal tectonic structures (after Nsangou Ngapna et al. Reference Nsangou Ngapna, Owona, Balla Ateba, Mboudou and Wabo Defo2022, Reference Nsangou Ngapna, Balla Ateba and Owona2026a; Mbossi et al. Reference Mbossi, Ndibi, Abate Essi, Wokwenmendam, Ntepe, Meghraoui, Ateba and Tabod2026) and recorded earthquake epicentres since 1967 (after Ambraseys and Adams, Reference Ambraseys and Adams1986; Tabod et al. Reference Tabod Tabod, Fairhead, Stuart, Ateba and Ntepe1992; Elsheikh et al. Reference Elsheikh, Gao and Liu2014; Campbell et al. Reference Campbell, Lubkowski, Villani and Polidoro2018); (c) three-dimensional view of the study area with representative NW–SE and NE–SW topographic transects. Abbreviations as in Figure 1.

Previous geomorphological studies conducted in the WCH, using geomorphic and morphometric indices, have highlighted the combined influence of litho-structural and climatic controls on landscape evolution (e.g., Nsangou Ngapna et al. Reference Nsangou Ngapna, Owona, Balla Ateba, Mboudou and Wabo Defo2022; Wabo Defo et al. Reference Wabo Defo, Owona, Nsangou Ngapna, Balla Ateba and Mwabanua Mutabi2022). Several worldwide investigations have employed similar indices, using either the relative tectonic activity (IAT; Mahmood and Gloaguen, Reference Mahmood and Gloaguen2012; Anand and Pradhan, Reference Anand and Pradhan2019) or the Analytical Hierarchy Process (AHP; Argyriou et al. Reference Argyriou, Teeuw, Soupios and Sarris2017) methods to quantify tectonic activity. Subsequently, Saber et al. (Reference Saber, Isik and Caglayan2019) proposed a combination of IAT and AHP methods for the Aras drainage basin in NW Iran to refine the assessment of active tectonics. In Cameroon, comparable approaches based on IAT have been applied along the SW Atlantic coast (Nsangou Ngapna et al. Reference Nsangou Ngapna, Owona, Mvondo Owono, Balla Ateba, Manga Tsimi, Mvondo Ondoa and Ekodeck2020; Balla Ateba et al. Reference Balla Ateba, Nsangou, Owona and Mboudou2023; Onana et al. Reference Onana, Njom, Mvondo Owono, Yannah, Abou’ou and Mvondo Ondoa2023), while only one study has focused on testing the AHP model along the SW margin (Nsangou Ngapna et al. Reference Nsangou Ngapna, Owona and Balla Ateba2024). However, despite these advances, the spatial distribution of tectonic activity across the Bafoussam–Mamfe Region (BMR), which forms part of the WCH, remains poorly constrained. Moreover, existing results obtained in other regions remain debatable, partly due to methodological limitations when using a single assessment technique. Therefore, this study combines the IAT and AHP methods, together with field observations, to assess the relative tectonic activity of 117 drainage sub-basins in the BMR.
2. Geological and geomorphological frameworks
2.a. Geological framework
The geology of the BMR (5°–6°N; 9°–10°30′E) consists of a Precambrian basement, as well as Mesozoic and Tertiary to Recent sedimentary and volcanic units, respectively (Figure 1b and c). The basement includes two major geological domains. The first is the Rhyacian–Orosirian Nyong Complex (NyC), formed during the Eburnean/Trans-Amazonian orogeny between 2.2 and 2.0 Ga (Toteu et al. Reference Toteu, Van Schmus, Penaye and Nyobe1994; Feybesse et al. Reference Feybesse, Johan, Triboulet, Guerrot, Mayaga-Mikolo, Bouchot and N’dong1998; Lerouge et al. Reference Lerouge, Coherie, Toteu, Penaye, Milesi, Tchameni, Nsifa, Fanny and Deloule2006; Loose and Schenck, Reference Loose and Schenk2018; Houketchouang Bouyo et al. Reference Houketchang Bouyo, Penaye, Mouri and Toteu2019; Owona et al. Reference Owona, Ratschbacher, Afzal, Nsangou Ngapna, Mvondo Ondoa and Ekodeck2020, Reference Owona, Schulz, Minyem, Ratschbacher, Chako Tchamabe, Olinga, Mvondo Ondoa and Ekodeck2022). The second is the Cryogenian–Ediacaran North Equatorial Orogenic Belt (NEOB), related to the Pan-African/Brasiliano orogeny (0.65–0.54 Ga) (Penaye et al. Reference Penaye, Toteu, Tchameni, Van Schmus, Tchakounté, Ganwa, Minyem and Nsifa2004; Njonfang et al. Reference Njonfang, Ngako, Kwekam and Affaton2006, Reference Njonfang, Ngako, Moreau, Affaton and Diot2008; Kwékam et al. Reference Kwékam, Liégeois, Njonfang, Affaton, Hartmann and Tchoua2010; Njanko et al. Reference Njanko, Nédélec, Kwékam, Siqueira and Esteban2010; Caxito et al. Reference Caxito, Santos, Ganade, Bendaoud, Fettous and Bouyo Houketchang2020; Owona et al. Reference Owona, Ratschbacher, Nsangou Ngapna, Gulzar, Jand and Ekodeck2021). The volcanic deposits are associated with the Paleocene to Recent CVL, an active N30°E-trending structure extending over ∼1600 km (Tchoua, Reference Tchoua1974; Fitton and Dunlop, Reference Fitton and Dunlop1985; Déruelle et al. Reference Déruelle, Ngounouno and Demaiffe2007; Njome and De Wit, Reference Njome and De Wit2014).
In the northwestern part of the study area, the Cretaceous Mamfe Basin overlies the metamorphic basement (Eyong et al. Reference Eyong, Wignall, Fontong, Best and Hell2013, Reference Eyong, Ngueutchoua, Bessong, Hell, Bokanda, Wignall and Best2019; Njoh et al. Reference Njoh, Nforsi and Datcheu2015; Njoh and Njie, Reference Njoh and Njie2016; Kanouo et al. Reference Kanouo, Njonfang, Kouské, Yongue and Ngeutchoua2017, Reference Kanouo, Kouské, Lentz and Yongué2021; Bokanda Ekoko et al. Reference Bokanda Ekoko, Fralick, Ekomane, Njilah Isaac, Bisse, Akono and Ekoa Bessa2018). This basin represents the main sedimentary domain within the BMR.
2.a.1. Precambrian basement
The study area is underlain by Pre- to Post-Cambrian basement rocks composed of metamorphic and plutonic lithologies (Toteu et al. Reference Toteu, Van Schmus, Penaye and Nyobe1994; Njonfang and Moreau, Reference Njonfang and Moreau2000; Penaye et al. Reference Penaye, Toteu, Tchameni, Van Schmus, Tchakounté, Ganwa, Minyem and Nsifa2004; Njonfang et al. Reference Njonfang, Ngako, Kwekam and Affaton2006, Reference Njonfang, Ngako, Moreau, Affaton and Diot2008). These rocks include hornblende–biotite gneisses, banded garnet–sillimanite–pyroxene gneisses, amphibolites, migmatitic granites and mylonites (Figure 1c). They are mainly the result of the Pan-African tectonothermal event that affected the West Cameroon domain (Njiékak et al. Reference Njiékak, Dörr, Tchouankoué and Zulauf2008; Kwékam et al. Reference Kwékam, Liégeois, Njonfang, Affaton, Hartmann and Tchoua2010, Reference Kwékam, Hartmann, Njanko, Tcheumenak Kouémo, Fozing and Njonfang2015; Yakeu Sandjo et al. Reference Yakeu Sandjo, Njanko, Njonfang, Errami, Rochette and Fozing2016; Fozing et al. Reference Fozing, Kwékam, Gountié Dedzo, Asaah Asobo, Njanko, Tcheumenak Kouémo, Efon Awoum and Njonfang2019).
Based on their structural relationships with Pan-African deformation phases, granitoids are subdivided into three groups: (1) pre- to syn-D1 granitoids dated at 630–620 Ma, (2) syn-D2 granitoids dated at 600–580 Ma and (3) post-orogenic granitoids dated at approximately 550 Ma (U-Pb zircon ages; Toteu et al. Reference Toteu, Van Schmus, Penaye and Michard2001, Reference Toteu, De Wit, Penaye, Drost, Tait, Bouyo Houketchang, Van Schmus, Jelsma, Moloto-A-Kenguemba, Da Silva Filho, Lerouge and Doucouré2022). These granitoids are predominantly syn-shear to post-collisional in character (Nguiessi-Tchankam et al. Reference Nguiessi Tchankam, Nzenti, Nsifa Nkonguin, Tempier and Tchoua1997; Njiékak et al. Reference Njiékak, Dörr, Tchouankoué and Zulauf2008; Njanko et al. Reference Njanko, Nédélec, Kwékam, Siqueira and Esteban2010; Kwékam et al. Reference Kwékam, Liégeois, Njonfang, Affaton, Hartmann and Tchoua2010, Reference Kwékam, Talla, Fozing, Tcheumenak Kouémo, Dunkl and Njonfang2020).
2.a.2. Sedimentary formations
The Mamfe Basin is a tectono-sedimentary structure formed during the Early Cretaceous following the break-up of Gondwana and the opening of the South Atlantic Ocean (Fairhead and Okereke, Reference Fairhead and Okereke1987; Popoff, Reference Popoff1988; Eseme et al. Reference Eseme, Agyingi and Foba-Tendo2002; Nguimbous-Kouoh et al. Reference Nguimbous-Kouoh, Takougang Takam, Nouayou, Tabod Tabod and Manguelle-Dicoum2012). It constitutes a WNW–ESE-trending intracontinental segment of the Benue Trough (Figure 1b and c; Dumort, Reference Dumort1968; Ajonina et al. Reference Ajonina, Ajibola and Bassey2001). Basin development was controlled by rifting during the Upper Albian–Lower Cenomanian, accompanied by rapid tectonic subsidence linked to lithospheric thinning and subsequent thermal recovery (Olade, Reference Olade1975; Fairhead and Okereke, Reference Fairhead and Okereke1990; Ajonina et al. Reference Ajonina, Ajibola and Bassey2001).
Although the chronostratigraphy and lithostratigraphic nomenclature of the Mamfe Basin remain debated, the deposits are commonly grouped into the Ngeme, Nfaitok, Baso and Cross River formations (Figure 1d; Eyong et al. Reference Eyong, Wignall, Fontong, Best and Hell2013). Sedimentation began during the Albian (Dumort, Reference Dumort1968; Eseme et al. Reference Eseme, Agyingi and Foba-Tendo2002, Reference Eseme, Littke and Agyingi2006) and is dominated by continental clastic deposits, including conglomerates, sandstones, arkoses, marlstones, siltstones, mudstones and shales. Local limestones and evaporites also occur (Wilson, Reference Wilson1928; Le Fur, Reference Le Fur1965; Dumort, Reference Dumort1968; Ajonina and Bassey, Reference Ajonina and Bassey1997; Eyong, Reference Eyong2003; Njoh et al. Reference Njoh, Nforsi and Datcheu2015; Bokanda Ekoko et al. Reference Bokanda Ekoko, Fralick, Ekomane, Njilah Isaac, Bisse, Akono and Ekoa Bessa2018; Ngueutchoua et al. Reference Ngueutchoua, Ekoa Bessa, Eyong Taken, Demanou Zandjiob, Djaoroa Baba and Tchami Nfada2019). These sediments contain organic matter and exhibit potential for hydrocarbon generation (Abolo, Reference Abolo2008; Njoh and Njie, Reference Njoh and Njie2016).
2.a.3. Volcanic cover
The most recent geological events in the study area are related to the Paleocene to present (<65 Ma) tectono-magmatic activity of the CVL. This N30°E-trending megastructure (Figures 1b and 2b) extends over 1600 km and is about 100 km wide. It exerts a strong control on the geomorphology of western Central Africa (Dumort, Reference Dumort1968; Tchoua, Reference Tchoua1974; Déruelle et al. Reference Déruelle, Ngounouno and Demaiffe2007).
In its continental segment, the CVL consists of a succession of grabens and horsts extending from Mount Etinde and Mount Cameroon to Lake Chad (Moreau et al. Reference Moreau, Regnoult, Déruelle and Robineau1987; Déruelle et al. Reference Déruelle, N’ni and Kambou1987, Reference Déruelle, Moreau, Nkoumbou, Kambou, Lissom, Njonfang, Ghogomu and Nono1991). These features host volcanic fields, stratovolcanoes and plutonic–volcanic complexes (Déruelle et al. Reference Déruelle, Moreau, Nkoumbou, Kambou, Lissom, Njonfang, Ghogomu and Nono1991). Volcanic rocks along the CVL include nephelinites, basanites, alkali basalts, phonolites, trachytes, rhyolites, ignimbrites, ash deposits and lapilli (Fitton and Dunlop, Reference Fitton and Dunlop1985; Ngounouno and Déruelle, Reference Ngounouno and Déruelle1997; Montigny et al. Reference Montigny, Ngounouno and Déruelle2004; Déruelle et al. Reference Déruelle, Ngounouno and Demaiffe2007; Asaah et al. Reference Asaah, Yokoyama, Aka, Usui, Wirmvem, Tchamabe, Ohba, Tanyileke and Hell2015). Plutonic rocks range in composition from gabbro to granite (Njonfang and Moreau, Reference Njonfang and Moreau2000; Njome and De Wit, Reference Njome and De Wit2014).
The origin of the CVL remains widely debated. Based on a review of geophysical studies conducted over the past four decades, Adams (Reference Adams2022) evaluated several geodynamic models proposed for its formation. Current evidence favours two main models for the continental segment: (1) Edge-Driven Convection (EDC) (King and Anderson, Reference King and Anderson1998; King and Ritsema, Reference King and Ritsema2000) and (2) Lithospheric Instability (LI) (Milleli et al. Reference Milelli, Fourel and Jaupart2012). The EDC model emphasises variations in lithospheric thickness. Temperature gradients between the thick lithospheric root of the Congo Craton and the thinner lithosphere beneath the CVL may induce lateral sub-lithospheric mantle flow. Buoyant material migrates toward thinner lithospheric domains, promoting magmatism (King and Anderson, Reference King and Anderson1998; King and Ritsema, Reference King and Ritsema2000; Adams, Reference Adams2022). The LI model proposes that the Y-shaped geometry of the CVL marks the boundaries between distinct convective systems driven by contrasts in oceanic and continental lithospheric thickness (Milleli et al. Reference Milelli, Fourel and Jaupart2012).
More recently, Che Ngu and Njinju (Reference Che Ngu and Njinju2025) proposed a dynamic plume-related model. In this scenario, a rising mantle plume is deflected by a delaminated mantle body beneath the thin continental lithosphere. Melt generated from the hot plume material ascends through lithospheric-scale shear zones, facilitating volcanic activity. Saeidi et al. (Reference Saeidi, Hansen and Nyblade2023), based on a new P-wave tomographic model of the African mantle, have linked CVL magmatism to the African Large Low Velocity Province (LLVP) located in the lower mantle beneath southern Africa. Their findings establish a connection between the LLVP and the continental segment of the CVL, suggesting deep mantle control on magmatic processes.
2.b. Geomorphological framework
The Western Cameroon Highlands (WCH) are developed on the continental segment of the CVL and display a dominant NNE–SSW to NE–SW alignment of volcanic and plutonic massifs (Olivry, Reference Olivry1986; Déruelle et al. Reference Déruelle, Moreau, Nkoumbou, Kambou, Lissom, Njonfang, Ghogomu and Nono1991; Nsangou Ngapna et al. Reference Nsangou Ngapna, Owona, Balla Ateba, Mboudou and Wabo Defo2022; Wabo Defo et al. Reference Wabo Defo, Owona, Nsangou Ngapna, Balla Ateba and Mwabanua Mutabi2022; Mounpen et al. Reference Mounpen Njiemessa, Nsangou Ngapna, Mboudou, Balla Ateba, Wabo Defo, Youmen and Owona2024). The landscape is marked by alternating plains (Tombel, Mbô, Ndop, Noun and Tikar), hills (Monts Bambouto, Bamenda, Oku, Bana, Manengouba, Nlonako and others) and isolated inselbergs developed on the Precambrian basement (Ségalen, Reference Ségalen1967; Olivry, Reference Olivry1986). Drainage networks are predominantly dendritic to sub-dendritic, with local rectangular, sub-rectangular, parallel, sub-parallel and elongated patterns. These configurations indicate strong litho-structural control (Nsangou Ngapna et al. Reference Nsangou Ngapna, Owona, Balla Ateba, Mboudou and Wabo Defo2022; Wabo Defo et al. Reference Wabo Defo, Owona, Nsangou Ngapna, Balla Ateba and Mwabanua Mutabi2022).
Within the BMR, a part of the WCH, three main morphostructural units are distinguished and bounded by front scarps and/or scarp retreats (Figure 2; Wabo Defo et al. Reference Wabo Defo, Owona, Nsangou Ngapna, Balla Ateba and Mwabanua Mutabi2022). The Mamfe unit (U1), located in the northwest, corresponds to a low-lying depression below 250 m and is developed on the Cretaceous basin. The Nguti unit (U2; 250–750 m) and the Bafoussam unit (U3; 750–2740 m) form intermediate- to high-elevation plateaus. These units are developed on the Precambrian granite-gneissic basement and are locally overlain by volcanic cover (Figure 2c). The present relief of the study area reflects the combined influence of tectonics, lithology and climate.
2.c. Tectonic setting and seismicity
The WCH, including the BMR, is affected by several major tectonic structures such as the Central Cameroon Shear Zone (CCSZ), the Foumban–Bankim Shear Zone (FBSZ), the FFSZ and the BTJ depressions (Figures 1 and 2). These structures play a key role in controlling landscape evolution and regional stability, highlighting the dominance of active tectonics in the area (Wabo Defo et al. Reference Wabo Defo, Owona, Nsangou Ngapna, Balla Ateba and Mwabanua Mutabi2022; Nsangou Ngapna et al. Reference Nsangou Ngapna, Owona, Balla Ateba, Mboudou and Wabo Defo2022, Reference Nsangou Ngapna, Balla Ateba and Owona2026 b).
In the Mamfe Basin, two main deformation phases are recognised. The first is an extensional phase marked by the development of major faults, including the Manyu Fault. The second is a compressional phase responsible for folding and faulting, resulting in NW-trending anticlines, particularly in the eastern part of the basin (Dumort, Reference Dumort1968; Ndougsa-Mbarga et al. Reference Ndougsa-Mbarga, Manguelle-Dicoum, Campos-Enriquez and Atangana2007). The basin records a long history of ductile and brittle tectono-magmatic and metamorphic events (Wilson, Reference Wilson1928; Dumort, Reference Dumort1968; Regnoult, Reference Regnoult1986; Kanouo et al. Reference Kanouo, Njonfang, Kouské, Yongue and Ngeutchoua2017, Reference Kanouo, Kouské, Lentz and Yongué2021).
Since the installation of the first seismometer in Cameroon in 1982, several low- to moderate-magnitude earthquakes have been documented (Fairhead, Reference Fairhead1985; Ambraseys and Adams, Reference Ambraseys and Adams1986; Tabod et al. Reference Tabod Tabod, Fairhead, Stuart, Ateba and Ntepe1992; Adams, Reference Adams2022). A significant improvement in seismic monitoring followed the fatal limnic eruptions at Lake Monoun in 1984 and Lake Nyos in 1986. These events prompted the densification of the national seismic network (Ambeh et al. Reference Ambeh, Fairhead, Francis, Nnange and Djallo1989; Ambeh and Fairhead, Reference Ambeh and Fairhead1991; Tabod et al. Reference Tabod Tabod, Fairhead, Stuart, Ateba and Ntepe1992). Monitoring capacity further improved in the early 2000s with the deployment of permanent seismic stations across Cameroon (Penn State University, 2004). Additional high-resolution data were acquired during the Cameroon Broadband Seismic Experiment (2005–2008) (Wiens and Nyblade, Reference Wiens and Nyblade2005). This expanded network significantly refined earthquake locations and improved the understanding of regional tectonic structures.
Recent earthquake locations correlate well with crustal lineaments identified from gravity and magnetic anomaly data (Tokam et al. Reference Tokam, Tabod Tabod, Nyblade, Julia, Wiens and Pasyanos2010; Ngatchou et al. Reference Ngatchou, Nguiya, Owona Angue, Mouzong and Tokam Kamga2018; Cheunteu Fantah et al. Reference Cheunteu Fantah, Mezoue, Mouzong, Tokam, Nouayou and Nguiya2022; Mbossi et al. Reference Mbossi, Ndibi, Abate Essi, Wokwenmendam, Ntepe, Meghraoui, Ateba and Tabod2026). These lineaments are interpreted as faults and shear zones, including major structures such as the Central African Shear Zone (CASZ) and the FBSZ. Geophysical data suggest that these structures extend to depths between 1 and 35 km. Their apparent alignment with recent seismic events indicates that some of them remain tectonically active (Ngatchou et al. Reference Ngatchou, Nguiya, Owona Angue, Mouzong and Tokam Kamga2018; Cheunteu Fantah et al. Reference Cheunteu Fantah, Mezoue, Mouzong, Tokam, Nouayou and Nguiya2022; Mbossi et al. Reference Mbossi, Ndibi, Abate Essi, Wokwenmendam, Ntepe, Meghraoui, Ateba and Tabod2026).
Within the national context, the WCH is among the seismically active regions of the country. Recorded earthquakes in the WCH typically range in magnitude from 2.0 to 5.8 (Figure 2b). Focal mechanism solutions indicate that most events result from the reactivation of inherited crustal structures (Ngako et al. Reference Ngako, Affaton, Nnangue and Njanko2003, Reference Ngako, Affaton and Njonfang2008; Tokam et al. Reference Tokam, Tabod Tabod, Nyblade, Julia, Wiens and Pasyanos2010; Nsangou Ngapna et al. Reference Nsangou Ngapna, Owona, Balla Ateba, Mboudou and Wabo Defo2022, Reference Nsangou Ngapna, Balla Ateba and Owona2026 b; Mbossi et al. Reference Mbossi, Ndibi, Abate Essi, Wokwenmendam, Ntepe, Meghraoui, Ateba and Tabod2026). These are predominantly expressed as thrust fault systems, consistent with the regional tectonic regime and the structural framework of the CVL (Ambraseys and Adams, Reference Ambraseys and Adams1986; Ambeh et al. Reference Ambeh, Fairhead and Stuart1988; Benkhelil, Reference Benkhelil1988; Unternehr et al. Reference Unternehr, Curie, Olivet, Goslin and Beuzart1988; Guiraud, Reference Guiraud1991). Overall, the spatial distribution, depth and mechanisms of earthquakes in the WCH highlight the combined influence of inherited tectonic structures and Cenozoic volcanic processes (Smith et al. Reference Smith, Jackson and Hackett1996; Campbell et al. Reference Campbell, Lubkowski, Villani and Polidoro2018; Nsangou Ngapna et al. Reference Nsangou Ngapna, Owona, Balla Ateba, Mboudou and Wabo Defo2022, Reference Nsangou Ngapna, Owona and Balla Ateba2024, Reference Nsangou Ngapna, Balla Ateba and Owona2026 a, b; Mbossi et al. Reference Mbossi, Ndibi, Abate Essi, Wokwenmendam, Ntepe, Meghraoui, Ateba and Tabod2026). The geodynamic setting of the CVL has therefore played a major role in shaping the present-day seismic activity of the Western Cameroon Highland margin.
3. Methodology
The Index of Relative Active Tectonics (IAT) and the Analytic Hierarchy Process (AHP) were applied to the BMR to assess the response of drainage basins to tectonic forcing in the BMR. The overall methodological flowchart is presented in Figure 3.
Methodological workflow adopted in this study.

Topographic data was derived from Shuttle Radar Topography Mission (SRTM) Digital Elevation Models (DEMs) with a spatial resolution of 30 m, freely obtained from the USGS Earth Explorer platform (https://earthexplorer.usgs.gov). The DEM was preprocessed by filling sinks, and flow direction and flow accumulation were computed using standard hydrological algorithms. A total of 117 drainage basins and sub-basins were extracted, focusing on third- and fourth-order sub-basins to better constrain landscape evolution within the BMR.
Hydrological processing and drainage network extraction were carried out using the hydrology toolset in ArcGIS. Seven geomorphic indices were calculated across the study area using ArcGIS 10.8.2, the CalHypso add-in tool (Pérez-Peña et al. Reference Pérez-Peña, Azañón and Azor2009) and Microsoft Excel (Microsoft Corporation). These indices were analysed together with available geological maps at scales of 1:500,000 and 1:1,000,000 (Dumort, Reference Dumort1968), as well as field observations, to evaluate spatial variations in tectonic activity and lithological control (Figure 3). The geomorphic indices and their corresponding activity classes are summarised in Table 1, where class values of 1, 2 and 3 represent high, moderate and low tectonic activity, respectively (Matoš et al. Reference Matoš, Pérez-Peña and Tomljenović2016; Anand and Pradhan, Reference Anand and Pradhan2019; Camafort et al. Reference Camafort, Pérez Peña, Booth-Rea, Melki, Gràcia, Azañón, Galve, Marzougui, Gaidi and Ranero2020; Al-Attar et al. Reference Al-Attar, Othman, Al-Hakari, Obaid, Salar and Liesenberg2022; Aju et al. 2024; Spyrou et al. Reference Spyrou, Maroukian and Evelpidou2024; Topal, Reference Topal2024 and references therein).
Geomorphic indices used in this study to assess relative tectonic activity and their classification based on previous studies

Table 1. Long description
A table with seven rows and four columns. The columns are labeled Indice (reference), Formula/description, Geomorphic significance, and Classes (tectonic activity). The rows are labeled with different geomorphic indices and their corresponding details. Row 1: Elongation ratio (Re; Schumm, 1956). Formula: Re = 1 / sqrt(A / π). Geomorphic significance: Re-analyses the geometry of basins, which can be related to tectonic activity and lithological control. Classes: Class 1: Re ≥ 0.70, Class 2: Re 0.60–0.70, Class 3: Re < 0.60. Row 2: Relative relief ratio (Rr; Schumm 1956; Huggett and Cheesman, 2002). Formula: Rr = R / Lb. Geomorphic significance: Rr is considered a good indicator of the lithological variation within the area in relation to structural control. Classes: Class 1: Rr ≥ 0.10, Class 2: Rr 0.05–0.10, Class 3: Rr < 0.05. Row 3: Basin shape (Bs; Cannon, 1976; Ramirez-Herrera, 1998). Formula: Bs = Bl / sqrt(A). Geomorphic significance: In tectonically active areas, drainage basins present elongated geometries, whereas basin shapes become progressively more circular where the tectonic activity and uplift rates are low. Classes: Class 1: Bs ≥ 4.00, Class 2: Bs 3.00–4.00, Class 3: Bs < 3.00. Row 4: Asymmetry factor (Af; Keller and Pinter 2002; Pérez-Peña et al. 2010). Formula: Af = [100 * (A r / A t)] - 50. Geomorphic significance: Af is a method used to detect tectonic tilting of a drainage basin, measured transversely to the flow of the main channel. Classes: Class 1: Af ≥ 15.00, Class 2: Af 5.00–15.00, Class 3: Af < 5.00. Row 5: Transverse topographic symmetry factor (TTSF; Cox, 1994). Formula: TTSF = D r / D t. Geomorphic significance: The TTSF index is calculated to evaluate the tilting related to tectonic activity in each basin and indicates the preferential migration of the main channel perpendicular to the basin midline. Classes: Class 1: TTSF ≥ 0.50, Class 2: TTSF 0.30–0.50, Class 3: TTSF < 0.30. Row 6: Valley floor width to valley height ratio (Vf; Bull and McFadden, 1977). Formula: Vf = (Vw / (E l + E r) / 2) * 100. Geomorphic significance: The Vf index is used to differentiate between tectonically active and stable areas, as it describes the valley shape and whether it is dominated by vertical or lateral erosion. Classes: Class 1: Vf ≥ 1.00, Class 2: Vf 0.50–1.00, Class 3: Vf < 0.50. Row 7: Hypsometric Integral (HI; Strahler, 1952; Pérez-Peña et al. 2009). Formula: HI = (H mean - H min) / (H max - H min). Geomorphic significance: The Hypsometric curve and integral generally provide information about the relationship between elevation and area within a drainage basin and are considered a powerful tool for distinguishing tectonic activity. Classes: Class 1: HI ≥ 0.40, Class 2: HI 0.30–0.40, Class 3: HI < 0.30.
Normalised river profiles were used to characterise stream geometry and to support the identification of knickpoints (Kps). These profiles were generated using the NProfiler add-in tool for ArcGIS (Pérez-Peña et al. Reference Pérez-Peña, Al-Awabdeh, Azañón, Galve, Booth-Rea and Notti2017). Three parameters were derived: the concavity factor (Cf), maximum concavity (MaxC) and the distance from the source (dL). The concavity factor (0–100%) represents the eroded area between the river profile and a straight line connecting the source and the outlet (Ruszkiczay-Rüdiger et al. Reference Ruszkiczay-Rüdiger, Fodor, Horváth and Telbisz2009; Matoš et al. Reference Matoš, Pérez-Peña and Tomljenović2016). Maximum concavity (0–1) expresses the normalised maximum elevation difference between the profile and this reference line. High Cf and MaxC values indicate concave-upward profiles, whereas lower values reflect near-grade profiles. Such variations may reflect lithological contrasts or the influence of recent tectonic activity (Ruszkiczay-Rüdiger et al. Reference Ruszkiczay-Rüdiger, Fodor, Horváth and Telbisz2009; Pérez-Peña et al. Reference Pérez-Peña, Azor, Azañón and Keller2010; Matoš et al. Reference Matoš, Pérez-Peña and Tomljenović2016).
Watershed deviation (D) was measured by projecting the upstream equilibrium profile and subtracting the actual stream elevation from the projected profile. High values of D indicate an imbalance caused by base-level lowering, tectonics and lithology through which water flows or a decline in base level (Goldrick and Bishop, Reference Goldrick and Bishop1995; Larue Reference Larue2008; Ambili and Narayana, Reference Ambili and Narayana2014).
3.a. Index of relative active tectonics (IAT)
The IAT, proposed by El-Hamdouni et al. (Reference El Hamdouni, Irigaray, Fernandez and Keller2008), was used to estimate the relative level of tectonic activity for each sub-basin. The index is calculated as the mean of the class values assigned to the selected geomorphic indices (Table 1) according to the following equation:
 ${\rm IAT} = {\rm S}/n$
where ‘S’ is the sum of the class values of the geomorphic indices and ‘n’ is the number of indices considered. The resulting IAT values were spatially distributed to map relative tectonic activity across the study area.
Based on increasing tectonic activity, IAT values were classified into four categories: class 1 (IAT < 1.5), class 2 (1.5 ≤ IAT < 2.0), class 3 (2.0 ≤ IAT < 2.5) and class 4 (IAT ≥ 2.5), corresponding to very high, high, moderate and low tectonic activity, respectively (El-Hamdouni et al. Reference El Hamdouni, Irigaray, Fernandez and Keller2008; Dehbozorgi et al. Reference Dehbozorgi, Pourkermani, Arian, Matkan, Motamedi and Hosseiniasl2010; Mahmood and Gloaguen, Reference Mahmood and Gloaguen2012).
3.b. Analytic hierarchy process (AHP)
The AHP was employed to quantify neotectonic control on drainage basin development within the BMR. This multi-criteria decision-making method, developed by Saaty (Reference Saaty1980), allows the relative importance of different parameters to be evaluated in a structured and transparent manner. Seven morphometric parameters (Re, Rr, Bs, AF, TTSF, Vf and HI) were selected for the AHP analysis. A correlation matrix was first constructed to examine the interactions among these parameters. The relative weight of each parameter was then derived based on their significance in representing neotectonic activity, as documented in previous studies (Argyriou et al. Reference Argyriou, Teeuw, Soupios and Sarris2017; Saber et al. Reference Saber, Isik and Caglayan2019; Al-Attar et al. Reference Al-Attar, Othman, Al-Hakari, Obaid, Salar and Liesenberg2022; Nsangou Ngapna et al. Reference Nsangou Ngapna, Owona and Balla Ateba2024; Topal Reference Topal2024, and references therein). This step aimed to isolate the morphometric information most closely associated with active tectonics and to ensure a coherent data classification scheme (Table 1).
Drainage basins showing strong tectonic control generally display elongated shapes, marked relief variations (related to uplift or tilting) and a dominance of hillslope and lithological processes over fluvial processes (Burbank and Anderson, Reference Burbank and Anderson2001; Sougnez and Vanacker, Reference Sougnez and Vanacker2011; Argyriou et al. Reference Argyriou, Teeuw, Soupios and Sarris2017). These criteria guided the evaluation of parameter importance in the AHP framework.
A pairwise comparison matrix was constructed to compare morphometric parameters two by two using the Saaty scale, which ranges from 1 to 9 and expresses increasing levels of dominance (Table 2; Saaty, Reference Saaty1977, Reference Saaty1990, Reference Saaty2000). Values of 1, 3, 5, 7 and 9 indicate equal, moderate, relatively strong, strong and extremely strong influence, respectively, while intermediate values (i.e., 2, 4, 6 and 8) represent transitional preferences. When the parameter in the vertical axis is more important than that on the horizontal axis, values between 1 and 9 are assigned; otherwise, reciprocal values between 1/2 and 1/9 are used (Table 2).
Scales of relative importance used in the AHP (Saaty, Reference Saaty1977, Reference Saaty1990, Reference Saaty2000)

Table 2. Long description
A table titled ‘Scales of relative importance used in the AHP’ with three columns: Preference factor, Degree of preference, and Explanation. The table has nine rows, including a header row. The columns are labeled as follows: Preference factor, Degree of preference, and Explanation. The rows are as follows: Row 1: Preference factor, 1; Degree of preference, Equal importance; Explanation, Two factors contribute equally to the objective. Row 2: Preference factor, 3; Degree of preference, Moderate importance; Explanation, Experience and judgement slightly to moderately favour one factor over another. Row 3: Preference factor, 5; Degree of preference, Strong importance; Explanation, Experience and judgement strongly or essentially favour one factor over another. Row 4: Preference factor, 7; Degree of preference, Very strong importance; Explanation, One factor is strongly favoured over another, and its dominance is demonstrated in practice. Row 5: Preference factor, 9; Degree of preference, Extreme importance; Explanation, The evidence of favouring one factor over another is of the highest possible level of certainly. Row 6: Preference factor, 2, 4, 6, 8; Degree of preference, Intermediate values; Explanation, Used to represent compromises between the preference values 1, 3, 5, 7 and 9. Row 7: Preference factor, Reciprocals; Degree of preference, Opposite values; Explanation, Used for inverse comparison.
The relative importance between two factors, A 1 and A 2, is represented by A 12 in the pairwise comparison matrix. The corresponding matrix equation for n morphometric parameters (A 1, A 2, …, A n ) is given in Equation (1).
 $\left[ {\matrix{ 1 & {{A_{12}}} & \ldots & {{A_{1n}}} \cr {{A_{21}}} & 1 & \ldots & {{A_{2n}}} \cr \vdots & \vdots & \vdots & \vdots \cr {{A_{n1}}} & {{A_{n2}}} & \ldots & 1 \cr } } \right]$
A judgement matrix was constructed, and the priority weight of each morphometric parameter, considered as a decision criterion, was calculated. The matrix defined in Equation (1) was normalised using Equation (2) to determine the relative weights (a ij) of the morphometric parameters through pairwise comparisons.
 ${a_{{\rm{ij}}}} = \displaystyle{{{a_{{\rm{ij}}}}} \over {\sum\nolimits_{i = 1}^n {{a_{{\rm{ij}}}}} }}\left( {{{i }} = {\rm{ }}1,{\rm{ }}2,{\rm{ }} \ldots, {{ n}}} \right)$
where a ij represents the preference scale value assigned to the comparison between two morphometric parameters. Subsequently, the standard weights (w i) of the selected morphometric parameters were calculated using Equation (3).
 $w{\rm{i}} = \left( \displaystyle{{1 \over {{n}}}} \right)\displaystyle\sum\nolimits_{i = 1}^n a {!_{{\rm{ij}}}}\left( {{{i }} = {\rm{ }}1,{\rm{ }}2,{\rm{ }} \ldots, {{ n}}} \right)$
Because pairwise comparisons involve expert judgement, the consistency of the results was evaluated using the consistency ratio (CR). The CR is defined as the ratio between the Consistency Index (CI) and the Random Consistency Index (RI) (Equation 4; Saaty, Reference Saaty1977).
 $CR = {{CI} \over {{{RI}}}}$
As shown in Table 3, the RI value is a function of the matrix order. CI measures the degree of consistency within the pairwise comparison matrix and is derived from its maximum eigenvalue. It is calculated using the following equation:
 $CI = {{\left( \lambda{\max - \;n} \right)} \over {\left( {{{n}} - 1} \right)}}$
where λmax is the maximum eigenvalue of the matrix and n is the matrix size. λmax can be calculated according to the following formula:
 $\begin{align}{\lambda _{{\rm{max}}}} &= {u_1} + \;{u_2} + \ldots + \;{u_n}\;{\rm and}\;\;{u_{\rm{i}}} \\&={\left( {A*w} \right)_i}/\left( {n*{w_i}} \right)\left( {i = 1,2,...,n} \right)\end{align}$
Random consistency index (RI) value as a function of matrix order (Saaty and Vargas, Reference Saaty and Vargas1980; Saaty, Reference Saaty2000)

Table 3. Long description
A table titled ‘Random consistency index (RI) value as a function of matrix order’ presents the relationship between the number of criteria and their corresponding RI values. The table has two columns and sixteen rows, including the header row. The first column is labeled ‘Number of criteria’ and the second column is labeled ‘RI’. The values in the ‘Number of criteria’ column range from 1 to 15. The values in the ‘RI’ column are as follows: 0 for criteria 1 and 2, 0.58 for criteria 3, 0.90 for criteria 4, 1.12 for criteria 5, 1.24 for criteria 6, 1.32 for criteria 7, 1.41 for criteria 8, 1.45 for criteria 9, 1.49 for criteria 10, 1.51 for criteria 11, 1.53 for criteria 12, 1.56 for criteria 13, 1.57 for criteria 14, and 1.59 for criteria 15. The table provides a clear mapping of how the RI value changes with an increasing number of criteria.
with (A*W) i representing the i-th element of the matrix (A*W) and W, the weight vector.
The CR ranges from 0 to 1 (Saaty, Reference Saaty1980). A CR value lower than 0.10 (i.e., 10%) indicates an acceptable level of consistency, whereas higher values (CR > 0.10) are considered to indicate inconsistent comparison results (Saaty, Reference Saaty1977; Saaty and Vargas, Reference Saaty and Vargas1991).
The final AHP value for each drainage basin was calculated as the weighted sum of the class values of the geomorphic indices:
 $AHP{._{value}} = \mathop \sum \nolimits_{i{\rm{\;}} = {\rm{\;}}1}^n \left( {{R_i}*{{W_i}}} \right){\rm{\;}}$
where Ri is the class value of tectonic activity for each index and Wi is its corresponding standard weight. The AHP results were spatially distributed to produce a map of relative tectonic activity. Following previous studies (Saber et al. Reference Saber, Isik and Caglayan2019; Nsangou Ngapna et al. Reference Nsangou Ngapna, Owona and Balla Ateba2024), the AHP results were classified into four categories: very high (class 1: AHP < 1.5), high (class 2: 1.5 ≤ AHP < 2.0), moderate (class 3: 2.0 ≤ AHP < 2.5) and low (class 4: AHP ≥ 2.5) tectonic activity.
4. Results
4.a. Drainage system characteristics
4.a.1. Normalised stream profiles
The normalised stream profiles show a high morphological diversity within the study area. Concave profiles account for ∼23.08%, convex profiles for ∼2.56%, and linear profiles for ∼4.27%, while complex and S-shaped profiles are largely dominant, representing ∼70.09% (Figure 4). Concave shapes (Figure 4a) generally indicate near steady-state equilibrium conditions between climate, erosion and uplift. Convex shapes (Figure 4f), which are weakly represented, are commonly associated with active tectonic processes or the presence of resistant lithologies. Linear profiles (Figure 4c and d) correspond to rivers in a transient state and may reflect a temporary hydraulic balance between sediment load and discharge. The predominance of atypical profile shapes (Figure 4b and e) suggests local perturbations of the equilibrium profile. These disturbances may be related to lithological variations, inherited morphostructural features or topographic artefacts induced by the 30-m SRTM DEM. Such artefacts are particularly likely in densely vegetated areas, as is the case in the present tropical setting.
Representative normalised longitudinal stream profiles of the BMR showing key statistical parameters (Cf, MaxC and dL).

Figure 4. Long description
Six line graphs depict normalized elevation against normalized distance for different rivers, highlighting concavity, MaxC, and dL values. Panel A: The line graph for River 105 shows normalized elevation on the vertical axis and normalized distance on the horizontal axis. The graph includes a red reference line and a blue line representing the river’s profile. Key parameters are concavity at 58.95 percent, MaxC at 0.48, and dL at 0.25. Panel B: The line graph for River 53 shows normalized elevation on the vertical axis and normalized distance on the horizontal axis. The graph includes a red reference line and a blue line representing the river’s profile. Key parameters are concavity at 49.42 percent, MaxC at 0.43, and dL at 0.25. Panel C: The line graph for River 21 shows normalized elevation on the vertical axis and normalized distance on the horizontal axis. The graph includes a red reference line and a blue line representing the river’s profile. Key parameters are concavity at 12.60 percent, MaxC at 0.17, and dL at 0.28. Panel D: The line graph for River 86 shows normalized elevation on the vertical axis and normalized distance on the horizontal axis. The graph includes a red reference line and a blue line representing the river’s profile. Key parameters are concavity at 5.01 percent, MaxC at 0.11, and dL at 0.22. Panel E: The line graph for River 87 shows normalized elevation on the vertical axis and normalized distance on the horizontal axis. The graph includes a red reference line and a blue line representing the river’s profile. Key parameters are concavity at -9.00 percent, MaxC at 0.07, and dL at 0.27. Panel F: The line graph for River 116 shows normalized elevation on the vertical axis and normalized distance on the horizontal axis. The graph includes a red reference line and a blue line representing the river’s profile. Key parameters are concavity at -20.91 percent, MaxC at 0.07, and dL at 0.89.
4.a.2. Statistical parameters of normalised stream profiles
The statistical parameters of dimensionless river profiles, including the concavity factor (Cf), maximum concavity (MaxC) and distance from the source (dL), show large spatial variability among the BMR sub-basins. Cf values range from −21.74% to 84.31%, while MaxC varies between 0.07 and 0.79 (Table 4).
Computed values of geomorphic indices and statistical parameters derived from normalised profiles of BMR drainage basins

Table 4. Long description
A table comparing geomorphic indices and statistical parameters of drainage basins. The table has 103 rows and 10 columns. The columns are labeled as Did, N 1, Bucket, Cf, MaxC, dL, S, Ksn, KHN, and Chi. The rows are labeled with numerical values from 1 to 103. Each row contains values corresponding to the geomorphic indices and statistical parameters for different drainage basins. Notable trends and comparisons include variations in the concavity factor (Cf), maximum concavity (MaxC), and distance from the source (dL) across different basins. The values for Cf range from 21.74 to 84.31 percent, while MaxC varies between 0.07 and 0.79. The table provides a detailed comparison of these parameters across various drainage basins.
Concave and well-graded concave profiles (Figure 4a and b) display high Cf values (≥45%) and high MaxC values (0.36–0.79). In contrast, convex profiles (Figure 4e and f) are associated with low Cf (≤9%) and low MaxC values (0.07–0.22) (Table 4). Linear profiles (Figure 4c and d) exhibit values close to zero, indicating drainage systems approaching graded equilibrium conditions.
The classification into four evolutionary groups (C1–C4) highlights young basins with convex or S-shaped profiles (C2), basins with atypical evolutionary trends (C1 and C3) and older basins approaching equilibrium conditions (C4) (Table 4; Figure 5).
The relationship between MaxC and dL is derived from normalised stream profiles of the BMR. (a) Spatial distribution of MaxC versus dL; (b) Principal component analysis. Mean values are indicated by red dashed lines. Data are grouped into four clusters (C1–C4), and the arrow in (b) indicates increasing dynamic equilibrium.

4.a.3. Watershed deviation (D)
Almost all deviation profiles in the study area show high values ranging from 528 to 1731 m, except the Moungo River, which exhibits a minimum value of 346 m (Figure 6). High D-values indicate instability and could be caused by base–level lowering, tectonic activity and/or bedrock lithology. They also indicate that uplift increases from the base toward the Western Cameroon Highlands margin and may also reflect eustatic control and lithological variation.
Semi-logarithmic longitudinal profiles of main rivers in the BMR and their corresponding deviation values (m).

Figure 6. Long description
Four semi-logarithmic line graphs depict the longitudinal profiles of main rivers in the BMR and their corresponding deviation values. Each graph shows elevation (m) on the vertical axis and distance (km) on the horizontal axis. The graphs are divided into four panels, each representing different rivers and their deviation values. Panel A: This graph shows the profiles of Cross River, Moungo, and Munaya. The elevation ranges from 0 to 1000 meters, and the distance ranges from 0.1 to 1000 kilometers. The deviation values are marked with vertical arrows and labeled with specific values. Panel B: This graph shows the profiles of North Mifi, Ndabu, and Munaya. The elevation ranges from 1000 to 2000 meters, and the distance ranges from 0.1 to 1000 kilometers. The deviation values are similarly marked and labeled. Panel C: This graph shows the profiles of Nkam, Makombe, and Mafhou. The elevation ranges from 200 to 2200 meters, and the distance ranges from 0.1 to 1000 kilometers. The deviation values are marked and labeled. Panel D: This graph shows the profiles of South Mifi and Mukie. The elevation ranges from 1000 to 1800 meters, and the distance ranges from 0.1 to 1000 kilometers. The deviation values are marked and labeled. Each graph includes multiple lines representing different rivers, with specific deviation values indicated by vertical arrows and labeled with their respective measurements.
4.b. Morphometric analysis of drainage basins
4.b.1. Elongation ratio (Re)
The elongation ratio (Re) values range from 0.35 to 1.10, defining three classes (Tables 4 and 5; Figure 7a): class 1 (Re < 0.60), class 2 (0.60 ≤ Re < 0.70) and class 3 (Re ≥ 0.70), equivalent to highly elongated, moderately elongated and less elongated basins, respectively. Most sub-basins belong to class 3 (∼42.73%), display less elongated shapes and are generally associated with low tectonic activity. Classes 1 (∼37.61%) and 2 (∼19.66%) indicate highly elongated to elongated shapes, linked to high and moderate tectonic activity, respectively. These values suggest tectonic control in approximately 57.27% of the basins, potentially associated with fault reactivations.
Classification of river geomorphic indices and their integration into IAT and AHP results for the BMR

Table 5. Long description
A table classifying river geomorphic indices and their integration into IAT and AHP results. The table has 103 rows and 7 columns. The columns are labeled as follows: Did, Class of geomorphic indices, IAT, IAT rank, AHP, AHP rank, and Final rank. The table lists the Did values from 1 to 103. The Class of geomorphic indices includes various classes such as 1, 2, and 3. The IAT values range from 0.35 to 1.10. The IAT rank values range from 1 to 103. The AHP values range from 0.35 to 1.10. The AHP rank values range from 1 to 103. The Final rank values range from 1 to 103. The table provides a detailed classification of river geomorphic indices and their integration into IAT and AHP results for the BMR.
Spatial distribution of geomorphic indices within BMR drainage basins. (a) Elongation ratio (Re); (b) relative relief ratio (Rr); (c) basin shape (Bs); (d) asymmetry factor; (e) transverse topographic symmetry factor (TTSF); (f) valley floor width to valley height ratio (Vf); (g) hypsometric integral (HI). These parameters highlight spatial variations in tectonic activity across the study area.

Figure 7. Long description
Panel A: A map displaying the elongation ratio (Re) values across the BMR drainage basins. The map is color-coded into three classes: Class 1 with Re < 0.60 in red, Class 2 with Re between 0.60 and 0.70 in yellow, and Class 3 with Re >= 0.70 in green. Rivers and faults are marked with specific symbols, and sub-basins are numbered and outlined. The map shows a mix of these classes spread across the region, indicating varying degrees of elongation in different sub-basins. Panel B: A map illustrating the relative relief ratio (Rr) values across the same area. Similar to Panel A, it is divided into three classes: Class 1 with Rr >= 0.10 in red, Class 2 with Rr between 0.05 and 0.10 in yellow, and Class 3 with Rr < 0.05 in green. The distribution of these classes shows the relative relief variations, with some areas having higher relief ratios than others. Both maps include rivers, faults, and sub-basin boundaries, providing a detailed view of the geographic and geomorphic features of the BMR drainage basins.
4.b.2. Relative relief ratio (Rr)
The relative relief ratio (Rr) varies between 0.01 and 0.23. Based on these values, three classes were defined (Tables 4 and 5; Figure 7b): class 1 (Rr ≥ 0.10), class 2 (0.05 ≤ Rr < 0.10) and class 3 (Rr < 0.05), corresponding to high, moderate and low degrees of tectonic activity, respectively. Approximately 13.68% of the studied sub-basins fall into class 1, ∼40.17% into class 2 and ∼46.15% into class 3. Overall, about 53.85% of the basins exhibit Rr values suggesting moderate-to-strong tectonic influence on their evolution.
4.b.3. Basin shape (Bs)
Basin shape (Bs) values range from 0.59 to 10.33 and were grouped into three classes: class 1 (Bs ≥ 4.00; ∼17.95%), class 2 (3.00 ≤ Bs < 4.00; ∼14.53%) and class 3 (Bs < 3.00; ∼67.52%), representing elongate, semi-elongate and circular basins, respectively (Tables 4 and 5; Figure 7c). The predominance of low Bs values (class 3; ∼67.52%) indicates a generally weak tectonic influence. The circular basin shapes typically result from prolonged morphological evolution under humid climatic conditions, characterised by intense weathering and relief smoothing. Classes 1 and 2 (∼32.48%), although less frequent, reveal moderate-to-strong tectonic activity. These computed Bs values suggest a relatively low influence of tectonic reactivations in the BMR.
4.b.4. Asymmetry factor (AF)
The asymmetry factor (AF) values vary between 0.06 and 31.34 and reveal both symmetric and asymmetric basins (Tables 4 and 5; Figure 7d). Approximately 23.08% of the studied basins exhibit symmetric types (class 3: AF < 5.00), corresponding to semi-active sub-basins with low tectonic tilting rates. The asymmetric types are subdivided into moderately asymmetric basins (class 2: 5.00 ≤ AF < 15.00; ∼41.02%) and strongly asymmetric basins (class 1: AF ≥ 15.00; ∼35.9%). These moderately and strongly asymmetric types suggest progressive tilting and/or localised tectonic activity and are considered active or very active basins, respectively. Overall, AF values (around 76.92%) indicate the dominant tilting character of the studied sub-basins, suggesting moderate-to-strong tilting related to an unstable tectonic setting.
4.b.5. Transverse topographic symmetry factor (TTSF)
The transverse topographic symmetry factor (TTSF) values range from 0.07 to 0.94. They were subdivided into three classes (Tables 4 and 5; Figure 7e): class 1 (TTSF ≥ 0.50; ∼20.51%), class 2 (0.30 ≤ TTSF < 0.50; ∼43.59%) and class 3 (TTSF < 0.30; ∼35.90%), corresponding to high, moderate and low tectonic tilting rates, respectively. These computed TTSF values indicate moderate-to-high tilting of drainage basins (∼64.10%) and may further confirm the relative instability of the drainage network within the study area.
4.b.6. Valley floor width to valley height ratio (Vf)
The valley floor width to valley height ratio (Vf) ranges from 0.07 to 4.83. Three classes were defined (Tables 4 and 5; Figure 7f): class 1 (Vf < 0.50; ∼37.61%) for high tectonic activity, class 2 (0.50 ≤ Vf < 1.00; ∼28.21%) for moderate tectonic activity and class 3 (Vf ≥ 1.00; ∼34.18%) for low tectonic activity. Vf values show a relatively balanced distribution between V-shaped valleys (Vf < 1) and broader U-shaped valleys (Vf ≥ 1). Approximately 65.82% of the basins (classes 1 and 2) suggest some degree of tilting or incision affecting drainage systems, likely in response to fault movements.
4.b.7. Hypsometric integral (HI) and hypsometric curve
Hypsometric integral (HI) values range from 0.09 to 0.66 and vary significantly between watersheds (Tables 4 and 5; Figure 7g). Following the classification proposed by Anand and Pradhan (Reference Anand and Pradhan2019), three classes were identified: class 1 (HI ≥ 0.40; ∼26.49%), class 2 (0.30 ≤ HI < 0.40; ∼24.79%) and class 3 (HI < 0.30; ∼48.72%), corresponding to high, moderate and low tectonic activity, respectively. Moderate-to-high HI values (∼51.28%) of the basins, commonly interpreted as indicators of young or rejuvenated relief, are typically associated with active tectonics and relatively limited erosion. In contrast, low HI values (<0.30) reflect old and strongly eroded landscapes, with elevations closely aligned with the relative local base level.
Hypsometric curves display distinct characteristics, including slope, curvature and inflection points. Based on these criteria and the models proposed by Strahler (Reference Strahler1952), the curves of the study area were grouped according to their similarity (Figure 8). Basins characterised by dominant concave curves and low HI values (Figure 8a–d) correspond to the oldest evolutionary stages. S-shaped curves with moderate HI values (Figure 8e) and linear curves (Figure 8f) indicate mature stages of drainage basin development. Convex curves with high HI values (Figure 8g) reflect young basins and indicate a strong tectonic influence, including uplift, fault reactivation and long-term rejuvenation. Concave–convex curves with a zigzag pattern (Figure 8h and i) are interpreted as indicative of unstable and reactive basins. These atypical shapes reflect drainage sub-basins in dynamic equilibrium, resulting from a balance between tectonic and erosional processes.
Hypsometric curves of 117 drainage basins in the BMR. Curves are grouped according to their morphologies, reflecting different stages of evolution.

4.c. Comparison between IAT and AHP
To assess relative tectonic activity, the selected geomorphic indices were cross-analysed using the IAT and AHP methods. Based on the computed IAT and AHP values for each sub-basin, four classes of tectonic activity were defined across the study area.
According to the IAT results, ∼2.56% of the sub-basins fall into class 1, indicating very high tectonic activity. ∼25.64% are classified as class 2 (high tectonic activity), ∼52.99% as class 3 (moderate tectonic activity) and ∼18.81% as class 4, reflecting low tectonic activity (Table 5; Figure 9a). The spatial distribution of IAT values shows that nearly 81.19% of the study area is affected by moderate-to-strong tectonic activity, suggesting an overall unstable tectonic setting for the BMR drainage network.
Spatial distribution of relative tectonic activity derived from (a) Index of Active Tectonics (IAT) and (b) Analytic Hierarchy Process (AHP), highlighting zones of differential tectonic activity.

Figure 9. Long description
Panel A: A map displaying the spatial distribution of relative tectonic activity derived from the Index of Active Tectonics (IAT). The map covers a region with coordinates ranging from 5 N to 9 N latitude and 9 E to 10 E longitude. It includes various sub-basins, rivers, and faults. The map is color-coded to indicate different classes of tectonic activity: Class 1 (Very high tectonic activity) in red, Class 2 (High tectonic activity) in orange, Class 3 (Moderate tectonic activity) in yellow, and Class 4 (Low tectonic activity) in green. The map also shows numbered sub-basins and fault lines. Panel B: A map displaying the spatial distribution of relative tectonic activity derived from the Analytic Hierarchy Process (AHP). Similar to Panel A, this map covers the same region and includes sub-basins, rivers, and faults. It is also color-coded to indicate different classes of tectonic activity: Class 1 (Very high tectonic activity) in red, Class 2 (High tectonic activity) in orange, Class 3 (Moderate tectonic activity) in yellow, and Class 4 (Low tectonic activity) in green. The map shows numbered sub-basins and fault lines.
Correlation analyses between geomorphic indices were conducted to evaluate potential dependencies among the variables. The correlation matrix (Table 6) reveals no significant relationships between most indices. The only notable correlation is a strong negative relationship between Bs and Re (r = −0.792).
Pearson correlation matrix of the geomorphic indices used in this study

Table 6. Long description
A table showing Pearson correlation matrix of geomorphic indices. The table has 8 rows and 8 columns. The row labels and column headers are Re, Rr, Bs, Af, TTSF, Vf, and HI. Each cell contains a correlation coefficient value. Row 1: Re, Re 1. Row 2: Rr, 0.145, 1. Row 3: Bs, -0.792, -0.064, 1. Row 4: Af, 0.013, 0.001, -0.042, 1. Row 5: TTSF, -0.055, 0.162, 0.068, 0.329, 1. Row 6: Vf, 0.106, -0.139, -0.089, 0.150, -0.054, 1. Row 7: HI, -0.052, 0.239, 0.002, -0.039, -0.006, -0.338, 1.
Bold numbers represent the strong positive or negative correlation between the parameters.
In the AHP approach, a pairwise comparison matrix was established based on the relative importance of morphometric indices for interpreting regional tectonic activity (Table 7). The weighted judgement matrix yielded a CR of 0.025 (Table 7), indicating a high level of reliability in expert judgements (CR < 0.10). The derived weights were then integrated into the computation of AHP values for the study area. These values were subsequently classified into four tectonic activity classes (Table 5): class 1 (AHP < 1.5; ∼9.40%), class 2 (1.5 ≤ AHP < 2.0; ∼38.90%), class 3 (2.0 ≤ AHP < 2.5; ∼35.04%) and class 4 (AHP ≥ 2.5; ∼16.66%), corresponding to very high, high, moderate and low tectonic activity, respectively. The spatial distribution of the AHP results is illustrated in Figure 9b. Overall, the AHP analysis indicates that approximately 83.34% of the BMR region is characterised by moderate-to-high tectonic influence affecting drainage basin development.
Pairwise comparison matrix and assigned weights of geomorphic indices used to evaluate neotectonic control in the BMR using the AHP method

Table 7. Long description
A table comparing the relative importance of geomorphic indices for interpreting regional tectonic activity using the AHP method. The table has eight rows and eight columns. The columns are labeled as follows: Geomorphic indices, Re, Rr, Bs, A_F, TTSF, Vf, HI, and Priority vector/Weight. The rows are labeled with the following geomorphic indices: Re, Rr, Bs, A_F, TTSF, Vf, and HI. The values in the table are as follows: Row 1: Re, 1, 1/3, 1/2, 1/5, 1/4, 1/7, 1/6, 0.032. Row 2: Rr, 3, 1, 2, 1/3, 1/2, 1/5, 1/4, 0.070. Row 3: Bs, 2, 1/2, 1, 1/4, 1/3, 1/6, 1/5, 0.046. Row 4: A_F, 5, 3, 4, 1, 2, 1/3, 1/2, 0.159. Row 5: TTSF, 4, 2, 3, 1/2, 1, 1/4, 1/3, 0.106. Row 6: Vf, 7, 5, 6, 3, 4, 1, 2, 0.350. Row 7: HI, 6, 4, 5, 2, 3, 1/2, 1, 0.237. The table also includes the values for lambda max, CI, and CR at the bottom: lambda max=7.198, CI=0.033, CR=0.025.
Abbreviations: Re, Elongation ratio ; Rr, Relative relief ratio ; Bs, Basin shape ; A F , Asymmetry factor ; TTSF, Transverse topographic symmetry factor ; Vf, Valley floor width to valley height ratio ; HI, Hypsometric integral ; λmax, Maximum eigen value of the matrix ; CI, Consistency Index ; CR, consistency ratio.
4.d. Field surveys
Field investigations were conducted to complement the remote sensing and modelling results, providing direct observations of the morphotectonic features in the study area. Figures 10 and 11 highlight key findings from the field campaigns. The surveys revealed mesoscopic knickpoints (Kps), manifesting as waterfalls and scarp fronts. A large number of Kps are of the mobile and anchored types (fault types) and indicate the transient adjustment of the fluvial system at the same altitude for each sub-basin. The Kps are found at a confluence, lithological contact or tectonic structures/faults and are associated with the highest faulting density, high-uplift rates and high-erosion activity. All these geological phenomena also affect the shape of river longitudinal profiles within the study area, marked by slope breaks (Figures 4 and 10a, e). These Kps and waterfalls suggest reactivation zones related to subvertical to vertical uplifts affecting the BMR. Field observations further reveal faults and other brittle features within the granite-gneissic basement, notably in the Bamia quarry (Santchou), the Baboutcha-Nintcheu (Bafang town) and along the Nkam bridge in the Kekem region (Figure 11). These features indicate major post-orogenic vertical and horizontal displacements within the BMR, associated with uplift, subsidence, tilting and the development of deeply incised valleys.
Field evidence of geomorphic markers in the BMR. (a) Panoramic view of the Fongo Tongo landscape showing a prominent scarp and deeply incised valley, (b) Oku waterfall, (c) Multi-level waterfalls in the Jakiri area, (d) Fault scarp interpreted as a knickpoint related to uplift, (e) Cross River waterfall section showing intensely fractured bedrock indicative of structural control.

Field photographs of the major structural features in the BMR. (a) Successive strike-slip faults observed along a road cut near National Road No. 5, close to the Nkam bridge, (b–c) Mesoscopic fault planes exposed at the Bamia quarry (Santchou), (d) Fault zone with slickensides at the Bamia quarry, (e) Reverse fault and σ-type porphyroclasts observed on a rock slab at the Bamia quarry, (f) Normal fault observed at Baboutcha-Nintcheu (Bafang).

Figure 11. Long description
The image contains six photos depicting major structural features in the Bamia quarry and surrounding areas in Cameroon. Panel A: A photo showing successive strike-slip faults observed along a road cut near National Road No. 5, close to the Nkam bridge. A person is standing near the faults for scale. Panel B: A photo of mesoscopic fault planes exposed at the Bamia quarry. The faults are highlighted with yellow dashed lines. Panel C: Another photo of mesoscopic fault planes exposed at the Bamia quarry, with slickensides labeled. Panel D: A photo of a fault zone with slickensides at the Bamia quarry. A person is standing near the fault zone for scale. Panel E: A photo of a reverse fault and sigma-type porphyroclasts observed on a rock slab at the Bamia quarry. The fault and porphyroclasts are highlighted with yellow dashed lines. Panel F: A photo of a normal fault observed at Baboutcha-Nintcheu (Bafang). The fault is highlighted with a yellow dashed line.
5. Discussion
The critical evaluation of the WCH geomorphological setting shows that it is an uneven geomorphic unit developed on the Paleo- and Neoproterozoic basement and the Cretaceous to Recent volcano-sedimentary cover and is dissected by regional (CCSZ, BTJ, TBSZ and FBSZ) and local (CrF, NgF, FFSZ) active tectonic structures as well as the CVL (Nsangou Ngapna et al. Reference Nsangou Ngapna, Owona, Balla Ateba, Mboudou and Wabo Defo2022; Wabo Defo et al. Reference Wabo Defo, Owona, Nsangou Ngapna, Balla Ateba and Mwabanua Mutabi2022). Previous studies conducted in the BMR revealed that the area is crosscut by these active faults and also demonstrated the control of lithology and climate (Wabo Defo et al. Reference Wabo Defo, Owona, Nsangou Ngapna, Balla Ateba and Mwabanua Mutabi2022). The present section discusses the evidence of an active tectonic character revealed through geomorphic investigation and its regional tectonic evolutionary model affecting the BMR.
5.a. Insights on the BMR active tectonics through geomorphic investigation
Merge (Re–Bs)
The planimetric shape of a river catchment can be quantitatively expressed by the aerial morphometric variable known as the basin elongation ratio (Re) and basin shape (Bs). These indices are often used as proxy indicators for active tectonics (El-Hamdouni et al. Reference El Hamdouni, Irigaray, Fernandez and Keller2008; Kale and Shejwalkar, Reference Kale and Shejwalkar2008). From the obtained results of Re, around 57.27% of the observed basins (Table 4; Figure 7a) are more elongated (∼37.61%), elongated (∼19.66%) and less elongated (∼42.73%), suggesting moderate-to-strong tectonic controls in the BMR landscape’s evolution (Schumm, Reference Schumm1956; Bull and McFadden, Reference Bull, McFadden and Doehring1977; Ramírez-Herrera, Reference Ramírez-Herrera1998). Computed Bs values (Table 4; Figure 7c) are classified into elongate (≥4, ∼17.95%), semi-elongate (3–4: ∼14.53%) and circular (<3, ∼67.52%) basins. Elongate basins are characterised by high Bs values, generally associated with relatively higher tectonic activity (∼32.48%) within the study area. Conversely, low Bs values for circular basins (∼67.52%) indicate a more ductile tectonic influence. This circular character of the drainage patterns represents additional evidence of tectonic control on the landscape demonstrated in the Western Cameroon margin (Wabo Defo et al. Reference Wabo Defo, Owona, Nsangou Ngapna, Balla Ateba and Mwabanua Mutabi2022; Nsangou Ngapna et al. Reference Nsangou Ngapna, Owona, Balla Ateba, Mboudou and Wabo Defo2022, Reference Nsangou Ngapna, Owona and Balla Ateba2024, Reference Nsangou Ngapna, Balla Ateba and Owona2026 a,b). Both indices highlight landscape rejuvenation and litho-structural control due to regional and local tectonic features cutting across the study zone (Wabo Defo et al. Reference Wabo Defo, Owona, Nsangou Ngapna, Balla Ateba and Mwabanua Mutabi2022; Nsangou Ngapna et al. Reference Nsangou Ngapna, Owona, Balla Ateba, Mboudou and Wabo Defo2022, Reference Nsangou Ngapna, Balla Ateba and Owona2026 b).
Merge (AF–TTSF)
AF values, used to quantify the influence of tectonic control on drainage development (Hare and Gardner, Reference Hare, Gardner, Morisawa and Hack1985; Keller and Pinter, Reference Keller and Pinter2002), show low values for inactive basins (∼23.08%), indicating minimal tectonic influence. However, higher AF values, observed in approximately 76.92% of basins, suggest an unstable tectonic setting, with moderately asymmetric (∼41.02%) and strongly asymmetric (∼35.9%) basins linked to fault reactivation (Table 4; Figure 7d). The medium TTSF values for BMR drainage systems indicate that the main channels are relatively diverted from the basin midline (Cox, Reference Cox1994; Verrios et al. Reference Verrios, Zygouri and Kokkalas2004; Khavari et al. Reference Khavari, Arian and Ghorashi2009). These calculated values suggest moderate-to-high drainage basin tilting at ∼64.1% in response to tectonic events that have affected the area (Table 4; Figure 7e). These two indices (AF and TTSF) reveal various geometries of drainage basins and indicate regional tilting of the WCH (Nsangou Ngapna et al. Reference Nsangou Ngapna, Owona, Balla Ateba, Mboudou and Wabo Defo2022; Wabo Defo et al. Reference Wabo Defo, Owona, Nsangou Ngapna, Balla Ateba and Mwabanua Mutabi2022). Similar situations have been reported in other environments across the world (Keller and Pinter, Reference Keller and Pinter2002; Pérez-Peña et al. Reference Pérez-Peña, Azor, Azañón and Keller2010; Mahmood and Gloaguen, Reference Mahmood and Gloaguen2012; Spyrou et al. Reference Spyrou, Maroukian and Evelpidou2024). Nevertheless, although AF is commonly related to tectonic activity, the observed asymmetry cannot be attributed exclusively to active tectonics. Lithological controls, differential erosion and natural channel migration in tropical environments may also contribute to basin asymmetry (Hare and Gardner, Reference Hare, Gardner, Morisawa and Hack1985; El-Hamdouni et al. Reference El Hamdouni, Irigaray, Fernandez and Keller2008; Saber et al. Reference Saber, Isik and Caglayan2019; Nsangou Ngapna et al. Reference Nsangou Ngapna, Owona, Mboudou, Balla Ateba and Wabo Defo2023; Spyrou et al. Reference Spyrou, Maroukian and Evelpidou2024).
Merge (Vf–Rr–HI)
In order to discriminate between V-shaped and U-shaped valleys, the Vf index can be used to evaluate the erosive action of rivers on the topography (Bull and McFadden, Reference Bull, McFadden and Doehring1977). Nevertheless, in tropical environments, valley (Vf) morphology is also strongly influenced by landslides and lithological variability (Keller and Pinter, Reference Keller and Pinter2002; El-Hamdouni et al. Reference El Hamdouni, Irigaray, Fernandez and Keller2008; Gaidzik and Ramírez-Herrera, Reference Gaidzik and Ramírez-Herrera2017). This morphometric index is commonly attributed to tectonic activity. Computed low Vf values (<1, ∼65.82%) reveal V-shaped and deeply incised valleys (Table 4; Figure 7f). They correspond to significant tectonic tilting and differential tectonic uplift rates of the BMR drainage systems (El-Hamdouni et al. Reference El Hamdouni, Irigaray, Fernandez and Keller2008; Keller and Pinter, Reference Keller and Pinter2002; Balla Ateba et al. Reference Balla Ateba, Nsangou, Owona and Mboudou2023; Nsangou Ngapna et al. Reference Nsangou Ngapna, Owona and Balla Ateba2024). Conversely, high Vf values (≥1, ∼34.18%) indicate broad U-shaped or flat-floored valleys, suggesting less active or quiescent tectonics (Bull and McFadden, Reference Bull, McFadden and Doehring1977; Wabo Defo et al. Reference Wabo Defo, Owona, Nsangou Ngapna, Balla Ateba and Mwabanua Mutabi2022; Nsangou Ngapna et al. Reference Nsangou Ngapna, Owona, Mboudou, Balla Ateba and Wabo Defo2023, Reference Nsangou Ngapna, Owona and Balla Ateba2024).
Rr is highly sensitive to elevation errors. In densely vegetated tropical environments, the altimetric overestimation of the 30-m SRTM DEM may artificially enhance relief values. Rr values subdivided into three classes (high, moderate and slight) indicate overall tectonic activity in approximately 53.85% of the study area (Table 4; Figure 7b). These high Rr values (≥0.10) observed in the study area are characteristic of hilly regions and resistant rocks (Schumm, Reference Schumm1956; Huggett and Cheesman, Reference Huggett and Cheesman2002; Argyriou et al. Reference Argyriou, Teeuw, Soupios and Sarris2017). This index likely reveals uplifted areas within the WCH due to mantle dynamics along the CVL (Nsangou Ngapna et al. Reference Nsangou Ngapna, Owona, Mvondo Owono, Mpesse, Youmen, Lissom, Mvondo Ondoa and Ekodeck2018, Reference Nsangou Ngapna, Owona, Mvondo Owono, Balla Ateba, Mvondo Ondoa and Ekodeck2019, Reference Nsangou Ngapna, Owona, Balla Ateba, Mboudou and Wabo Defo2022; Wabo Defo et al. Reference Wabo Defo, Owona, Nsangou Ngapna, Balla Ateba and Mwabanua Mutabi2022). The calculated HI values (Table 4; Figure 7g) show moderate (class 2: 0.30–0.40, ∼24.79%) to high (class 1: ≥0.40, ∼26.49%) values, suggesting differential tectonic and erosional processes, whereas low HI (class 3: <0.30, ∼48.72%) values are related to older landscapes that have been more eroded and less impacted by recent active tectonics (Strahler, Reference Strahler1952; Keller and Pinter, Reference Keller and Pinter2002; Pérez-Peña et al. Reference Pérez-Peña, Azañón and Azor2009; Argyriou et al. Reference Argyriou, Teeuw, Soupios and Sarris2017; Anand and Pradhan, Reference Anand and Pradhan2019). Consequently, heterogeneous hypsometric curves and normalised stream profiles (Table 4; Figures 4, 5 and 8) indicate interactions between tectonic activities, lithological variations and long-term differential erosion (Burbank and Anderson, Reference Burbank and Anderson2001; Pérez-Peña et al. Reference Pérez-Peña, Azor, Azañón and Keller2010; Balla Ateba et al. Reference Balla Ateba, Nsangou, Owona and Mboudou2023). The BMR-normalised stream profiles display concave (∼23.08%), convex (∼2.56%), linear (∼4.27%), complex and S-shape (∼70.09%). These diverse shapes reflect basin uplifts or rejuvenations inferred from active tectonics near their equilibrium stage (Hack, Reference Hack1957; Pérez-Peña et al. Reference Pérez-Peña, Azor, Azañón and Keller2010; Matoš et al. Reference Matoš, Tomljenovic and Trenc2014; Wabo Defo et al. Reference Wabo Defo, Owona, Nsangou Ngapna, Balla Ateba and Mwabanua Mutabi2022; Balla Ateba et al. Reference Balla Ateba, Nsangou, Owona and Mboudou2023). Similar worldwide findings have shown that HI may be influenced not only by active tectonic uplift but also by lithological contrasts or base-level changes (Pánek, Reference Pánek2004; Neffati et al. Reference Neffati, Deffontaines, Katlane, Rabia, Mahroug, El Ferhi and Sarsar2023). However, HI is less sensitive to DEM resolution (Duan et al. Reference Duan, Pei and Zhang2022). Therefore, a 30-m resolution DEM is considered suitable for analysing hypsometric characteristics.
5.b. Reactivation processes in the BMR
The WCH constitutes a group of stepped plateaus (Bamileke-, Bamoun-, Plateaus and other Grassfields) and high volcanic reliefs (Mts Cameroon, Manengouba, Bamboutos and Bamenda), all separated by large escarpments and/or faults (Figure 2). These various geological phenomena affect the hydrographic basins and modify the shape of river profiles within the study area (Figure 4). The major escarpments are marked by slope breaks or knick zones (Figures 2c and 10a, b, e), suggesting reactivation zones related to subvertical to vertical successive uplifts and tilts that cut across the landscape of the BMR (Nsangou Ngapna et al. Reference Nsangou Ngapna, Owona, Mvondo Owono, Balla Ateba, Mvondo Ondoa and Ekodeck2019, Reference Nsangou Ngapna, Owona, Mvondo Owono, Balla Ateba, Manga Tsimi, Mvondo Ondoa and Ekodeck2020; Balla Ateba et al. Reference Balla Ateba, Owona, Nsangou, Manga, Minyem and Mvondo2021; Wabo Defo et al. Reference Wabo Defo, Owona, Nsangou Ngapna, Balla Ateba and Mwabanua Mutabi2022). However, high D-values observed in this area (367–1831 m, Figure 6) confirm the tectonic control of its base level over drainage networks. Similar findings have been reported in the same area (Nsangou Ngapna et al. Reference Nsangou Ngapna, Owona, Mvondo Owono, Mpesse, Youmen, Lissom, Mvondo Ondoa and Ekodeck2018, Reference Nsangou Ngapna, Owona, Mvondo Owono, Balla Ateba, Mvondo Ondoa and Ekodeck2019, Reference Nsangou Ngapna, Balla Ateba and Owona2026 a; Balla Ateba et al. Reference Balla Ateba, Owona, Nsangou, Manga, Minyem and Mvondo2021) and in other margins worldwide (Goldrick and Bishop, Reference Goldrick and Bishop1995; Larue Reference Larue2008; Ambili and Narayana, Reference Ambili and Narayana2014). Earthquakes can often be related to tectonic activity (Sandron et al. Reference Sandron, Santulin, Tamaro, Orci, Benedetti, Castellaro, Romeo, Rebez, Grimaz, Malisan, Guadagnini, Sciascia and Slejko2019; Aju et al. Reference Aju, Achu, Pranav and Reghunath2022; Nsangou Ngapna et al. Reference Nsangou Ngapna, Owona, Balla Ateba, Mboudou and Wabo Defo2022, Reference Nsangou Ngapna, Owona and Balla Ateba2024, Reference Nsangou Ngapna, Balla Ateba and Owona2026 a, b; Mbossi et al. Reference Mbossi, Ndibi, Abate Essi, Wokwenmendam, Ntepe, Meghraoui, Ateba and Tabod2026). Seismic activity is very high in the WCHM and can explain the origin of tectonic activity observed in the BMR (Figure 2b). Thus, tectonic activity was reported on the main geological features that crosscut or surround the BMR and occurred either during the Cryogenian-Ediacaran North Equatorial orogenic belt, associated with the Pan-African orogeny, or after and remained active (Ngako et al. Reference Ngako, Affaton, Nnangue and Njanko2003; Njonfang et al. Reference Njonfang, Ngako, Kwekam and Affaton2006, Reference Njonfang, Ngako, Moreau, Affaton and Diot2008; Kwékam et al. Reference Kwékam, Liégeois, Njonfang, Affaton, Hartmann and Tchoua2010; Njanko et al. Reference Njanko, Nédélec, Kwékam, Siqueira and Esteban2010). They include the CCSZ, BTJ, FBSZ, FFSZ and CVL activity, which have probably played a major role by favouring fracturing and/or uplift, tilting or surface flattening. These major faults are accompanied by the CASZ, which further complicates the tectonic setting (Figures 1 and 2). The CCSZ develops several branches known as the Ngaoundere and Foumban faults (Browne and Fairhead, Reference Browne and Fairhead1983; Ngako et al. Reference Ngako, Jegouzo and Nzenti1991). It represents an active, deep and post-collisional structure with Cretaceous and Cenozoic reactivations (Moreau et al. Reference Moreau, Regnoult, Déruelle and Robineau1987; Ngako et al. Reference Ngako, Affaton, Nnangue and Njanko2003; Njonfang et al. Reference Njonfang, Ngako, Kwekam and Affaton2006). The FBSZ is observed in some plutonic, igneous and metamorphic rocks such as granites, mylonites and gneisses during the late dextral event (558–564 Ma). This strike-slip fault indicates a transpressive tectonic regime (Njonfang et al. Reference Njonfang, Ngako, Moreau, Affaton and Diot2008; Fozing et al. Reference Fozing, Kwékam, Gountié Dedzo, Asaah Asobo, Njanko, Tcheumenak Kouémo, Efon Awoum and Njonfang2019; Efon Awoum et al. Reference Efon Awoum, Fozing, Kwékam, Tcheumenak Kouémo, Choumele and Achu2020; Ntieche et al. Reference Ntieche, Wokwenmendam, Nchouwet, Mounjouohou and Mfepat2020). FFSZ marks the SW extension of the CCSZ. The development of this shear zone began with sinistral movements (610–580 Ma) and continued with dextral movements (585–540 Ma) (Njonfang et al. Reference Njonfang, Ngako, Kwekam and Affaton2006; Ngako et al. Reference Ngako, Affaton, Nnangue and Njanko2003, Reference Ngako, Affaton and Njonfang2008; Tcheumenak Kouémo et al. Reference Tcheumenak Kouémo, Njanko, Kwékam, Naba, Bella Nké, Yakeu Sandjo, Fozing and Njonfang2014). The triple junction includes the NE–SW system corresponding to the Benue trough, the E–W system to the Central Atlantic margin and the N–S system to the South Atlantic margin (Figure 2b; Popoff et al. Reference Popoff, Benkhelil, Simon and Motte1983; Regnoult, Reference Regnoult1986; Benkhelil, Reference Benkhelil1988). These reactivated faults play a major role in the formation of post-orogenic transient and relict landforms, as seen in the WCH (Nsangou Ngapna et al. Reference Nsangou Ngapna, Owona, Balla Ateba, Mboudou and Wabo Defo2022; Wabo Defo et al. Reference Wabo Defo, Owona, Nsangou Ngapna, Balla Ateba and Mwabanua Mutabi2022). Evidence of these reactivations is provided by the inversion of kinematic markers (Ngako et al. Reference Ngako, Affaton, Nnangue and Njanko2003, Reference Ngako, Affaton and Njonfang2008; Njonfang et al. Reference Njonfang, Ngako, Kwekam and Affaton2006, Reference Njonfang, Ngako, Moreau, Affaton and Diot2008; Tcheumenak Kouémo et al. Reference Tcheumenak Kouémo, Njanko, Kwékam, Naba, Bella Nké, Yakeu Sandjo, Fozing and Njonfang2014; Efon Awoum et al. Reference Efon Awoum, Fozing, Kwékam, Tcheumenak Kouémo, Choumele and Achu2020; Ntieche et al. Reference Ntieche, Wokwenmendam, Nchouwet, Mounjouohou and Mfepat2020) and by earthquake focal mechanisms, which help constrain the sense of fault motions (see Nsangou Ngapna et al. Reference Nsangou Ngapna, Owona, Balla Ateba, Mboudou and Wabo Defo2022, Reference Nsangou Ngapna, Balla Ateba and Owona2026 a). Thus, comparison of the available seismic parameters, earthquake focal mechanisms and kinematic indicators suggests that the neotectonic structures within the BMR are predominantly controlled by a strike-slip tectonic regime. This regime is expressed through (i) transpressional movements, representing a transition from strike-slip deformation to compression; and (ii) transtensional movements, representing a transition from strike-slip deformation to extension. These interpretations are consistent with previous studies (Ngako et al. Reference Ngako, Affaton, Nnangue and Njanko2003; Nsangou Ngapna et al. Reference Nsangou Ngapna, Owona, Balla Ateba, Mboudou and Wabo Defo2022, Reference Nsangou Ngapna, Balla Ateba and Owona2026 a; Mbossi et al. Reference Mbossi, Ndibi, Abate Essi, Wokwenmendam, Ntepe, Meghraoui, Ateba and Tabod2026).
5.c. Lithospheric mantle dynamism and endogenic processes on the evolution of the BMR
The Western Cameroon landscape is made up of several crustal interactions inferred to result from collision between the Congo and West African/Saharan cratons during the Ediacaran-Cryogenian Pan-African orogeny between 650 and 542 Ma (Toteu et al. Reference Toteu, Van Schmus, Penaye and Michard2001; Caxito et al. Reference Caxito, Santos, Ganade, Bendaoud, Fettous and Bouyo Houketchang2020; Owona et al. Reference Owona, Ratschbacher, Nsangou Ngapna, Gulzar, Jand and Ekodeck2021). This collision, by its crustal thickening, formed the earliest or primary Central African Surface (Boulvert, Reference Boulvert1996). Numerous geodynamic models have been proposed for the formation of the CVL. These models highlight mantle dynamics and endogenic processes through several mechanisms that lead to the genesis of volcanoes along the West African margin. The geodynamic models include (i) modifications of mantle plume trace, (ii) diversion of material along the CASZ, (iii) convection driven by shear along the base of the transition zone, (iv) convection driven by thermal contrasts combined with contrasts in lithospheric thickness, (v) convection driven by contrasts in lithospheric thickness in a thermally homogenous mantle and (vi) lithospheric instabilities driven by the juxtaposition of oceanic and continental lithosphere (Milleli et al. Reference Milelli, Fourel and Jaupart2012; Adams et al. Reference Adams, Wiens, Nyblade, Euler, Shore and Tibi2015; Adams, Reference Adams2022; Singh et al. Reference Singh, Padhy and Silwal2025). However, the CVL, linked to the West and Central African Rift System (Ghomsi et al. Reference Ghomsi, Tenzer, Njinju and Steffen2022; Che Ngu and Njinju, Reference Che Ngu and Njinju2025) and the Aptian opening of the southern Atlantic Ocean, suggests that its development might be related to continental rifting, mantle upwelling and the interplay between tectonic (exhumations/uplifts, tilts) and magmatic activities (Moreau et al. Reference Moreau, Regnoult, Déruelle and Robineau1987; Meyers et al. Reference Meyers, Rosendahl, Harrison and Ding1998; Déruelle et al. Reference Déruelle, Ngounouno and Demaiffe2007; Williams et al. Reference Williams, Stamps, Austermann, King and Njinju2024). The Benue Trough and the Garoua Rift are characterised by a thin lithosphere, probably as a result of the Mesozoic rifting that led to the opening of the South Atlantic (Burke et al. Reference Burke, Dessauvage and Whiteman1972; Okereke, Reference Okereke1988; Poudjom Djomani et al. Reference Poudjom Djomani, Nnange, Diament, Ebinger and Fairhead1995). The WCH, situated between the northern Benue Trough and the oceanic CVL, also exhibits a relatively thin lithosphere, with lithosphere–asthenosphere boundary depths similar to those observed in the Benue Trough (Saeidi et al. Reference Saeidi, Hansen and Nyblade2023; Che Ngu and Njinju, Reference Che Ngu and Njinju2025). Together, these endogenic processes, including active faults and the activity of the CVL, have played a significant role in shaping the complex evolution and dynamic landscape of the BMR.
5.d. Modelling of regional tectonic activity of the BMR
Like the Western Cameroon Highland Margin, several active regional and local faults cross-cut the BMR (Figures 1b, c and 2b). Nsangou Ngapna et al. (Reference Nsangou Ngapna, Owona, Balla Ateba, Mboudou and Wabo Defo2022) showed that these faults, through their characteristics, are responsible for the focal mechanisms of the earthquakes affecting this region. The focal mechanisms induce extension, compression, strike-slip, oblique slip, transition from slip to compression and transition from slip to extension, each time with impacts on the morphology of the study area (Figure 2b). In order to assess tectonic activity in the BMR, we used the relationship between IAT and AHP values as well as structural features. Based on computed IAT and AHP values in each sub-basin, four (04) classes of tectonic activity were defined (Table 4; Figures 9 and 12). Class 1 (IAT < 1.5 for ∼2.56% and AHP < 1.5 for ∼9.40%), class 2 (1.5 ≤ IAT < 2.0 for ∼25.64% and 1.5 ≤ AHP < 2.0 for ∼38.90%), class 3 (2.0 ≤ IAT < 2.5 for ∼52.99% and 2.0 ≤ AHP < 2.5 for ∼35.04%) and class 4 (IAT ≥ 2.5 for ∼18.81% and AHP ≥ 2.5 for ∼16.66%) correspond to very high, high, moderate and low active tectonics, respectively. These calculated IAT (around 81.19%) and AHP (around 83.34%) values reveal moderate-to-very high tectonic activity within the BMR, reflecting an unstable geological setting (Argyriou et al. Reference Argyriou, Teeuw, Soupios and Sarris2017; Anand and Pradhan, Reference Anand and Pradhan2019; Saber et al. Reference Saber, Isik and Caglayan2019; Nsangou Ngapna et al. Reference Nsangou Ngapna, Owona, Mvondo Owono, Balla Ateba, Manga Tsimi, Mvondo Ondoa and Ekodeck2020, Reference Nsangou Ngapna, Owona and Balla Ateba2024; Balla Ateba et al. Reference Balla Ateba, Nsangou, Owona and Mboudou2023; Spyrou et al. Reference Spyrou, Maroukian and Evelpidou2024). The histogram presented in Figure 12a shows that IAT values are predominantly concentrated within the intermediate classes (classes 2 and 3). This clustering reflects a moderate dispersion of values around the average (2.16), suggesting that the IAT method tends to smooth spatial variations in tectonic activity. In contrast, the AHP-based histogram (Figure 12b) displays a broader distribution of values, with discontinuous peaks, highlighting the greater sensitivity of this method in discriminating tectonic activity classes. The associated probability curves show an overall Gaussian distribution, indicating statistical consistency. The IAT curve takes the shape of a bell, with a central tendency located between the values ∼2–2.4 (Figure 12a). The probability curve of the AHP shows a distribution that also appears close to a normal distribution but more irregular, with local fluctuations. This suggests a less homogeneous distribution incorporating specific local variability compared to the IAT. The peak frequency is between 1.8 and 2.2 (Figure 12b).
Frequency distribution histograms and associated Gaussian curves for (a) IAT and (b) AHP.

A combined analysis of the IAT and AHP histograms demonstrates that, although both methods yield broadly comparable tectonic activity classes, the AHP approach provides a finer gradation of values. In contrast, the IAT results are characterised by more discrete groupings. These differences arise from distinct methodological frameworks, particularly in the weighting and hierarchical structuring of criteria, which explain the observed discrepancies between IAT and AHP outcomes.
Our proposed model along the CVL highlights 3D topographic cross-section profiles in the NW–SE and NE–SW directions (Figure 13a–f). Profiles A–A’, B–B’ and C–C’ follow a NW–SE orientation while D–D’, E–E’ and F–F’ align with a NE–SW orientation, corresponding to the dominant tectonic and topographic structures in the study area. In profile A–A’, the high to very high AHP values (classes 1 and 2) coincide with the portions of the profile where the topography is the highest, whereas moderate AHP values (class 3) represent lower surfaces. The B–B’ and C–C’ profiles show practically the same evolutionary trend as the previous one. These highest AHP values of class 1 occur on the CCSZ, TBSZ and FBSZ, while high AHP values of class 2 are located along the TBSZ, FBSZ, FFSZ and CrF. The moderate-to-high AHP values of classes 2 and 3 in profile D–D’ are located along the CrF and NgF. However, the very high AHP values (class 1) in profiles E–E’ and F–F’ are located on the CCSZ, while some parts of the NgF and FBSZ show high tectonic activity (class 2). In profiles D–D’ and E–E’, the low tectonic activity values of class 4 appear on several local faults along the low topographic surface. Almost all these NW–SE and NE–SW profiles exhibit strong tectonic activities concentrated in high-relief areas along fracture zones. On the other hand, IAT curves vary from one profile to another and show the same evolutionary trend as the previous AHP results. These IAT and AHP results indicate that the tectonic activity in the BMR is heterogeneous and polyphased (Nsangou Ngapna et al. Reference Nsangou Ngapna, Owona, Balla Ateba, Mboudou and Wabo Defo2022; Wabo Defo et al. Reference Wabo Defo, Owona, Nsangou Ngapna, Balla Ateba and Mwabanua Mutabi2022).
Topographic profiles illustrating a graphic comparison between IAT and AHP results.

Figure 13. Long description
A series of topographic profiles illustrating a graphic comparison between IAT and AHP results across different regions in Cameroon. Panel A-A’: This profile shows the elevation changes from northwest to southeast. The topographic profile is depicted in gray, the AHP result in green, and the IAT result in orange. Various tectonic activity markers are indicated, including very high tectonic activity (green stars), high tectonic activity (pink circles), moderate tectonic activity (red squares), and low tectonic activity (green triangles). Key tectonic features such as the Tchollir-Banyo Shear Zone (TBSZ), Foumban-Bankim Shear Zone (FBSZ), and Fodjomekwet-Fotouni Shear Zone (FFSZ) are labeled. Panel B-B’: This profile shows the elevation changes from northwest to southeast. Similar to Panel A-A’, it includes topographic profile, AHP result, IAT result, and tectonic activity markers. The Central Cameroon Shear Zone (CCSZ) is also labeled. Panel C-C’: This profile shows the elevation changes from northwest to southeast. It includes the topographic profile, AHP result, IAT result, and tectonic activity markers. The Ngoundere Fault (NgF) is labeled. Panel D-D’: This profile shows the elevation changes from northeast to southwest. It includes the topographic profile, AHP result, IAT result, and tectonic activity markers. The Coastal Fault (CfF) and Ngoundere Fault (NgF) are labeled. Panel E-E’: This profile shows the elevation changes from northeast to southwest. It includes the topographic profile, AHP result, IAT result, and tectonic activity markers. The Central Cameroon Shear Zone (CCSZ) and Ngoundere Fault (NgF) are labeled. Panel F-F’: This profile shows the elevation changes from northeast to southwest. It includes the topographic profile, AHP result, IAT result, and tectonic activity markers. The Ngoundere Fault (NgF) is labeled.
The differential tectonic activity obtained from the IAT and AHP results in this zone could be associated with the Eburnean/Trans-Amazonian and Pan-African/Brasiliano orogenies (Feybesse et al. Reference Feybesse, Johan, Triboulet, Guerrot, Mayaga-Mikolo, Bouchot and N’dong1998; Toteu et al. Reference Toteu, Van Schmus, Penaye and Michard2001; Abdelsalam et al. Reference Abdelsalam, Liégeois and Stern2002; Lerouge et al. Reference Lerouge, Coherie, Toteu, Penaye, Milesi, Tchameni, Nsifa, Fanny and Deloule2006; Loose and Schenck, Reference Loose and Schenk2018; Caxito et al. Reference Caxito, Santos, Ganade, Bendaoud, Fettous and Bouyo Houketchang2020; Owona et al. Reference Owona, Ratschbacher, Afzal, Nsangou Ngapna, Mvondo Ondoa and Ekodeck2020, Reference Owona, Ratschbacher, Nsangou Ngapna, Gulzar, Jand and Ekodeck2021, Reference Owona, Schulz, Minyem, Ratschbacher, Chako Tchamabe, Olinga, Mvondo Ondoa and Ekodeck2022). It is accompanied by crustal thickening and upper crustal deformation marked by exhumations/uplifts and the syn- to post-tectonic emplacement of granitoids, which can be considered among the main causes of the high topography of the study area (Nsangou Ngapna et al. Reference Nsangou Ngapna, Owona, Balla Ateba, Mboudou and Wabo Defo2022; Wabo Defo et al. Reference Wabo Defo, Owona, Nsangou Ngapna, Balla Ateba and Mwabanua Mutabi2022). Therefore, the rifting that formed the Mamfe basin (Upper Albian to Lower Cenomanian) is thought to have been accompanied by rapid tectonic subsidence and tilting. The BMR landscape’s complexity reinforces the idea of a major control by active tectonics (Pérez-Peña et al. Reference Pérez-Peña, Azor, Azañón and Keller2010; Matoš et al. Reference Matoš, Tomljenovic and Trenc2014; Saber et al. Reference Saber, Isik and Caglayan2019; Talukdar et al. Reference Talukdar, Kothyari and Pant2019; Spyrou et al. Reference Spyrou, Maroukian and Evelpidou2024), secondarily influenced by lithological, climatic and eustatic variations, as well as erosion processes (Larue, Reference Larue2008; Ambili and Narayana, Reference Ambili and Narayana2014; Gaidzik and Ramírez-Herrera, Reference Gaidzik and Ramírez-Herrera2017; Wabo Defo et al. Reference Wabo Defo, Owona, Nsangou Ngapna, Balla Ateba and Mwabanua Mutabi2022). The ongoing fault reactivations and the activity of the CVL remain central to the landscape evolution of the WCH. Previous studies have demonstrated significant effects of lateral variations in lithospheric thickness and reactivations of major fault systems, such as the CCSZ, TBSZ, FBSZ, BTJ and FFSZ (Unternehr et al. Reference Unternehr, Curie, Olivet, Goslin and Beuzart1988; Ngako et al. Reference Ngako, Affaton, Nnangue and Njanko2003; Njonfang et al. Reference Njonfang, Ngako, Kwekam and Affaton2006; Tokam et al. Reference Tokam, Tabod Tabod, Nyblade, Julia, Wiens and Pasyanos2010; Tcheumenak Kouémo et al. Reference Tcheumenak Kouémo, Njanko, Kwékam, Naba, Bella Nké, Yakeu Sandjo, Fozing and Njonfang2014; Kanouo et al. Reference Kanouo, Kouské, Lentz and Yongué2021; Mbossi et al. Reference Mbossi, Ndibi, Abate Essi, Wokwenmendam, Ntepe, Meghraoui, Ateba and Tabod2026). Finally, the regional tectonic model proposal synthesises interactions between geological heterogeneities, climate, erosion and tectonic dynamics in and around the BMR and the complex evolution of its landscape.
6. Conclusion
The BMR, part of the West Cameroon Highlands (WCH), exhibits a transient landscape characterised by several regional (CCSZ, TBSZ, BTJ and FBSZ) and local (FFSZ, NgF and CrF) major fault systems that are likely still tectonically active. The relative tectonic activity of the BMR was assessed using seven geomorphic indices and GIS-based approaches, combined with field investigations. The main results are summarised as follows:
-
1. Normalised stream profiles and concavity factor analyses reveal a transient landscape state characterised by various types of knickpoints, reflecting tectonic reactivation processes, strong structural control, lithological variations and differential erosion.
-
2. Geomorphic indices demonstrate that differential tectonic activity plays a key role in controlling drainage basin morphology and the overall landscape evolution of the BMR.
-
3. The drainage basin systems of the BMR display moderate-to-very high relative tectonic activity, estimated at approximately 81.19% and 83.34%, according to the IAT and AHP approaches, respectively.
-
4. Neotectonic structures within the BMR are mainly governed by a strike-slip tectonic regime, expressed through both transpressional and transtensional deformation processes.
-
5. Both IAT and AHP assessment models emphasise the dominant influence of the active CVL, which is associated with geodynamic processes involving lithospheric mantle dynamics, asthenospheric upwelling and upper crustal deformation.
These findings provide new insights into the morphotectonic evolution of the BMR. The combined application of IAT and AHP approaches provides consistent and reliable results, thereby representing a robust methodological framework that can be applied to other tectonically active regions.
Future research should further refine these interpretations by reassessing the differential response of lithological units to erosion while integrating the potential influence of eustatic sea-level fluctuations on topographic evolution, particularly in view of the proximity of the study area to the Atlantic Ocean.
Acknowledgements
The authors would like to express their gratitude to the Government of Cameroon and its Ministry of Higher Education for providing the Research Modernisation Allowance, which partially supported the field trip. We also thank the anonymous reviewers for their valuable constructive criticisms and suggestions.
Authors’ contributions
Study conception and design: Pascal Landry Wabo Defo. Acquisition of data: Pascal Landry Wabo Defo, Nsangou Ngapna Moussa and Balla Ateba Moïse Christian. Analysis and interpretation: Pascal Landry Wabo Defo, Nsangou Ngapna Moussa, Balla Ateba Moïse Christian and Owona Sébastien. Drafting of the manuscript: Pascal Landry Wabo Defo and Nsangou Ngapna Moussa. Critical revision: Owona Sébastien. All authors have read and approved the final manuscript.
Competing interests
The authors declare that they have no known competing financial interests or personal relationships that could have appeared to influence the work reported in this paper.


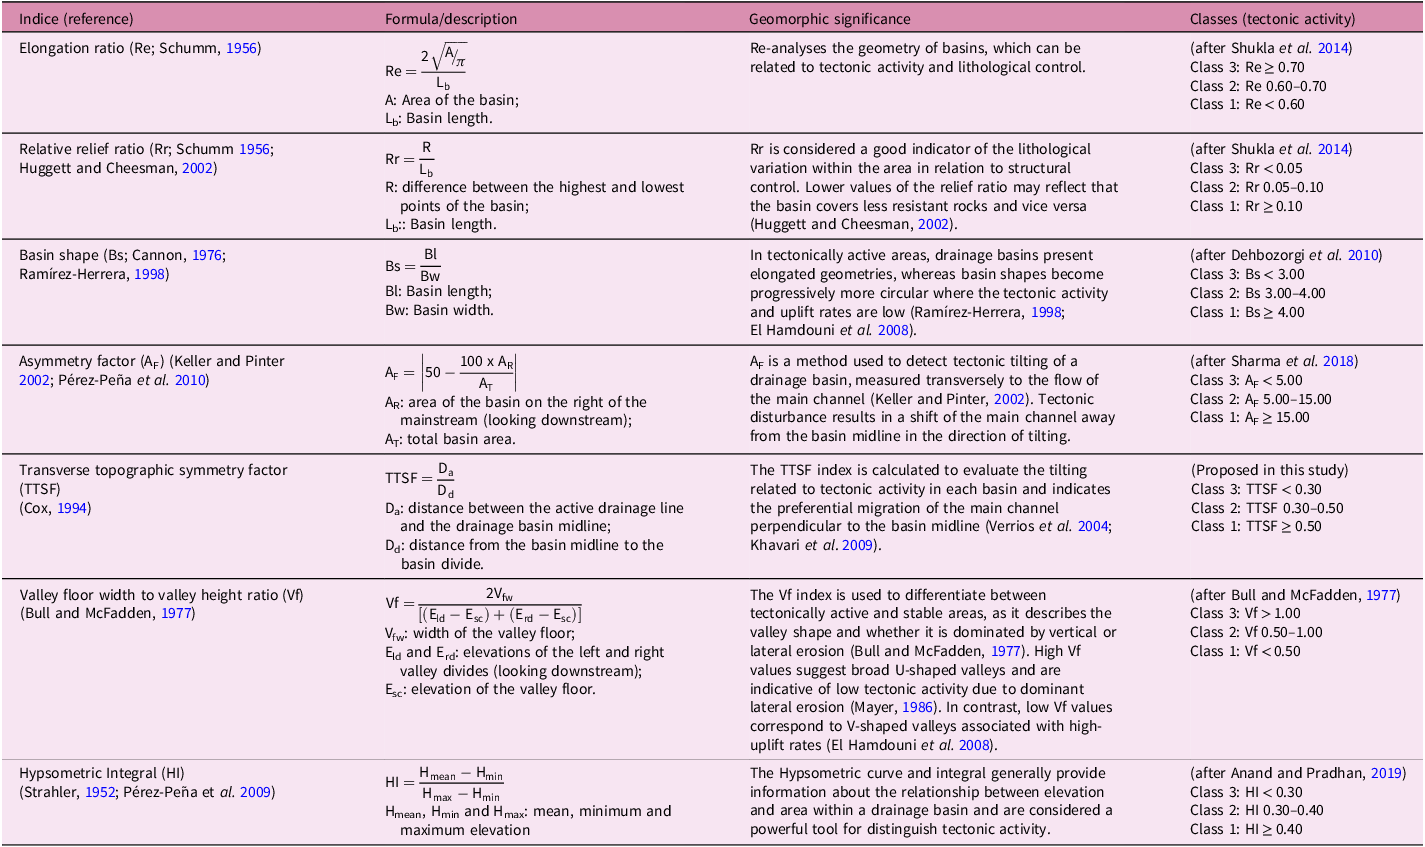




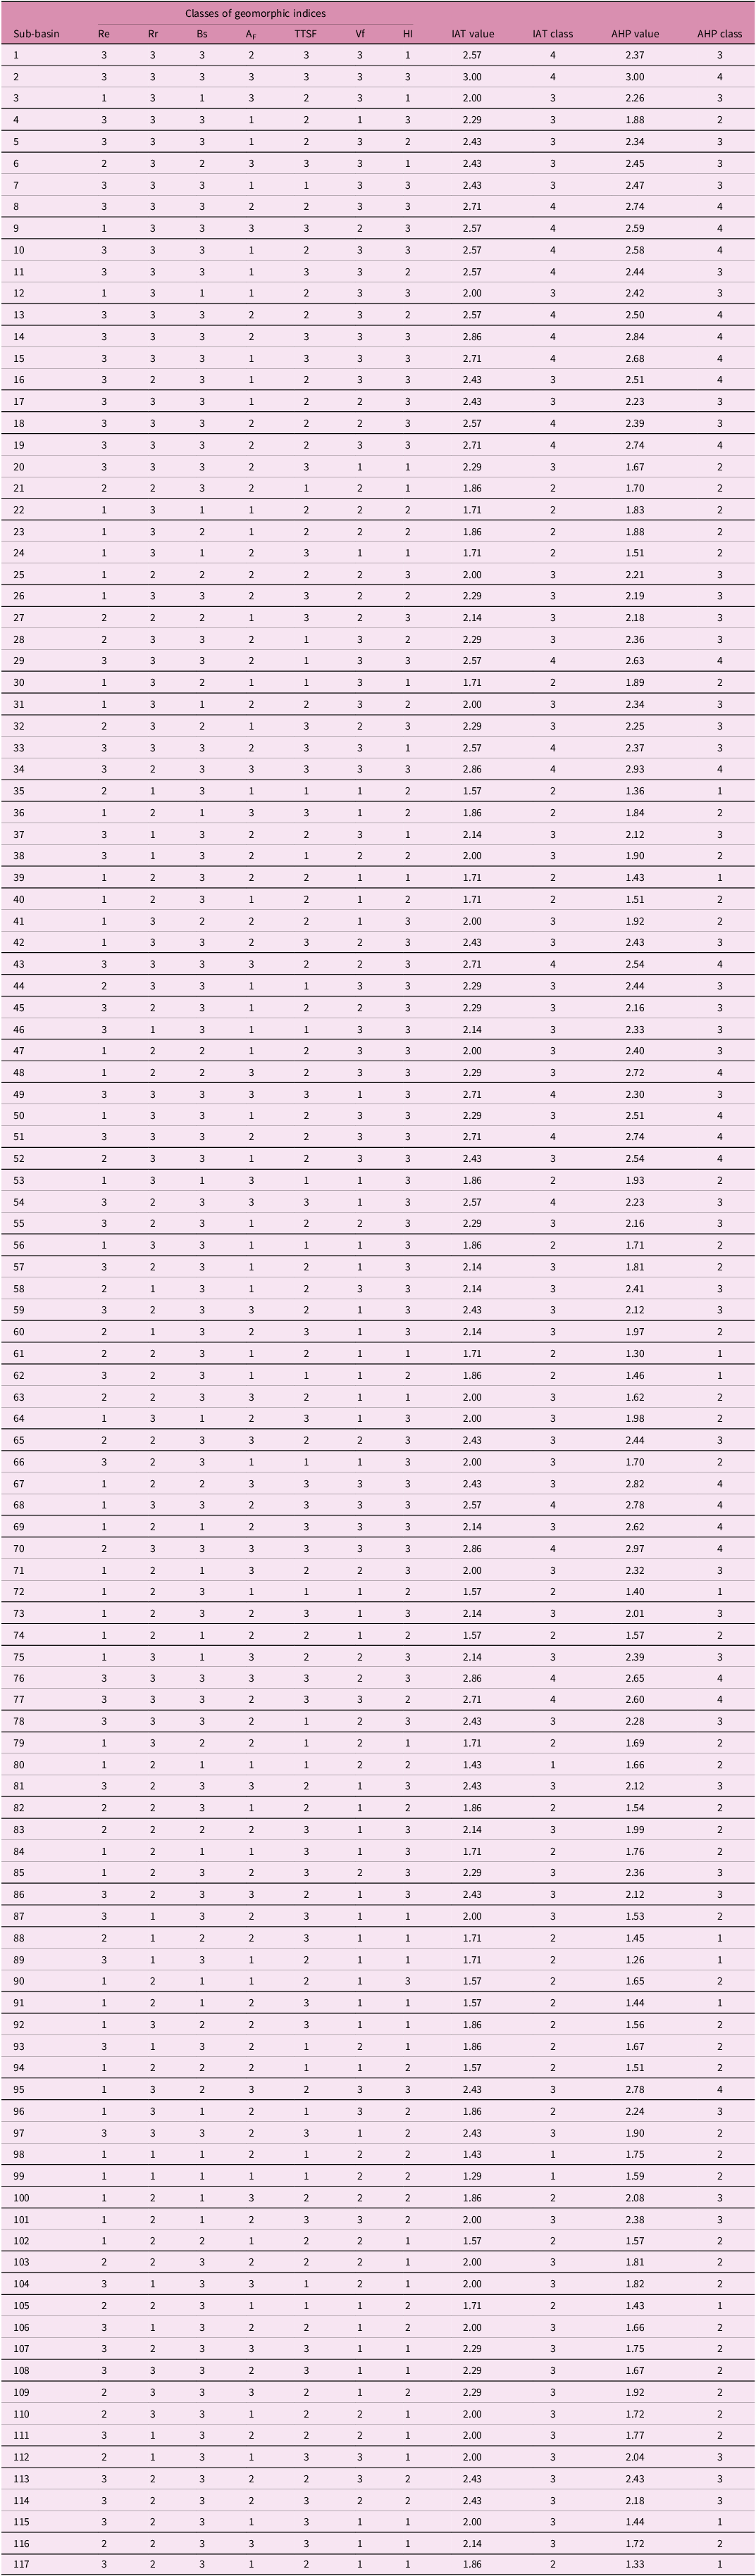


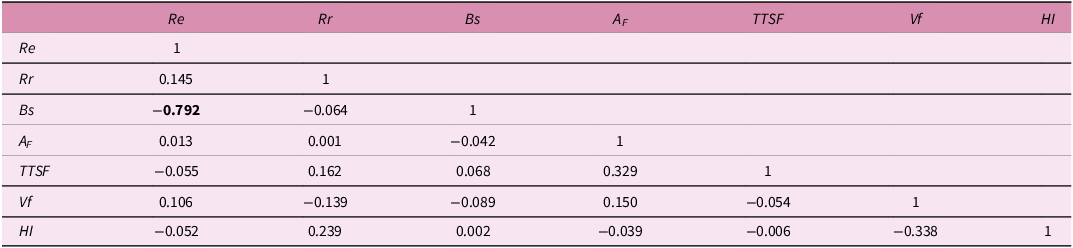
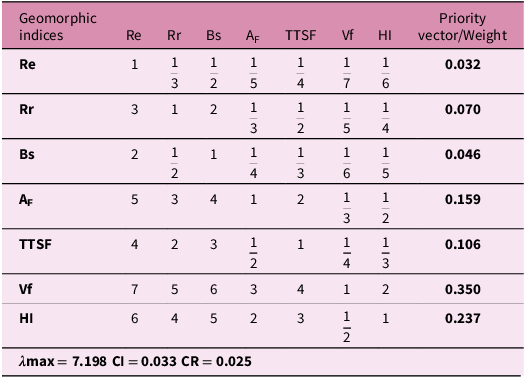


 Open access

