


1. Introduction
The accompanying paper (Connolley and O'Farrell, 1998) on the trend in warming simulated over the last century by three coupled ocean-atmosphere climate models showed that the models did not simulate the significant warming observed in recent decades in the Antarctic Peninsula region where the highest density of station data is available. This inability of the models to match the existing climate record in the Peninsula region raises questions as to flow accurate the predictions of future climate trends from these models may be across the Antarctic region. The model simulations included the effective rate of co^ increase for the last century, but changes in aerosols, solar radiation, volcanic eruptions and ozone were not included. Except for ozone, these effects are not thought to have a significant regional effect over Antarctica. Additional issues of concern addressed in this paper include the impact of regional climate drift and the inter-decadal variability in both control and transient simulations.
Connolley and O'Farrell (1998) described the trends seen at key Antarctic stations over the last few decades. The level of warming is greatest on the west coast of the Antarctic Peninsula in winter (0.8°C per decade) and at Dumont d'Urville and Casey in East Antarctica (0.6°C per decade). Note that these stations are in regions where the winter sea-ice cover does not extend far from the coast. Several Antarctic stations show negative temperature trends over the period (Mawson and South Pole; Reference JonesJones, 1995). With such a complex distribution of temperature changes, it is a major test of the coupled model to mirror this pattern of change, and a check on whether the high-latitude interactions are performing reasonably in the coupled model.
In this paper, to improve the signal-to-noise ratio, wc examine the greenhouse signal over the next century when the rate of CO2 increase has accelerated, to see whether the pattern of warming in the models over the Antarctic region is reinforced, and what pattern if any develops over the Antarctic Peninsula.
The U.K. Meteorological Office (UKMO) and Commonwealth Scientific and Industrial Research Organisation (CSIRO) models show some evidence of an enhanced warming in the area of sea-ice retreat in the Bellingshausen Sea adjacent to the Peninsula (Connolley and O'Farrell, 1998), but the signal is not present in all seasons and does not increase linearly in strength with higher CO2 concentrations. If we expect the rate of ice removal to be the governing factor for the temperature anomaly due to the polar amplification of the temperature response in regions of ice loss, then the signal should amplify as the rate of removal increases. However, there is significant inter-decadal variability in the temperature signal, whilst the rate of ice reduction is fairly steady, so other factors must also play a significant role.
The details of each model's formulation and approach to coupling are documented by Reference Gordon and O'FarrellGordon and O'Farrell (1997) and Reference JohnsJohns and others (1997) . Both models have horizontal resolution which is adequate to represent the topographic features of most of Antarctica except the Antarctic Peninsula. The latter is a very narrow and high strip of land and in reality is a barrier to atmospheric flow (Reference King and TurnerKing and Turner, 1997). in the models it is lower and broader and less of a bar-
Change between 2081 and 1971 for UKMOHADCM2 model in (a) screen temperature (°C), (b) ice compactness, (c) 5 m ocean temperature, (d) 140 m ocean temperature, (e) divergence of ocean/ice velocities in 2081 (10 −8 X S−1), and(f) curl of wind stresses (10 −8 X Nm −2S−1).

rier to flow (Connolley and Cattle, 1994). in the present simulations, both models are forced with the increment of effective CO2 concentration that matches the rate seen in the last century, and then with IS92A emission scenario for increasing concentrations for the next century. Both simulations have the same initial level of CO2 concentrations. We
Fig. 2. Change between 2081 and 1971 for CSIRO (GM) model in (a) screen temperature, (b) ice compactness, (c) 12m ocean temperature, (d) 140 m ocean temperature.

will refer throughout to decadal periods (say, 1971 -90) from the two simulations to aid the comparison of the two models. These are not definite time lines for the future climate, but only for the scenario of effective CO2 increases we have imposed in the model simulations. No account has been taken of aerosols in either run, as forecast changes due to aerosols are considerably smaller in the Southern Hemisphere (Reference Mitchell, Joins, Gregory and TeuMitchell and others, 1995). The main differences in the ocean components of the models are that the CSIRO model includes the Gent—McWilliams (GM) eddy-mixing parameterisation as described by Reference Hirst, Gordon and O'FarrellHirst and others (1996), which alters the stratification, water masses and areas of potential heat subduction in the Southern Ocean, while the UKMO model has an embedded Kraus-Turner mixed layer.
2. Atmospheric/Sea-Ice/Ocean-Temperature Distributions A Century From Now
figures 1 and 2 show the changes in screen air temperature, ice compactness, surface ocean temperature and subsurface ocean temperature al a depth of 140 m (chosen because it is beneath the mixed layer and common to both models) for the June August (JJA) season, between the 20 year average starting at 1971 and the 20 year average starting at 2081, in the UKMO and CSIRO models, respectively. The UKMO model shows a strong air-temperature warming of 8°C in the eastern Weddell Sea and a warming of 5°C in the Bellingshausen Sea near the Peninsula. There is no temperature maximum over the Peninsula, with a winter temperature increase of 3-4°C, whilst several regions of the continent's interior have temperature changes of >6°C. The overall pattern is very similar to that seen in Connolley and O'Farrell (1998, fig. 1a) for the modelled warming trend over the last century, showing that the overall dynamics governing the pattern is fixed. A similar statement can be made about the CSIRO air-temperature patterns. We see that even when enhanced forcing makes the model response clearly visible above the naturally occurring variability, the warming in the Peninsula area is modest in comparison with warming around other parts of Antarctica.
All but one of the temperature changes in the UKMO results over the sea-ice area are accompanied by reductions in sea-ice compactness; the exception is close to the Ross Ice Shelf where the ocean cools (fig. 1b and c). Another major region of ocean cooling is in the eastern Weddell Sea just to the southwest of the air-temperature anomaly. Although there is minimal warming on the ocean surface directly under the ice, the data at 140 m (fig. 1d) show there is a core of warm water (up to 2°C and 0.15‰) at 60-65° S beneath the large air-temperature anomaly in the Weddel! Sea, but only 1°C warming beneath the anomaly in the Bellingshausen Sea where there is greater warming at depth at 60°S. The warm-core feature in the Wcddcll Sea extends around most of the continent and has similar water-mass properties to water just beneath the thermoclinc in the 1971 salinity and temperature sections at these latitudes. Although the surface ocean has freshened (as a result of ice melt, reduced ice formation and precipitation-evaporation changes; Gordon and O'Farrell, 1997), the mixed layer has become deeper at 65° S, and the warm-core water seen at 140 m depth is water entrained from beneath the thcrmo-cline. However, this warming is not seen closer to the surface of the ocean where the salinity stratification in summer prevents the water temperature from rising much above the freezing point. Hence, this warm core at 140 m is not responsible for the reduced sea-ice compactness. Figure le shows the change in the divergence between 2081 and 1971 in the meanJJA ocean currents (ice velocities in UKMO model). A comparison with Figure lb clearly shows that the ice-compactness anomalies are in regions of continual winter ice divergence. These changes in the ocean dynamics are driven by changes to the curl of the wind stress (Fig. 11]. There is a large positive anomaly in the curl of the wind stresses in the eastern Weddel 1 Sea close to the ice-compactness anomaly. There are also strong positive anomalies off the East Antarctic coast (90-120°E) which are also areas of ice-compactness decrease and warm-air temperature anomalies. The wind-stress curl has a sharp transition to negative values at 55 60° S which matches the sharp transitions in temperature and salinity at 140 m depth of the ocean. The link between wind-stress curl and the subsurface temperature changes is due to the wind forcing controlling the mixed-layer depth.
The CSIRO model also does not show a maximum in air-temperature change (2081-1971) near the Peninsula (fig. 2a). The air-temperature anomaly maxima again mirror the ice-compactness changes, with temperature warming of >8°C, in the East Antarctic pack ice where there is a reduction in compactness of >0.4, and warmings of >5°C in the Bellingshausen Sea where the ice-compactness decrease is slightly smaller at 0.3. There is an area of ice reduction from 20° wto 60° E to the east of the large anomaly in the UKMO model which also has a maximum air-tempcraturc increase of 5°C. Over the interior of the continent the UKMO model shows greater warming than the CSIRO model, whilst the situation is reversed in the Southern Ocean, north of the winter sea-ice edge.
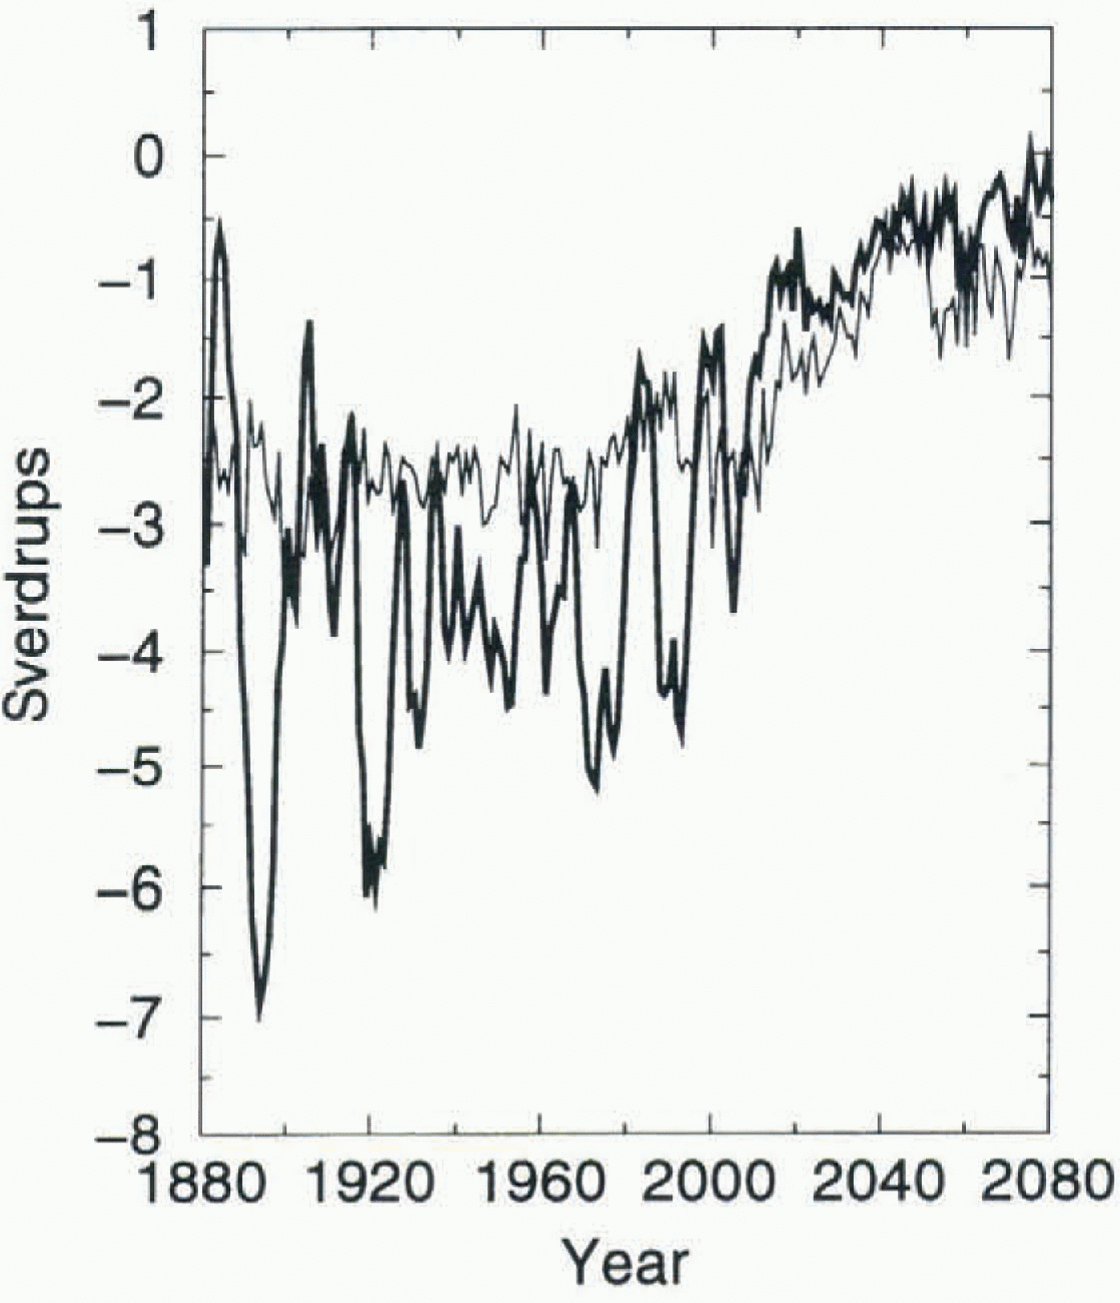
The CSIRO surface ocean-temperature pattern (fig. 2c) shows maxima and minima matching the air-temperature anomalies (fig. 2a), unlike the UKMO model. There are warmings greater than 2°C off East Antarctica and in the Bellingshausen Sea and a cooling in the Ross and Weddell Seas where there is minimal reduction in sea-ice compactness and only a 2-3°C air-temperature increase. The reduced warming (even cooling) in the Ross and Wcddcll Seas in the CSIRO model is due to the changes in meridional circulation that occur as deep water formation is switched oif(Fig. 3).
Meridional overturning in Weddell Sea (bold line) and Ross Sea (light line) in CSIRO transient model simulation (Sverdrups, 106 ,3 s−1).
The ocean-temperature difference for the CSIRO model at 140 m (fig. 2d) shows that these regions of surface cooling overlay subsurface warming except at the western extremities of the Weddell and Ross Seas. The area of maximum warming off the East Antarctic coastline is above the area of greatest warming (>2°C adjacent to the continent at 140 m depth). The ocean-warming pattern at 410 m in the CSIRO model differs from that in the UKMO at a similar depth (450 m). There is less warming at this depth, but also less cooling in the Ross and Weddell Seas, than in the UKMO simulation.The CSIRO model shows no subsurface increase in salinity in the Southern Ocean. The CSIRO model has less dense bottom water than the UKMO model which uses the method of England (1993) to enhance the salinities at high latitudes. Some differences in the response between the UKMO and CSIRO ocean models may be due to the use of the GM scheme in the CSIRO model. However, an earlier version of the CSIRO model without the GM scheme still showed no evidence of the subsurface salinity enhancement. in contrast to the UKMO model (fig. 1e and f), there is no direct link in the change in the pattern of the curl of the wind stress and the change in ice divergence in the CSIRO model.
3. Signalto Noise in The Ocean Model
One of the main sources of naturally occurring variability in the ocean models is fluctuations in the rate of overturning. However, in the warmer climate of the next century the rates of convection are less, reducing the transfer of warmer water to the surface compared to the control climate, which leads to a net cooling at the surface on the continental shelves (fig. 2c). This is particularly noticeable in the Ross and Weddell Seas which both freshen and cool during the simulation. Figure 3 shows time series of the zonally averaged meridional overturning stream functions calculated at 1500 m depth at 71° S for the Atlantic and Pacific basins of the CSIRO model. The first 100 years of the time series represent the impact of the warming on the overturning stream function over the last century, and the second 100 years the rapid change the model is forecasting with increased warming over the next century. There are large-amplitude inter-decadal changes in the meridional overturning in the early part of both time series (Hirst and others, 1996) which cause variability in the surface ocean temperature, the ice compactness and the air temperature. Both the Ross and Weddell Sea regions show a rapid decline in meridional overturning due to a shutdown in convection 135-140 years into the transient simulation.
These results suggest that the Weddell Sea region is not the ideal place to examine the emergence of a greenhouse signal in the ocean component of the CSIRO coupled model due to high levels of convectivc overturning there. We will now examine the signal-to-noisc ratios in other sectors of the Southern Ocean, where the convective regime in this coupled model is less active. The subsurface ocean-temperature signals represent the process of subduction of heat/salt along isopycnals in the individual basins and advection of the changed water-mass properties downstream in the Antarctic Circumpolar Current.
The control simulation has no drift in the global averaged sea-surface temperature (Hirst and others, 1996), yet there is subsurface drift as the ocean model adjusts to being forced by the high-frequency atmospheric fluxes in coupled mode (Reference PowerPower, 1995). However, the spatial patterns of this drift in the interior ocean are similar and of the same sign to those found in the ocean during the transient warming, as the response is determined by flow along isopycnals, the topographic features in individual basins and the large-scale dynamics. When trying to identify the ocean greenhouse signal in the transient ocean model, the signal needs to be sufficiently larger than this slow background drift and the noise level from convection and the decadal variability in ocean currents.
Figure 4 shows the ocean-temperature difference 100 years (10 year average) into the simulation at 100 m in the control and transient simulations, and the ratios between them for the southeast Pacific, South Atlantic and Southern Ocean based on decadal averages.
After 80 years of the transient simulation it was found that there are only limited regions where the warming signal is 50% greater than the background drift. Only the northern island stations, South Orkneys and South Georgia, have a large enough signal to potentially detect an ocean trend at 100 m depth. By 100 years (equivalent of 1980-90) there is a considerable region of Drake Passage and neighbouring Southern Ocean with warming greater than 0.5°C, and a signal more than 50% greater than the residual drift in the control. However, the Wcddcll and Bellingshausen Seas do not display clear trends at 100 years, due to the variability introduced by the convective process here, which may to some extent expla in the lack of a clear signal in the air-temperature trends over the last century (Connolley and O'Farrell, 1998).
By 130 years after the start of the transient increase in CO2(starting at 1880 levels) the ocean-warming signal is much stronger, confirming the picture presented by the Intergovernmental Panel on Climate Change that the ability c to delect the greenhouse signal from background variability will be clearer within a couple of decades.
Temperature change at 100 m depth (a) after 100 years in CSIRO control simulation, (b) after 100years in transient simulation with increasing concentrations of CO2. (c) Ratio of transient response to contrat at 100years.

4. Link Between Weddell Sea Ice Compactness and Peninsula Warming
The CSIRO transient simulation was started from a point in the control simulation where the model was still adjusting to coupled conditions. This has led to an adjustment in the position of the ocean convective overturning cell in the first 50 years of the transient run in the Weddell Sea which creates a small difference between transient air temperature results relative to 1880 as opposed to a starting-point of 1910. This small difference, however, leads to an air-temperature signal over the Antarctic Peninsula in the autumn freeze-up months of May andJune.The signal, however, disappears in July and for the rest of the winter. The signal becomes stronger through the transient simulation, except for a few decades where it is not present at all.figure 5a shows the change in air temperature for June 2051-60 minus 1881-90. The pattern of ice compactness shows an area of sensitivity in the northern Weddell Sea at the outflow of the Weddell gyre, with reduced compactness in June in the decade starting at 2050 compared to 1880 (fig. 5b).
June changes in CSIRO transient model for (a) temperature 2050-1880, (b) ice compactness 2050-1880.

Fig. 6. Time series in region 65.3-68.5° S, 50.6-61.8° Wof ice compactness in June (light line) and July (bold line).

Figure 6 shows the time series of ice compactness inJune and July for a group of gridpoints in the region of maximum sensitivity to this feature, 65.3 68.5° S and 50.6-61.8° W. All these time series show a period near the start of the simulation when there is less interannual variability in the signal, followed by a period when the variability is much higher. It is the periods of greater variability in ice compactness that have the high-air-temperaturc signal. There is an increase in amplitude of the year-to-year variability of the ice compact-ness as the transient run proceeds, with a decreasing trend appearing from about 2050 onwards.
However, it appears that if a small decrease (5-10%) in ice concentration occurs in the northern Weddell Sea in autumn, then an air-temperature anomaly can form I hat encompasses the Peninsula region, though the anomaly is larger on the east coast of the Peninsula, which is the opposite gradient to that seen in observations (Connolley and O'Farrell, 1998). As winter proceeds, the air temperature over most of the ice-covered region is only 2°C warmer at 2080 than at 1880, and still well below freezing, so the ice cover can still laterally expand ice to reach concentrations of 90-95%. The study of King (1994) did not show a strong correlation between Faraday (west coast of the Antarctic Peninsula) air-temperature trends and Weddell Sea ice extent, only with changes in the Bellingshausen Sea ice extent, but that study considered only overall ice extent, not small changes in ice compactness. As yet, no long-term trends in ice-compactness changes have been confirmed for the entire Antarctic region from the microwave satellite record (Reference Bjorgo, Johannessen and MilesBjorgo and others, 1997), but regional retreats in the Bellingshausen Sea are now viewed as intcr-decadal variability (Reference ParkinsonParkinson, 1995) superimposed on a 20year decrease over the Amundsen and Bellingshausen Seas (Reference Jacobs and ComisoJacobs and Comiso, 1997). The ice compactness and thickness does decrease in the Bellingshausen Sea in the model, but this decrease does not create an air-temperature anomaly over the Peninsula.
Conclusions
The current generation of coupled models does not produce a clear signature of enhanced winter warming in the Antarctic Peninsula region, where a clear trend has been established in the air-temperature record over the last 50 years (King, 1994), and in the observations of accelerated decay of small ice shelves in the region (Reference Vaughan and DoakeVaughan and Doake, 1996). This suggests that the processes that determine the sensitivity in the Peninsula region may be poorly modelled or that the key mechanism or forcing is not included in the climate models. The air-temperature response in the models is correlated strongly with changes in ice com-pactness. Hence, it is the mechanisms that govern the changes of ice compactness that determine whether the model shows an enhanced warming. The UKMO model ice compactness changes show greater sensitivity to ocean-current divergence than to a warming trend of the surface ocean, whilst the CSIRO model shows a stronger coupling between areas of ice retreat and both surface and subsurface ocean-temperature warming.
The observed patterns may be sensitive to processes which are poorly resolved in atmospheric, ice and oceanic components of the coupled system. The Peninsula topography represents a barrier to atmospheric flow, but both models represent this land surface as at most two gridpoints wide, causing this flow to be poorly represented, and higher resolution is required. This poor atmospheric circulation will affect the pattern of stress that drives the ice motion in the Bellingshausen and Weddell Seas and hence the ice thickness/compactness in these regions. The ice-thickness distributions in the Weddell Sea are also much improved at higher resolution (CSIRO models), as are the ocean currents. A major area of improvement in the ocean model, however, would be to better represent the ocean interaction with topography in Drake Passage and the convective process in the Weddell Sea.
Section 4 showed that the CSIRO model was able to demonstrate a signal over the Peninsula region and outlined the mechanism behind this temperature anomaly. Whilst this feature may not be the cause of the observed warming, it is certainly worth investigating further, in particular to see if there is any evidence of changes in the timing of attainment of >90% concentration in the area in the satellite record. Also the recent collapse of the northern Larsen Ice Shelf has improved access for ships to the northwest Weddell Sea region to make océanographie measurements. On the modelling side, this part of the study suggests that the use of improved resolution in the sea-ice component of the model will enable us to better describe the Weddell Sea gyre, and that a re-examination of the parameterisation of lateral melt/growth of ice in leads under transient warming conditions is desirable. This autumn temperature signal is part of the chaotic response of the coupled model to ocean initial conditions. As a Monte Carlo suite of experiments has yet to be done with the CSIRO transient model, the extent of the chaos on the regional greenhouse signature is still to be fully investigated.
Acknowledgements
We are grateful to J. Mitchell and group members at the UKMO Hadley Centre for permission to use model data from their HADGM2 runs; and to the CSIRO climate-modelling group for access to coupled model simulations, and the Antarctic CRC for computer time for the simulation. We also acknowledge comments on the manuscript from A. Jenkins, R. Wood, A. Hirst, p. Whetton and the anonymous reviewers.



