







1. Introduction
Convection is common in the fluid regions of planets and stars. In particular, convection is the primary energy source for the generation of large-scale planetary and stellar magnetic fields (Jones Reference Jones2011; Gastine et al. Reference Gastine, Wicht, Duarte, Heimpel and Becker2014; Aurnou et al. Reference Aurnou, Calkins, Cheng, Julien, King, Nieves, Soderlund and Stellmach2015), and it is thought to be a source of energy for the observed zonal flows in the atmospheres of the giant planets (e.g. Heimpel, Gastine & Wicht Reference Heimpel, Gastine and Wicht2016). The flows in many of these natural systems are considered turbulent and strongly influenced by rotation; previous studies have shown that the combination of these physical ingredients can lead to an inverse kinetic energy cascade (e.g. Smith & Waleffe Reference Smith and Waleffe1999; Seshasayanan & Alexakis Reference Seshasayanan and Alexakis2018). The inverse cascade transfers kinetic energy from small-scale convection up to domain-scale flows, and, in a planar geometry of square cross-section, results in the formation of large-scale vortices (LSVs). (Julien et al. Reference Julien, Rubio, Grooms and Knobloch2012b; Favier, Silvers & Proctor Reference Favier, Silvers and Proctor2014; Guervilly, Hughes & Jones Reference Guervilly, Hughes and Jones2014; Rubio et al. Reference Rubio, Julien, Knobloch and Weiss2014; Stellmach et al. Reference Stellmach, Lischper, Julien, Vasil, Cheng, Ribeiro, King and Aurnou2014). Such vortices have a high degree of vertical invariance, tend to be characterised by flow speeds that are significantly larger than the underlying convection and can have an influence on heat transport and magnetic field generation (Guervilly et al. Reference Guervilly, Hughes and Jones2014; Guervilly, Hughes & Jones Reference Guervilly, Hughes and Jones2015). However, the convective vigour required to excite LSVs, how fluid properties (via the thermal Prandtl number) influence their formation and the scaling of their saturated amplitude with buoyancy forcing still remain poorly understood.
In planetary and astrophysical fluid systems, rapid rotation is thought to play an essential role in shaping the dynamics of convection. The importance of rotation for the dynamics of such systems is quantified by the Ekman and Rossby numbers, respectively defined as
 \begin{equation} Ek = \frac{\nu}{2\varOmega H^2}, \quad Ro = \frac{U}{2 \varOmega H}, \end{equation}
where  $\nu$ is the kinematic viscosity,
 $\varOmega$ is the rate of rotation,
 $H$ is the spatial scale of the system (i.e. the depth of the fluid region) and
 $U$ is a characteristic flow speed;
 $Ek$ and
 $Ro$ quantify, respectively, the ratio of viscous forces to the Coriolis force, and the ratio of inertia to the Coriolis force. Systems in which
 $(Ek,Ro) \ll 1$ are said to be rapidly rotating and rotationally constrained. For the Earth's outer core, for instance, estimates suggest that
 $Ek\simeq 10^{-15}$ and
 $Ro\simeq 10^{-5}$ (de Wijs et al. Reference de Wijs, Kresse, Vočadlo, Dobson, Alfe, Gillan and Price1998; Rutter et al. Reference Rutter, Secco, Uchida, Liu, Wang, Rivers and Sutton2002; Finlay & Amit Reference Finlay and Amit2011). It is currently impossible to use such extreme values of the governing parameters with direct numerical simulation (DNS). Quasi-geostrophic (QG) models have helped to overcome this deficiency, and have been critical for elucidating several convective phenomena that are thought to be of significant interest for planets, including identification of the primary flow regimes of rotating convection, heat transport behaviour and the convection-driven inverse cascade (Julien et al. Reference Julien, Rubio, Grooms and Knobloch2012b; Rubio et al. Reference Rubio, Julien, Knobloch and Weiss2014). QG models accurately capture the leading-order dynamics in systems characterised by small values of
 $Ek$ and
 $Ro$.
Previous work has shown that the structure of LSVs is dependent on the relative importance of rotation: for sufficiently small values of  $Ek$ and
 $Ro$ the large-scale structure is a pair of cyclonic and anticyclonic vortices (hereafter referred to as dipolar LSVs) with zero net (spatially averaged) vorticity (Julien et al. Reference Julien, Rubio, Grooms and Knobloch2012b; Rubio et al. Reference Rubio, Julien, Knobloch and Weiss2014; Stellmach et al. Reference Stellmach, Lischper, Julien, Vasil, Cheng, Ribeiro, King and Aurnou2014); whereas for larger values of
 $Ro$ the cyclonic vortex dominates over the anticyclonic one, leading to a net vorticity that is parallel to the rotation axis (Chan & Mayr Reference Chan and Mayr2013; Favier et al. Reference Favier, Silvers and Proctor2014; Guervilly et al. Reference Guervilly, Hughes and Jones2014). QG models find only a pair of vortices of opposite polarity (dipolar LSVs), since they capture asymptotically small values of
 $Ek$ and
 $Ro$ only, in which there is no preferred sign for the vorticity. DNS studies have found dipolar LSVs when
 $Ek \approx 10^{-7}$ (Stellmach et al. Reference Stellmach, Lischper, Julien, Vasil, Cheng, Ribeiro, King and Aurnou2014), and a dominantly cyclonic LSV when
 $Ek \gtrsim 10^{-6}$ (Chan & Mayr Reference Chan and Mayr2013; Favier et al. Reference Favier, Silvers and Proctor2014; Guervilly et al. Reference Guervilly, Hughes and Jones2014). This distinction in the LSV structure may have consequences on how heat transport and flow speeds are influenced by the inverse cascade. Moreover, for
 $Ro = O(1)$, the presence of a LSV appears to be dependent upon the initial condition used in the simulations (Favier, Guervilly & Knobloch Reference Favier, Guervilly and Knobloch2019). In contrast, for the rapidly rotating regime studied here, we find that the formation of dipolar LSVs is not dependent upon initial conditions (see § 3.3 for details).
Natural systems are characterised by a broad range of fluid properties and, as a result, the Prandtl number  $Pr = \nu / \kappa$ (where
 $\kappa$ is the thermal diffusivity) can take on a wide range of values, ranging from
 $Pr =O(10^{-6})$ in stellar interiors (Ossendrijver Reference Ossendrijver2003) to
 $Pr=O(10^{-2})$ for the liquid metals characteristic of planetary interiors (Pozzo et al. Reference Pozzo, Davies, Gubbins and Alfé2013). More generally, the density heterogeneities that lead to buoyancy-driven convection can also result from compositional differences, as is expected to be the case within terrestrial planetary interiors, for instance; under such circumstances the thermal Prandtl number in the governing equations is replaced by the compositional Schmidt number
 $Sc = \nu /D$, where
 $D$ is a chemical diffusivity. For the Earth's outer core, studies suggest
 $Sc = O(100)$ for representative chemical species (e.g. Pozzo et al. Reference Pozzo, Davies, Gubbins and Alfé2013). This wide range of diffusivities that characterise geophysical and astrophysical fluids motivates the need for additional investigations that explore the influence of the Prandtl number on the dynamics, since all previous numerical calculations investigating the inverse cascade have focussed on fluids with
 $Pr=1$. QG simulations (Julien et al. Reference Julien, Rubio, Grooms and Knobloch2012b) have characterised the flow regimes that occur when
 $Pr \geqslant 1$. In general, it is found that low
 $Pr$ fluids reach turbulent regimes for a lower value of the thermal forcing (as measured by the Rayleigh number
 $Ra$) than higher
 $Pr$ fluids. More turbulent flows can be characterised by an increase in the Reynolds number
 \begin{equation} Re = U H /\nu, \end{equation}
which is a fundamental output parameter for convection studies. Many of the results found in QG studies have been confirmed by DNS calculations (Stellmach et al. Reference Stellmach, Lischper, Julien, Vasil, Cheng, Ribeiro, King and Aurnou2014). In both approaches, the formation of LSVs has been tied to the geostrophic turbulence regime, which, prior to the present work, has not been observed for  $Pr>3$.
Laboratory experiments are an important tool for exploring the dynamics of rapidly rotating convection (e.g. Vorobieff & Ecke Reference Vorobieff and Ecke2002; King et al. Reference King, Stellmach, Noir, Hansen and Aurnou2009; Kunnen, Geurts & Clercx Reference Kunnen, Geurts and Clercx2010; Ecke & Niemela Reference Ecke and Niemela2014; Stellmach et al. Reference Stellmach, Lischper, Julien, Vasil, Cheng, Ribeiro, King and Aurnou2014) and, much like natural systems, can access a wide range of  $Pr$ values. Liquid metals (
 $Pr\approx 0.025$) (Aurnou & Olson Reference Aurnou and Olson2001; Aubert et al. Reference Aubert, Brito, Nataf, Cardin and Masson2001; King & Aurnou Reference King and Aurnou2013; Zimmerman et al. Reference Zimmerman, Triana, Nataf and Lathrop2014; Adams et al. Reference Adams, Stone, Zimmerman and Lathrop2015; Aurnou et al. Reference Aurnou, Bertin, Grannan, Horn and Vogt2018; Vogt et al. Reference Vogt, Horn, Grannan and Aurnou2018), water (
 $Pr\approx 7$) (Sumita & Olson Reference Sumita and Olson2002; Vorobieff & Ecke Reference Vorobieff and Ecke2002; King et al. Reference King, Stellmach, Noir, Hansen and Aurnou2009; Cheng et al. Reference Cheng, Stellmach, Ribeiro, Grannan, King and Aurnou2015) and gases (
 $Pr\approx 1$) (Niemela, Babuin & Sreenivasan Reference Niemela, Babuin and Sreenivasan2010; Ecke & Niemela Reference Ecke and Niemela2014) have all been utilised. As for numerical calculations, fluids with smaller values of
 $Pr$ reach higher values of
 $Re$ than higher
 $Pr$ fluids for equivalent
 $Ra$. From this perspective, such fluids are of significant interest for exploring the geostrophic turbulence regime of rapidly rotating convection (e.g. Julien et al. Reference Julien, Knobloch, Rubio and Vasil2012a). However, the use of such low
 $Pr$ fluids is not always practical and can reduce or eliminate flow visualisation opportunities. Furthermore, whereas small
 $Pr$ fluids can lead to more turbulent flows, lower Ekman numbers must be used to provide a sufficiently large parameter regime over which the fluid remains rotationally constrained (e.g. King & Aurnou Reference King and Aurnou2013). It would therefore be of use to identify the general dynamical requirements for observing inverse-cascade-generated LSVs for a variety of fluid properties.
One of the basic goals in convection studies is to determine the functional dependence of  $Re$ on the input parameters, namely, determination of the functional form
 $Re = f(Ra, Pr)$. Power-law scalings of the form
 $Re = c_1 Ra^{c_2} Pr^{c_3}$ are often sought, where each
 $c_i$ is a constant. A well-known example is the so-called ‘free-fall’ scaling of the form
 $Re \sim (Ra/Pr)^{1/2}$ observed in non-rotating convection (e.g. Ahlers, Grossmann & Lohse Reference Ahlers, Grossmann and Lohse2009; Orvedahl et al. Reference Orvedahl, Calkins, Featherstone and Hindman2018). The free-fall scaling arises from a balance between nonlinear advection and the buoyancy force in the momentum equation, and represents a ‘diffusion-free’ scaling in the sense that the flow speeds are independent of both the thermal and viscous diffusion coefficients. Motivated by this free-fall form of the scaling, and the assumption that natural systems are expected to be highly turbulent in the sense that
 $Re \gg 1$, rotating convection studies have also sought to find diffusion-free scalings for the flow speeds. For instance, the recent work of Guervilly, Cardin & Schaeffer (Reference Guervilly, Cardin and Schaeffer2019) observed
 $Re \sim Ra Ek/Pr$ in spherical convection simulations, which is also a diffusion-free scaling for the flow speeds. In the present work we show that this scaling is equivalent to
 $\widetilde {Re} \sim \widetilde {Ra}/Pr$, where
 $\widetilde {Re} = Ek^{1/3} Re$ and
 $\widetilde {Ra}= Ek^{4/3} Ra$ are, respectively, a Reynolds number and a Rayleigh based on the small convective scale
 $\ell$. The
 $Re \sim Ra Ek/Pr$ scaling appears to be present for our larger
 $Pr$ cases over a finite range in
 $\widetilde {Ra}$; as
 $\widetilde {Ra}$ is increased a significant departure in this scaling is observed.
In the present work we investigate the properties of the inverse cascade for varying  $\widetilde {Ra}$ and
 $Pr$ in the rapidly rotating asymptotic (QG) limit for thermal convection in a plane-layer geometry (rotating Rayleigh–Bénard convection). This choice allows for comparison with previous results from QG (Sprague et al. Reference Sprague, Julien, Knobloch and Werne2006; Julien et al. Reference Julien, Rubio, Grooms and Knobloch2012b; Rubio et al. Reference Rubio, Julien, Knobloch and Weiss2014) and DNS (Guervilly et al. Reference Guervilly, Hughes and Jones2014; Stellmach et al. Reference Stellmach, Lischper, Julien, Vasil, Cheng, Ribeiro, King and Aurnou2014) plane-layer calculations. By exploring a parameter regime wider than previous studies we are able to characterise the formation of LSVs in greater detail. In particular, we derive a criterion, based on the ratio
 $\widetilde {Ra}/Pr$, that describes the transition to regimes where the barotropic energy is dominant over the wide range of Prandtl numbers considered here. Furthermore, we find evidence, for the first time to our knowledge, of very-high-
 $\widetilde {Re}$ regimes, previously unexplored, that show unexpected energetic and dynamic behaviours. The presence of these regimes prevents us from deriving scaling laws that are valid over the entire range of parameters considered here. The paper is organised as follows: in § 2 we describe the governing equations and diagnostic quantities; in § 3 the results of the simulations are presented and analysed; and a discussion is given in § 4.
2. Methodology
2.1. Governing equations
We consider rotating Rayleigh–Bénard convection in a plane-layer Cartesian geometry of depth  $H$, with constant gravity vector
 $\boldsymbol {g} = - g {\hat {\boldsymbol {z}}}$ pointing vertically downward, perpendicular to the planar boundaries. The fluid is Boussinesq with thermal expansion coefficient
 $\alpha$. The top boundary is held at constant temperature
 $T_1$ and the bottom boundary is held at constant temperature
 $T_2$ such that
 $\Delta T = T_2 - T_1 > 0$. The system rotates about the vertical with rotation vector
 $\boldsymbol {\varOmega } = \varOmega {\hat {\boldsymbol {z}}}$. In the limit of strong rotational constraint (i.e. small Rossby and Ekman numbers), the governing equations, can be reduced to the following set of equations (Julien et al. Reference Julien, Knobloch, Milliff and Werne2006; Sprague et al. Reference Sprague, Julien, Knobloch and Werne2006)
 \begin{gather} \partial_t \zeta + J[\psi,\zeta] - {\partial_Z} w = {\nabla_\perp^2} \zeta, \end{gather}
 \begin{gather}\partial_t w + J[\psi,w] + {\partial_Z} \psi = \frac{\widetilde{Ra}}{Pr} \vartheta + {\nabla_\perp^2} w, \end{gather}
 \begin{gather}\partial_t \vartheta + J[\psi,\vartheta] + w {\partial_Z} \bar{\varTheta} = \frac{1}{Pr} {\nabla_\perp^2} \vartheta , \end{gather}
 \begin{gather}{\partial_Z} (\overline{w\vartheta}) = \frac{1}{Pr} {\partial_Z^2} \bar{\varTheta},\end{gather}
where  $\zeta$ is the vertical component of the vorticity,
 $\psi$ is the dynamic pressure and also the geostrophic streamfunction and
 $w$ is the vertical component of the velocity. The vertical component of vorticity and the streamfunction are related via
 $\zeta = \nabla ^2_\perp \psi$, where
 $\nabla ^2_\perp = {\partial _x}^2 + {\partial _y}^2$. The non-dimensional temperature
 $\theta$ is decomposed into mean and fluctuating components
 $\bar {\varTheta }$ and
 $\vartheta$, respectively, such that
 $\theta = \bar {\varTheta } +Ek^{1/3} \vartheta$. Here the mean is defined as an average over the small spatial (
 $x,y,z$) and the fast temporal
 $(t)$ scales. The Jacobian operator
 $J[\psi ,f] = \partial _x\psi \partial _y f - \partial _y\psi \partial _x f = {\boldsymbol {u}}_\perp \boldsymbol {\cdot }\nabla _\perp f$ describes advection of the generic scalar field
 $f$ by the horizontal velocity field
 ${\boldsymbol {u}}_\perp = (u, v, 0) = ( -{\partial _y} \psi , {\partial _x} \psi , 0)$. The reduced Rayleigh number
 $\widetilde {Ra}$ is defined by
 \begin{equation} \widetilde{Ra} = Ek^{4/3} Ra, \end{equation}
where the standard Rayleigh number is
 \begin{equation} Ra = \frac{g \alpha \Delta T H^3}{\nu \kappa}. \end{equation}
Equations (2.1)–(2.4) have been non-dimensionalised by the small-scale viscous diffusion time  $\ell ^2/\nu$, where the small horizontal convective length scale is
 $\ell = H Ek^{1/3}$. The derivation of the reduced system relies on the assumption that the Coriolis force and pressure gradient force are balanced at leading order, i.e. geostrophic with
 ${\hat {\boldsymbol {z}}}\times {\boldsymbol {u}}=-\nabla _\perp \psi$. This force balance implies the Taylor–Proudman constraint is satisfied on small vertical scales such that
 $\partial _{z} ({\boldsymbol {u}},\psi )=0$ (e.g. Stewartson & Cheng Reference Stewartson and Cheng1979). Therefore, along the vertical direction all fluid variables vary on an
 $O(H)$ dimensional scale associated with the coordinate
 $Z = Ek^{1/3} z$. As a result, fast inertial waves with dimensional frequency
 $O(\varOmega )$ are filtered from the above equations, allowing for substantial computational savings. However, slow, geostrophically balanced inertial waves are retained (Julien et al. Reference Julien, Rubio, Grooms and Knobloch2012b).
The mean temperature  $\bar {\varTheta }$ evolves on the slow time scale
 $\tau = Ek^{2/3} t$ associated with the vertical diffusion time
 $H^2/\nu$. However, Julien, Knobloch & Werne (Reference Julien, Knobloch and Werne1998) and Plumley et al. (Reference Plumley, Calkins, Julien and Tobias2018) found that spatial averaging over a sufficient number of convective elements on the small scales is sufficiently accurate to (i) omit fast-time averaging and (ii) assume a statistically stationary state where the slow evolution term
 $\partial _\tau \bar {\varTheta }$ that would appear in (2.4) is omitted.
Finally, we note that three-dimensional incompressibility is invoked through the solenoidal condition for the ageostrophic, sub-dominant horizontal velocity,
 \begin{equation} \nabla_\perp \boldsymbol{\cdot}{\boldsymbol{u}}^{ag}_{\perp} + {\partial_Z} w =0, \end{equation}
where  ${\boldsymbol {u}}^{ag}_{\perp } = O( Ek^{1/3} {\boldsymbol {u}}_{\perp })$.
The equations are solved using impenetrable, stress-free mechanical boundary conditions, and constant temperature boundary conditions. However, it should be noted that the specific form of the thermal boundary conditions is unimportant in the limit of rapid rotation (Calkins et al. Reference Calkins, Hale, Julien, Nieves, Driggs and Marti2015), and the present model can be generalised to no-slip mechanical boundary conditions (Julien et al. Reference Julien, Aurnou, Calkins, Knobloch, Marti, Stellmach and Vasil2016). Each variable is represented with a spectral expansion consisting of Chebyshev polynomials in the vertical  $(Z)$ dimension, and Fourier series in the horizontal
 $(x, y)$ dimensions. The resulting set of equations are truncated and solved numerically with a pseudo-spectral algorithm that uses a third-order implicit/explicit Runge–Kutta time-stepping scheme (Spalart, Moser & Rogers Reference Spalart, Moser and Rogers1991). The code has been benchmarked successfully and used in many previous investigations (Marti, Calkins & Julien Reference Marti, Calkins and Julien2016; Maffei et al. Reference Maffei, Calkins, Julien and Marti2019; Yan et al. Reference Yan, Calkins, Maffei, Julien, Tobias and Marti2019).
Spatial and temporal resolutions of the simulations performed for this study are given in table 1. The horizontal dimensions of the domain are periodic and scaled by the critical horizontal wavelength  $\lambda _c = 2 {\rm \pi}/k_c \approx 4.8154$, measured in small-scale units
 $\ell$. Most of the simulations use horizontal dimensions of
 $10\lambda _c \times 10\lambda _c$, although some additional simulations with different domain sizes were also carried out to quantify the influence of the geometry. We find that a domain size of
 $10\lambda _c \times 10\lambda _c$ is sufficient for accurate computation of statistical quantities, though the role of LSVs appears to become increasingly important with increasing domain size; we discuss this effect in our results.
Details of the numerical simulations:  $Pr$ is the Prandtl number;
 $\widetilde {Ra}$ is the reduced Rayleigh number;
 $N_x$,
 $N_y$ and
 $N_Z$ are, respectively, the number of Fourier modes in the
 $x$ and
 $y$ directions and the number of Chebyshev modes in the
 $Z$ direction;
 $\Delta t$ is the time-step size used during the simulation;
 $\widetilde {Re} = \overline {\left \langle w_{rms}\right \rangle }$ is the time-averaged, reduced Reynolds number based on the vertical component of the velocity;
 $Nu$ is the time-averaged Nusselt number;
 $\sigma _{\widetilde {Re}}$ and
 $\sigma _{Nu}$ are the standard deviations of
 $\widetilde {Re}$ and
 $Nu$, respectively. The superscript
 $\dagger$ indicates that the horizontal box size for the simulation is taken to be
 $20 \lambda _c \times 20 \lambda _c$, where
 $\lambda _c = 2{\rm \pi} /k_c$ is the critical wavelength for the onset of thermal convection; for all other cases the box size is
 $10 \lambda _c \times 10 \lambda _c$. The superscript
 $*$ indicates cases for which the influence of the lack or presence of LSVs in the initial condition on the saturated state has been checked (see § 3.3 for details).

2.2. Depth-averaged dynamics and energetics
For the purpose of investigating the inverse energy cascade, we decompose the vertical vorticity into a depth-averaged (barotropic) component,  $\langle \zeta \rangle$, and a fluctuating (baroclinic) component,
 $\zeta '$, such that
 \begin{equation} \zeta = \langle \zeta \rangle + \zeta', \end{equation}
where, by definition,  $\langle \zeta ' \rangle =0$. The depth-averaged (barotropic) vorticity equation is then found by vertically averaging equation (2.1), and is given by
 \begin{equation} \partial_t \langle \zeta\rangle + J[\langle \psi \rangle, \langle \zeta\rangle ] = - \langle J[\psi', \zeta' ] \rangle + \nabla_\perp^2 \langle \zeta\rangle. \end{equation}
Thus, the barotropic dynamics are governed by a two-dimensional vorticity equation in which the sole forcing comes from the convective dynamics, represented by the first term on the right-hand side of the above equation.
The barotropic, time-dependent kinetic energy density is defined as follows:
 \begin{equation} K_{bt}(t) =\tfrac{1}{2} \left ( \overline{\langle u \rangle^2 +\langle v \rangle^2}^{\mathcal{V}} \right) =\tfrac{1}{2} \overline{ \vert \nabla_\perp \langle\psi\rangle \vert^2}^{\mathcal{V}}, \end{equation}
where  $\bar {\ \cdot \ } ^{\mathcal {V}}$ indicates an average over the small, horizontal spatial scales, consistent with the notation employed in Plumley et al. (Reference Plumley, Calkins, Julien and Tobias2018). In Fourier space, the barotropic kinetic energy equation is derived by multiplying the Fourier representation of (2.9) by the complex conjugate of
 $-\langle \psi \rangle _{\boldsymbol {k}} \exp {(\textrm {i} \boldsymbol {k} \boldsymbol {\cdot } \boldsymbol {x})}$, the spectral representation of
 $\langle \psi \rangle$, and integrating over physical space to obtain
 \begin{equation} {\partial_t}K_{bt}(k) = T_k + F_k + D_k, \end{equation}
where the box-normalised horizontal wavenumber vector is  $\boldsymbol {k} = (k_x, k_y, 0)$, and
 $k = |\boldsymbol {k}|$. This equation describes the evolution of the kinetic energy contained in the barotropic mode of wavenumber
 $k$ that is due to (i) the interaction with the other barotropic modes,
 \begin{equation} T_k = \sum_{|{\boldsymbol{k}}|=k}{Re}\{\left\langle\psi\right\rangle^*_{{\boldsymbol{k}}} \circ \mathcal{F}_{\boldsymbol{k}}[ J[\left\langle\psi\right\rangle,\left\langle\zeta\right\rangle] ]\}; \end{equation}
(ii) the interaction with the baroclinic, convective modes,
 \begin{equation} F_k =\sum_{|{\boldsymbol{k}}|=k}{Re}\{\left\langle\psi\right\rangle^*_{{\boldsymbol{k}}} \circ\mathcal{F}_{\boldsymbol{k}}[\langle J[\psi',\zeta']\rangle ] \}; \end{equation}
and (iii) the viscous dissipation of the barotropic mode,
 \begin{equation} D_k = \sum_{|{\boldsymbol{k}}|=k}{Re}\{|{\boldsymbol{k}}|^2 \left\langle \psi\right\rangle^*_{{\boldsymbol{k}}}\circ\left\langle\zeta\right\rangle_{{\boldsymbol{k}}}\}. \end{equation}
In the above definitions, the superscript  $*$ denotes a complex conjugate,
 $\mathcal {F}_{\boldsymbol {k}}[\cdot ]$ indicates the horizontal Fourier transform of the argument in square brackets, the symbol
 $\circ$ indicates a Hadamard (element-wise) product,
 ${Re}\{\cdot \}$ is the real part of the argument in curly brackets and the sum is taken over all horizontal wavenumbers. The barotropic-to-barotropic and baroclinic-to-barotropic transfer functions
 $T_k$ and
 $F_k$ can be explicitly expressed in terms of a triadic interaction due to the Jacobian (i.e. nonlinear) terms (Rubio et al. Reference Rubio, Julien, Knobloch and Weiss2014). The formation of LSVs is due to a positive contribution from
 $T_k$ and
 $F_k$ in (2.11) at the domain-scale wavenumber
 $k=1$. As LSVs form, the kinetic energy grows in time until dissipation balances the positive transfer at
 $k=1$. Eventually, a statistically stationary state is reached where
 $\bar {D}_k \approx - (\bar {T}_k + \bar {F}_k)$, where we notice that, for these quantities,
 $\bar {\ \cdot \ }$ is equivalent to an average over the fast temporal scale only; in contrast with previous work, all of the simulations presented here have reached this stationary state. Hereafter, in order to simplify notation we omit the averaging operator and refer only to the time-averaged values of
 $K_{bt}$,
 $T_k$,
 $F_k$ and
 $D_k$, unless otherwise stated.
2.3. Diagnostic quantities
Here, we define several diagnostic quantities that will be used to characterise the dynamical state of the convective system. The heat transfer across the fluid layer is quantified by the non-dimensional Nusselt number
 \begin{equation} Nu = 1 + Pr \overline{ \langle w\theta \rangle }. \end{equation}
In the present study the small-scale, or convective, Reynolds number is defined as characterising
 \begin{equation} \widetilde{Re} = \frac{\left\langle W_{rms}\right\rangle \ell}{\nu} = \left\langle w_{rms}\right\rangle, \end{equation}
where  $W_{rms} = (\bar {W}^2)^{1/2}$ and
 $w_{rms}= (\bar {W}^2)^{1/2}$ are the root-mean-square (r.m.s.) values of the dimensional and non-dimensional vertical velocity component, respectively. The above definition is particularly useful for characterising the amplitude of the convective motions, rather than the large-amplitude horizontal motions that occur in the presence of a strong inverse cascade. We also find it useful to refer to instantaneous values of the Nusselt and Reynolds number, and denote these by
 $Nu(t)$ and
 $\widetilde {Re}(t)$, respectively.
Together with the barotropic kinetic energy (2.10) we will also consider the time-averaged baroclinic, vertical and total kinetic energy densities, respectively defined as
 \begin{gather} K_{bc} =\tfrac{1}{2}\langle \overline{ (u')^2 + (v)'^2}\rangle =\tfrac{1}{2} \langle \overline{ \vert \nabla_\perp \psi' \vert^2}\rangle; \end{gather}
 \begin{gather}K_z = \tfrac{1}{2}\langle \bar{w}^2 \rangle, \end{gather}
 \begin{gather}K =\tfrac{1}{2} \langle \overline{u^2 + v^2 +w^2 }\rangle =\tfrac{1}{2} \langle \overline{ \vert \nabla_\perp \psi\vert^2} \rangle + K_z. \end{gather}
With the above definitions, the Reynolds number can be expressed as  $\widetilde {Re} = \sqrt {2 K_z}$. As for
 $Nu$ and
 $\widetilde {Re}$, we find it useful to refer to the instantaneous values of the total kinetic energy density as
 $K(t)$.
2.4. Domain of validity of the QG equations and comparison with DNS
The asymptotic equations (2.1)–(2.4) are valid for low Rossby number convection only; this constraint implies that  $\widetilde {Ra}\leqslant O(Ek^{-1/3})$ and
 $Pr\geqslant O(Ek^{1/4})$ (Julien et al. Reference Julien, Rubio, Grooms and Knobloch2012b). The violation of these conditions signifies the weakening of the dominant geostrophic balance and a loss of rotational constraint. As a relevant natural example, for the Earth's outer core these conditions are
 $\widetilde {Ra}\leqslant O(10^5)$ and
 $Pr\geqslant O(10^{-3.75})$. The former is most likely satisfied, although large uncertainties remain concerning the estimation of
 $\widetilde {Ra}$ for the core (see Cheng et al. (Reference Cheng, Stellmach, Ribeiro, Grannan, King and Aurnou2015) for a discussion); the latter is satisfied since
 $Pr=O(10^{-2})$ for liquid metals. For recent DNS, for which
 $Ek=O(10^{-7})$ (Stellmach et al. Reference Stellmach, Lischper, Julien, Vasil, Cheng, Ribeiro, King and Aurnou2014), the rapidly rotating regime is bounded by
 $\widetilde {Ra}\leqslant O(10^{2.5})$ and
 $Pr\geqslant O(10^{-1.75})$; although the latter is typically satisfied since
 $Pr=O(1)$ in numerical studies, the former is within reach in the present study. Note that the
 $\widetilde {Ra}\leqslant O(Ek^{-1/3})$ constraint does not limit the QG equation to low-
 $Ra$ regimes. However, it does limit the range of
 $Ra$ for which the QG approximation is valid given the
 $Ek$ of the unscaled convective system. The smaller the
 $Ek$ of the unscaled system, the larger the range of
 $Ra$ for which the convective flows can be considered rotationally constrained, and for which the reduced equations (2.1)–(2.4) can be used (King, Stellmach & Aurnou Reference King, Stellmach and Aurnou2012; Gastine, Wicht & Aubert Reference Gastine, Wicht and Aubert2016; Plumley & Julien Reference Plumley and Julien2019). As
 $\widetilde {Ra} \gtrsim O(Ek^{-1/3})$ the physical system under consideration should be studied with DNS, since the QG model only captures rotationally constrained dynamics.
The asymptotic model (2.1)–(2.4) has been tested against stress-free DNS calculations in rapidly rotating regimes satisfying the above bounds, with excellent agreement between the two approaches (Stellmach et al. Reference Stellmach, Lischper, Julien, Vasil, Cheng, Ribeiro, King and Aurnou2014). The effect of no-slip boundaries can be included in the asymptotic equations (2.1)–(2.4) by parametrising the effect of the Ekman layers on the interior flow (Julien et al. Reference Julien, Aurnou, Calkins, Knobloch, Marti, Stellmach and Vasil2016). Results from the asymptotic equations can then be compared with no-slip DNS and laboratory experiments, again with excellent agreement (Plumley et al. Reference Plumley, Julien, Marti and Stellmach2016). In particular, heat transport data ( $Nu$) were successfully compared with DNS with
 $Ek = 10^{-7}$ and
 $1\leqslant Pr \leqslant 7$ (Stellmach et al. Reference Stellmach, Lischper, Julien, Vasil, Cheng, Ribeiro, King and Aurnou2014; Plumley et al. Reference Plumley, Julien, Marti and Stellmach2016), and with laboratory experiments with water (Cheng et al. Reference Cheng, Stellmach, Ribeiro, Grannan, King and Aurnou2015), for
 $2\times 10^{-8} \lesssim Ek \lesssim 3\times 10^{-6}$ (Plumley et al. Reference Plumley, Julien, Marti and Stellmach2016). Furthermore, the same morphological differences in the flow regimes obtained with increasing
 $\widetilde {Ra}$ (see Sprague et al. (Reference Sprague, Julien, Knobloch and Werne2006), Julien et al. (Reference Julien, Rubio, Grooms and Knobloch2012b), Cheng et al. (Reference Cheng, Stellmach, Ribeiro, Grannan, King and Aurnou2015) and § 3) were found in both numerical (DNS and asymptotic) and laboratory experiments. Of particular interest to the present study, LSV formation has been observed in both DNS and asymptotic calculations for
 $Pr=1$ (Sprague et al. Reference Sprague, Julien, Knobloch and Werne2006; Julien et al. Reference Julien, Rubio, Grooms and Knobloch2012b; Favier et al. Reference Favier, Silvers and Proctor2014; Guervilly et al. Reference Guervilly, Hughes and Jones2014; Rubio et al. Reference Rubio, Julien, Knobloch and Weiss2014; Stellmach et al. Reference Stellmach, Lischper, Julien, Vasil, Cheng, Ribeiro, King and Aurnou2014), for
 $\widetilde {Ra}\gtrsim 3 \widetilde {Ra}_c$, where
 $\widetilde {Ra}_c$ is the critical value for the onset of thermal convection. However, as mentioned in § 1, the LSVs in DNS are predominantly cyclonic due to a local reduction of the rotational constraint in the anticyclonic component (Guervilly et al. Reference Guervilly, Hughes and Jones2014). On the contrary, the LSVs in QG calculations are always dipolar in structure due to the limit of asymptotically small of
 $Ro$. This is guaranteed by a known reflection symmetry in this limit (Hakim, Snyder & Muraki Reference Hakim, Snyder and Muraki2002; Sprague et al. Reference Sprague, Julien, Knobloch and Werne2006). Furthermore, as the thermal driving is increased and the condition
 $\widetilde {Ra}\leqslant O(Ek^{-1/3})$ is violated, the system transitions towards three-dimensional, isotropic turbulence and LSV formation is gradually lost in DNS (Guervilly et al. Reference Guervilly, Hughes and Jones2014). This transition also makes subcritical sustenance of the LSVs possible (Favier et al. Reference Favier, Guervilly and Knobloch2019): an artificially injected, highly energetic, cyclonic LSV is stable in the transition regimes for which domain-scale, barotropic vortices would not spontaneously form. This rich phenomenology is characteristic of regimes for which
 $\widetilde {Ra}\gtrsim O(Ek^{-1/3})$ in which
 $Ro = O(1)$ and so it is not observed in QG simulations, for which
 $Ro$ and
 $Ek$ are asymptotically small and the leading-order geostrophic balance is explicitly enforced. Therefore, no LSV subcritical behaviour is observed in asymptotic calculations (see § 3.3), and no upper limit to
 $\widetilde {Ra}$ for LSV formation can be achieved as a consequence of the loss of rotational constraint.
3. Results
3.1. Flow morphology: two-scale flows
The details of the simulations performed for this study are given in table 1. The choice of parameters allows us to refine the results of previous QG calculations (Julien et al. Reference Julien, Rubio, Grooms and Knobloch2012b) in the range  $1\leqslant Pr \leqslant 3$ and for
 $Pr=7$, of particular relevance for laboratory experiments. The temporally averaged values of
 $\widetilde {Re}$ and
 $Nu$ displayed in table 1 are calculated over a temporal window in which the system reached a statistically stationary state. If LSVs are present in the domain,
 $\widetilde {Re}$ and
 $Nu$ might reach stationary values only when the barotropic kinetic energy has saturated, in accordance with previous studies (Julien et al. Reference Julien, Rubio, Grooms and Knobloch2012b; Favier et al. Reference Favier, Silvers and Proctor2014; Guervilly et al. Reference Guervilly, Hughes and Jones2014; Rubio et al. Reference Rubio, Julien, Knobloch and Weiss2014) where
 $Nu$ has been shown to evolve over the time needed for the total kinetic energy to saturate. The interested reader is directed to supplementary figure 1 available at https://doi.org/10.1017/jfm.2020.1058 for an example of this behaviour. Figures 1(a) and 1(c) shows
 $\widetilde {Re}$ and
 $Nu$ as functions of
 $\widetilde {Ra}$ and
 $Pr$. The continuous lines in figure 1(a) indicate the least-square fit to a power law of the kind
 $\widetilde {Re} = \alpha _r (\widetilde {Ra} - \widetilde {Ra}_c)^{\beta _r} Pr^{\gamma _r}$ with
 $\alpha _r = 0.1883$,
 $\beta _r = 1.1512$ and
 $\gamma _r =$-
 $1.2172$. In figure 1(b) we illustrate the collapse of the
 $\widetilde {Re}$ data points to the law
 $\widetilde {Re}\sim (\widetilde {Ra}-\widetilde {Ra}_c) Pr^{-1}$, empirically found and consistent with the coefficients
 $\beta _r$ and
 $\gamma _r$. Figure 1(b) suggests that the reduced Grashof number,
 $\widetilde {Ra} Pr^{-1}$ plays a key role in controlling the dynamics. Figure 1(d) shows the collapse of the
 $Nu$ data points to a power law of the kind
 ${Nu\sim (\widetilde {Ra}-\widetilde {Ra}_c)^{3/2} Pr^{-1/2}}$, distinctive of the ultimate regime of thermal convection. Inspection of figures 1(c) and 1(d) reveals the complex nature of the scaling behaviour of
 $Nu$ with respect to the input parameters, in agreement with previous studies (Julien et al. Reference Julien, Rubio, Grooms and Knobloch2012b). In particular we note that the
 $Pr$-dependence does not trivially separate the original data when displayed as a function of
 $\widetilde {Ra}$ (as opposed as to the
 $\widetilde {Re}$ data in figure 1a). Further details concerning power-law fits are given in § 3.5.
(a,b) Temporally averaged Reynolds number  $\widetilde {Re}$ and (c,d) Nusselt number
 $Nu$ for all of the simulations: (a)
 $\widetilde {Re}$ versus the reduced Rayleigh number
 $\widetilde {Ra}$; (b)
 $\widetilde {Re}$ versus the rescaled quantity
 $(\widetilde {Ra}-\widetilde {Ra}_c)/Pr$; (c)
 $Nu$ versus
 $\widetilde {Ra}$; (d)
 $Nu$ versus the rescaled coordinate
 $(\widetilde {Ra}-\widetilde {Ra}_c)^{3/2} Pr^{-1/2}$. Continuous lines in (a) show the best-fit, three parameter power-law scaling
 $\widetilde {Re} = \alpha _r (\widetilde {Ra}-\widetilde {Ra}_c)^{\beta _r} Pr^{\gamma _r}$, where
 $\alpha _r = 0.1883$,
 $\beta _r = 1.1512$ and
 $\gamma _r =$-
 $1.2172$ (see § 3.5). Data for
 $Pr = 10$ in (a,b) are from Calkins et al. (Reference Calkins, Julien, Tobias, Aurnou and Marti2016). The dashed horizontal lines in (a,b) show the Reynolds number at which the box-scale depth-averaged kinetic energy becomes dominant (see § 3.2).

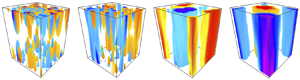
Following Julien et al. (Reference Julien, Rubio, Grooms and Knobloch2012b), inspection of volumetric renderings of the fluctuating temperature (figure 2) suggests that we can qualitatively classify the flows into: the cellular regime ( $C$); the convective Taylor column regime (CTC); the plume regime (
 $P$); and the geostrophic turbulence regime (
 $G$). Regime
 $C$ is only obtained close to the onset of thermal convection, i.e. for Rayleigh numbers not much larger than the critical value of
 $\widetilde {Ra}_c \simeq 8.7$; the CTC regime is characterised by columns that stretch across the fluid layer, surrounded by ‘sleeves’ of oppositely signed vorticity (also visible in the fluctuating temperature) that prevent columns from interacting with each other; in the
 $P$ regime the insulation mechanism weakens and column–column interaction shortens these structures, transforming them into plumes; finally, geostrophic turbulence prevails at sufficiently large Rayleigh numbers where no obvious coherence in the fluctuating temperature field is observed. Although distinct transitions in the flow statistics can sometimes be used to separate these flow regimes (Nieves, Rubio & Julien Reference Nieves, Rubio and Julien2014), an obvious distinction cannot always be made, e.g. cases
 $(\widetilde {Ra}=40, Pr=2)$ and (
 $\widetilde {Ra} = 60, Pr=3$) shown in figure 2, where plumes generated at each horizontal boundary seem to coexist with columns spanning the whole vertical extension of the computational domain.
Volumetric renderings of fluctuating temperature,  $\vartheta$, showing the different convective regimes for increasing Rayleigh number (left to right) and increasing Prandtl number (top to bottom). The abbreviations correspond to: convective Taylor column (CTC); plume (
 $P$); geostrophic turbulence (
 $G$). See online supplementary material for movies illustrating the temporal evolution of the fluctuating temperature for selected values of
 $\widetilde {Ra}$ and
 $Pr$: (a)
 $\widetilde {Ra} = 40, Pr = 2$ (CTC/
 $P$); (b)
 $\widetilde {Ra} = 60, Pr = 2$ (
 $P$); (c)
 $\widetilde {Ra} = 200, Pr = 2$ (
 $G$); (d)
 $\widetilde {Ra} = 60, Pr = 3$ (CTC/
 $P$); (e)
 $\widetilde {Ra} = 80, Pr = 3$ (
 $P$); (f)
 $\widetilde {Ra} = 120, Pr = 3$ (
 $P$); (g)
 $\widetilde {Ra} = 80, Pr = 7$ (CTC); (h)
 $\widetilde {Ra} = 135, Pr = 7$ (
 $P$); (i)
 $\widetilde {Ra} = 160, Pr = 7$ (
 $P$).

For a given value of  $Pr$, we observe the formation of LSVs as
 $\widetilde {Ra}$ is increased. These dipolar LSVs are readily identified from visual inspection of the geostrophic streamfunction
 $\psi$. Some representative cases are shown in figure 3. Crucially, we observe LSV formation for all
 $Pr$ values reported in table 1, including, for the first time to our knowledge,
 $Pr>3$. We find that for the LSVs to be present in the domain, convection does not need to be in the geostrophic turbulent regime, as was previously suggested (Julien et al. Reference Julien, Rubio, Grooms and Knobloch2012b; Stellmach et al. Reference Stellmach, Lischper, Julien, Vasil, Cheng, Ribeiro, King and Aurnou2014).
Volumetric renderings of the geostrophic streamfunction (pressure),  $\psi$, showing the development of large-scale vortices (LSVs) for increasing Rayleigh number (left to right) and increasing Prandtl number (top to bottom): (a)
 $\widetilde {Ra} = 40, Pr = 2$; (b)
 $\widetilde {Ra} = 60, Pr = 2$; (c)
 $\widetilde {Ra} = 200, Pr = 2$; (d)
 $\widetilde {Ra} = 60, Pr = 3$; (e)
 $\widetilde {Ra} = 80, Pr = 3$; (f)
 $\widetilde {Ra} = 120, Pr = 3$; (g)
 $\widetilde {Ra} = 80, Pr = 7$; (h)
 $\widetilde {Ra} = 135, Pr = 7$; (i)
 $\widetilde {Ra} = 160, Pr = 7$.

3.2. LSV characterisation
To quantify the presence of LSVs in the domain we analysed the time-averaged barotropic kinetic energy spectra  $K_{bt}(k)$. We define flows in which LSVs are energetically dominant by the two conditions:
 $K_{bt}> K_{bc}$; and
 $K_{bt}(k=1) \geqslant K_{bt}(k>1)$. As examples, figure 4(a,b) shows the barotropic kinetic energy spectra for
 $Pr=1$ and
 $Pr=2$ over a range in
 $\widetilde {Ra}$. The transition to LSV-dominant states occurs within the ranges
 $20<\widetilde {Ra}<30$ and
 $40<\widetilde {Ra}<45$ for the
 $Pr=1$ and the
 $Pr=2$ cases, respectively. As
 $\widetilde {Ra}$ is further increased beyond the transition, LSVs becomes increasingly dominant, as shown by progressively larger values of
 $K_{bt}$(k) for
 $k < 3$. Note that for the
 $(\widetilde {Ra}=20, Pr=1)$ case, the barotropic spectra has a maximum at
 $k=1$. However, for this case, the barotropic kinetic energy is not dominant, rather, we find that
 $K_{bc}\simeq 3 K_{bt}$ for this case. Therefore, there are no energetically dominant LSVs in the domain for this particular case.
(a,b) Spectra of the barotropic kinetic energy  $K_{bt}(k)$ for select values of
 $\widetilde {Ra}$ and for
 $Pr=1$ and
 $Pr=2$. The scalings
 $K_{bt}(k)\sim k^{-3}$ and
 $K_{bt}(k)\sim k^{-4}$ are shown for comparison. (c,d) Compensated spectra
 $k^4 K_{bt}(k)$ for the same cases shown in (a,b). (e) Barotropic transfer
 $T_k+F_k$ for the
 $Pr=2$ cases; (f) barotropic-to-barotropic (
 $T_k$) and baroclinic-to-barotropic (
 $F_k$) for the
 $Pr=2$ case separately illustrated in continuous and dashed lines, respectively. Colour legend for (e,f) is the same as in (b,d). A black vertical line is drawn in correspondence of
 $T_k, F_k=0$. The insets highlight the behaviour for
 $\widetilde {Ra}\leqslant 50$. All quantities have been time averaged over a statistically stationary state for which
 $T_k + F_k \approx -D_k$.

Figure 4(a,b) suggests that the spectral slope at low wavenumbers saturates at the behaviour  $K_{bt}(k)\sim k^{-4}$ for fully developed LSVs. This suggestion can be corroborated by inspection of the compensated spectra
 $k^4 K_{bt}(k)$, shown in figure 4(c,d). Note that, while the
 $Pr=2$ cases do suggest a saturation of the low-
 $k$ spectral slope to a
 $K_{bt}(k)\sim k^{-4}$ law, the
 $Pr=1$ show a steeper slope (specifically between
 $k^{-4.2}$ and
 $k^{-4.3}$) for
 $\widetilde {Ra}=200$. Whether this is a sign that the saturation slope is
 $Pr$-dependent or that the
 $Pr=1$ cases have not yet reached the saturation regime, lies beyond the scope of the present work. The scaling
 $K_{bt}(k)\sim k^{-3}$, associated with the presence of LSVs in rapidly rotating thermal convection studies (Julien et al. Reference Julien, Rubio, Grooms and Knobloch2012b; Rubio et al. Reference Rubio, Julien, Knobloch and Weiss2014), two-dimensional (Smith & Yakhot Reference Smith and Yakhot1993, Reference Smith and Yakhot1994; Borue Reference Borue1994; Chertkov et al. Reference Chertkov, Connaughton, Kolokolov and Lebedev2007) and rotating three-dimensional (Smith & Waleffe Reference Smith and Waleffe1999) turbulence studies, is shown for comparison. Some low-
 $Ro$ calculations in triply periodic domains with a barotropic driving force (Seshasayanan & Alexakis Reference Seshasayanan and Alexakis2018) also suggest a low-
 $k$ spectral slope steeper than
 $k^{-3}$. However, given the different nature of the driving force and boundary conditions it is not straightforward to relate this previous work with the present results. Indeed, it has been shown in triply periodic simulations of synthetically forced, rotating turbulence, that the details of the imposed forcing (e.g. spatial scales, isotropy, net helicity) has profound consequences on the development of the inverse energy cascade and on the low-
 $k$ slope of the saturated energy spectra (Sen et al. Reference Sen, Mininni, Rosenberg and Pouquet2012; Pouquet et al. Reference Pouquet, Sen, Rosenberg, Mininni and Baerenzung2013).
The phenomenology described above for  $Pr=1$ and
 $Pr=2$ is observed for all
 $Pr$ considered in the present study, although the threshold Rayleigh number for LSV-dominant state increases with
 $Pr$. However, we observe that the LSVs become energetically dominant provided
 $\widetilde {Re}\gtrsim 6$, independent of
 $Pr$. The lowest value for which LSV formation has been observed is
 $\widetilde {Re}=5.812$ for the
 $(\widetilde {Ra}=45, Pr=2)$ case. We indicate this value by the horizontal dashed line in figures 1(a) and 1(b). The only exception is the
 $(\widetilde {Ra}=55, Pr=2.5)$ case for which no energetically dominant LSVs are observed, although
 $\widetilde {Re} = 6.067 \pm 0.134$. This discrepancy can be explained by noting that these two values of
 $\widetilde {Re}$ are (considering their temporal fluctuations) consistent with each other and by admitting that the transition to LSV-dominated regime is not abrupt. A more detailed exploration of the parameter space around the transition could reveal other exceptions to the threshold we identified and possibly a subtle
 $Pr$ dependence.
In addition to the transition shown in the barotropic kinetic energy spectra, we also find (with increasing  $\widetilde {Ra}$) a distinct transition in the character of the three terms present in the spectral kinetic energy equation (2.11). In figure 4(e,f) we illustrate how the time-averaged, barotropic energy transfer
 $T_k+F_k$ evolves with
 $\widetilde {Ra}$ for the specific case of
 $Pr=2$. We note that
 $[T_k+F_k]_{k=1} > 0$ for all of the cases investigated, indicating that energy is always being transferred to the
 $k=1$ mode, regardless of the value of
 $\widetilde {Ra}$. However, we find that
 $T_k+F_k$ changes from possessing a peak at
 $k > 1$, to then peaking at
 $k=1$ for a sufficiently large value of
 $\widetilde {Ra}$; for the
 $Pr=2$ data shown this transition occurs when
 $\widetilde {Ra}>50$. Analysing all of our simulations shows that this transition occurs when
 $\widetilde {Re}\geqslant 6.491$, for any value of
 $Pr$. This threshold value corresponds to the simulation
 $(\widetilde {Ra}=135, Pr=7)$ and it is noted that no simulation with
 $\widetilde {Re} < 6.491$ satisfies
 $[T_k+F_k]_{k=1} > [T_k+F_k]_{k>1}$. The only exception is the case
 $(\widetilde {Ra}=40, Pr=1.5)$, for which
 $\widetilde {Re} = 6.7529 \pm 0.227$ and the energy transfer at
 $k=1$ is subdominant. Again, given the finite fluctuations in the
 $\widetilde {Re}$ values, we argue that a transition region may exist for which a simple threshold rule may not always work; a more detailed exploration of the parameter space may reveal subtle
 $Pr$ dependencies in the transition into the regime for which the barotropic energy transfer at
 $k=1$ is dominant.
Closer inspection of  $F_k$ and
 $T_k$ separately (figure 4f) indicates that the baroclinic, convective dynamics primarily transfers energy to the barotropic dynamics around
 $k\simeq 5$ (notice the positive peak in
 $F_k$ for
 $k\simeq 5$). Energy transferred to the barotropic dynamics is then transferred upscale by the barotropic nonlinear interactions, as indicated by negative values of
 $T_k$ for wavenumbers
 $k > 4$, and positive values at the largest scales. The inverse cascade that leads to LSV formation is therefore directly driven by the barotropic nonlinear interactions in (2.9), whereas the energy is provided by the interaction of the baroclinic dynamics with the barotropic flows. The fact that
 $\sum _{k\geqslant 0}T_k = 0$ confirms that the nonlinear barotropic interactions do not inject or extract barotropic energy and that the saturation of
 $K_{bt}$ is controlled by the balance between energy injected from the baroclinic dynamics and energy dissipated through viscosity
 \begin{equation} 0 \approx \sum_{k\geqslant 0 } F_k + \sum_{k\geqslant 0 } D_k. \end{equation}
This mechanism is in agreement with the formation of large-scale condensates in two-dimensional (2-D) calculations (Borue Reference Borue1994; Smith & Yakhot Reference Smith and Yakhot1994; Chertkov et al. Reference Chertkov, Connaughton, Kolokolov and Lebedev2007; Laurie et al. Reference Laurie, Boffetta, Falkovich, Kolokolov and Lebedev2014) where the transfer of energy is due to the nonlinear interactions between different scales of the 2-D flow (equivalent to the barotropic-to-barotropic energy transfer described by  $T_k$). This view is also confirmed by recent 3-D studies (Buzzicotti et al. Reference Buzzicotti, Aluie, Biferale and Linkmann2018).
As mentioned in § 2.2, in the saturated state  $D_k \approx - (T_k + F_k)$. Examples are shown in figure 5 for
 $\widetilde {Ra}=60$ and
 $Pr=7$,
 $Pr=2.5$ and
 $Pr=1$. These cases are representative of, respectively, a low-turbulence case at the edge of the CTC and
 $P$ regimes where
 $\widetilde {Re}\ll 6$ and, consequently, an inverse cascade that is not strong enough to drive LSV formation; a case in the
 $P$ regime with
 $\widetilde {Re}\gtrsim 6$, slightly above the critical value for LSV formation and an inverse cascade; and a case in the
 $G$ regime, with a robust inverse cascade possessing a strong peak at
 $k=1$ driving energetically dominant LSVs. This figure illustrate how the pattern observed in figure 4(e,f) for fixed
 $Pr$ and increasing
 $\widetilde {Ra}$ can be discerned for fixed
 $\widetilde {Ra}$ and decreasing
 $Pr$.
Time-averaged, barotropic transfer functions showing the change in energy transfer behaviour as the inverse cascade becomes more prominent. All cases use  $\widetilde {Ra} = 60$ and Prandtl numbers (a)
 $Pr=7$ (
 $\widetilde {Re} \approx 2.5$), (b)
 $Pr=2.5$ (
 $\widetilde {Re} \approx 6.8$) and (c)
 $Pr=1$ (
 $\widetilde {Re} \approx 16.8$). These three cases are representative of, respectively, the CTC/
 $P$ regime, showing no LSVs in the domain and
 $\widetilde {Re}\ll 6$; the
 $P$ regime, showing LSVs in the domain and
 $\widetilde {Re}\gtrsim 6$; the
 $G$ regime, with robust LSVs and
 $\widetilde {Re}\gg 6$.

Following Guervilly et al. (Reference Guervilly, Hughes and Jones2014), we can characterise the kinetic energy of the barotropic flow using the ratio of total kinetic energy to vertical kinetic energy,
 \begin{equation} \varGamma = K / (3 K_z). \end{equation}
The factor of 3 in the denominator ensures that  $\varGamma \rightarrow 1$ if the kinetic energy is equipartitioned between the horizontal and vertical components of the velocity. Conversely, when the barotropic kinetic energy dominates, we expect this ratio to become significantly larger than unity. Figures 6(a) and 6(b) show
 $\varGamma$ for all of the simulations as a function of
 $\widetilde {Ra}$ and
 $\widetilde {Re}$, respectively. In agreement with the DNS calculations of Guervilly et al. (Reference Guervilly, Hughes and Jones2014),
 $\varGamma \approx 1$ for small values of
 $\widetilde {Ra}$, then increases rapidly once LSVs begin to form. We find that
 $\varGamma$ reaches a maximum of
 $\varGamma _{max} \approx 5.5$, that appears to be independent of the particular value of
 $Pr$, though only the
 $Pr=1$ and
 $Pr=1.5$ simulations show a maximum value. For
 $Pr=1$,
 $\varGamma$ reaches a maximum value at
 $\widetilde {Ra} = 80$, whereas for
 $Pr=1.5$,
 $\varGamma _{max}$ occurs at
 $\widetilde {Ra}=120$, suggesting that the value of
 $\widetilde {Ra}$ at which
 $\varGamma _{max}$ is observed increases rapidly with Prandtl number.
Scaling behaviour of the kinetic energy for all of the simulations. (a) Ratio of the total kinetic energy to the vertical kinetic energy ( $\varGamma$) versus
 $\widetilde {Ra}$; (b)
 $\varGamma$ versus
 $\widetilde {Re}$; (c) barotropic kinetic energy
 $K_{bt}$ versus
 $\widetilde {Ra}$; (d)
 $K_{bt}$ versus
 $\widetilde {Re}$. The vertical dashed line at
 $\widetilde {Re} =5.812$ in (b,d) demarcates the onset of LSV-dominant behaviour. Slopes in (b,d) are shown for reference.

Since the value of  $\widetilde {Ra}$ at which LSVs begin to form is
 $Pr$-dependent,
 $\varGamma$ is also plotted as a function of
 $\widetilde {Re}$ in figure 6(b). The data suggest that the evolution of
 $\varGamma$ is uniquely determined by
 $\widetilde {Re}$ (or
 $(\widetilde {Ra}-\widetilde {Ra}_c) Pr^{-1}$ according to figure 1b) since all curves show self-similar behaviour, independent of the particular value of
 $Pr$. The dashed vertical line indicates
 $\widetilde {Re} = 5.812$, the lowest value at which the (
 $k=1$) LSVs have been observed to become dominant. For cases in which
 $\widetilde {Re}$ is below this threshold value,
 $\varGamma$ is close to 1 for all values of
 $Pr$, and the convective pattern, or flow regime, for all of these cases can be qualitatively classified as cellular or convective Taylor columns. Above this threshold value of the Reynolds number, we find both plumes and eventually geostrophic turbulence as
 $\widetilde {Re}$ grows. For both the
 $Pr=1$ and
 $Pr=1.5$ cases,
 $\varGamma _{max}$ is reached for
 $\widetilde {Re}\simeq 24$.
We emphasise that since all of the calculations in the present work were carried out with the QG model, the observed decrease of  $\varGamma$ for large values
 $\widetilde {Ra}$ is not due to a loss of rotational constraint. Although the DNS study of Guervilly et al. (Reference Guervilly, Hughes and Jones2014) also report a decrease in
 $\varGamma$ for sufficiently large forcing, their observed decrease might be caused by an increase in the Rossby number with increasing forcing. In the present study,
 $Ro$ remains asymptotically small, regardless of the thermal forcing. Also, as pointed out previously, the LSVs observed in Guervilly et al. (Reference Guervilly, Hughes and Jones2014) are predominantly cyclonic, whereas the LSVs observed in the present simulations are dipolar.
Figures 6(c) and 6(d) show the barotropic kinetic energy versus  $\widetilde {Ra}$ and
 $\widetilde {Re}$, respectively. In figure 6(d), slopes of
 $\widetilde {Re}^{7/2}$ and
 $\widetilde {Re}^{3/2}$ (found empirically) are shown as reference, along with the vertical dashed line denoting the threshold Reynolds number
 $\widetilde {Re}=5.812$. The ‘s-shaped’ behaviour of the data, along with
 $\varGamma$, suggests that the barotropic mode is growing at an ever-decreasing rate as
 $\widetilde {Ra}$ is increased. Taking the barotropic kinetic energy
 $K_{bt}$ scaling with
 $\widetilde {Re}$ as illustrated in figure 6(d) and with
 $K_{bc}\sim \widetilde {Re}^2$ (found empirically and consistent with the expectation
 $K_{bc}\sim K_z\sim \widetilde {Re}^2$; see supplementary figure 2), we can derive the expected evolution of
 $\varGamma$ in the growing (
 $6\lesssim \widetilde {Re}\lesssim 24$) and decaying (
 $\widetilde {Re}>24$) regimes. In the former, under the assumption that
 $K_{bt}\gg K_{bc}, K_z$, we obtain
 $\varGamma \sim \widetilde {Re}^{3/2}$; in the latter, taking
 $\widetilde {Re}\to \infty$, we obtain
 $\varGamma \sim \widetilde {Re}^{-1/2}$. These slopes are illustrated in figure 6(b), for reference.
To better understand the change in scaling behaviour of the barotropic kinetic energy with increasing Rayleigh number, we examine the nonlinear convective forcing term in the barotropic vorticity equation (2.9). In particular, the nonlinear baroclinic term can be written as
 \begin{equation} \langle J[\psi', \zeta' ] \rangle = \nabla_\perp \boldsymbol{\cdot} \langle {\boldsymbol{u}}' \zeta' \rangle, \end{equation}
which suggests that the decreased efficiency of the barotropic mode is due to a drop in correlations between the baroclinic velocity and baroclinic vorticity. We calculated the cross-correlation coefficient for the  $x$-component of the baroclinic velocity vector and baroclinic vorticity, defined as
 \begin{equation} C(u',\zeta') = \frac{\overline{\langle \left ( \zeta' u' \right )^2 \rangle}}{\sqrt{\overline{\langle \left ( \zeta' \zeta' \right )^2 \rangle} \overline{\langle \left ( u' u' \right )^2 \rangle}}}, \end{equation}
and analogously for the cross-correlation for the  $y$-component of the baroclinic velocity field and the baroclinic vorticity,
 $C(v',\zeta ')$. We note that this definition leads to
 $C=0.$5 for perfect correlation between one component of the baroclinic velocity vector and the baroclinic vorticity, since the statistics are isotropic in the horizontal plane when sufficiently time averaged. The coefficients were computed over the entire investigated range of
 $\widetilde {Ra}$ for the case
 $Pr=1$. Figure 7 shows the average value
 \begin{equation} C({\boldsymbol{u}}',\zeta') = \frac{C(u',\zeta') + C(v',\zeta')}{2}. \end{equation}
The vertical dashed lines in the figure indicate the  $\widetilde {Ra}$ values that correspond to the transition to LSV-forming regimes and to the maximum value of
 $\varGamma$. We observe that
 $C({\boldsymbol {u}}',\zeta ')$ decays as
 $\widetilde {Ra}$ is increased from
 $\widetilde {Ra}>20$, suggesting one possible reason for the reduced rate of growth of the barotropic kinetic energy with increasing Rayleigh number. We also observe a change in slope as
 $\widetilde {Ra}>80$ (the value for which
 $\varGamma$ reaches the maximum value for
 $Pr=1$), suggesting a complex interaction between the barotropic and baroclinic flows.
Correlation coefficient between the baroclinic vorticity and the horizontal components of the baroclinic velocity as a function of the Rayleigh number  $\widetilde {Ra}$. The Prandtl number is fixed at
 $Pr=1$. A value of
 $C = 0.5$ is perfect correlation for one component of the velocity vector. The vertical lines annotated with
 $\widetilde {Re}=6$ and
 $\widetilde {Re} = 24$ indicate the approximate
 $\widetilde {Ra}$ values at which the flow becomes LSV dominant and convection dominant, respectively (see figure 6a).

3.3. The influence of initial conditions
For the cases indicated by the superscript  $*$ in table 1, additional simulations were carried out to test the influence of initial conditions on the occurrence of LSVs. In particular, for cases capable of forming LSVs (
 $\widetilde {Re}>6$), we checked that the kinetic energy of the saturated state is independent of the presence of LSVs in the initial condition. Our results indicate that both baroclinic (or convective) amplitude (measured by
 $\widetilde {Re}$) and the barotropic kinetic energy in the saturated state do not depend on the initial condition, but only depend on
 $Pr$ and
 $\widetilde {Ra}$. As an example, in figure 8 we show this by illustrating the time evolution of the kinetic energy per unit volume,
 $K(t)$, and the vertical Reynolds number,
 $\widetilde {Re}(t)$, for the case
 $(\widetilde {Ra}=50, Pr=1.5)$. Two simulations were run for this case: one started from a random initial condition that does not contain pre-existing LSVs (labelled as ‘random IC’ in figure 8), and one started from an initial condition with LSVs already present in the domain, given from the saturated state of the
 $(\widetilde {Ra}=40, Pr=1)$ case (labelled as ‘LSVs IC’). In the former case, the initial growth of kinetic energy is due to the formation of the LSVs caused by the imbalance
 $T_k + F_k>|D_k|$ for
 $k=1$. In the latter case, the LSVs initially present in the system were formed at a higher
 $\widetilde {Re}$ and due to a stronger inverse cascade than the one developed for
 $(\widetilde {Ra}=50, Pr=1.5)$. Therefore, initially the imbalance
 $T_k+F_k<|D_k|$ leads to a kinetic energy decay as the LSVs cannot be energetically sustained. For both cases, a new state is eventually reached for which, statistically speaking
 $|D_k|=T_k + F_k$.
Influence of initial conditions on LSV formation. Kinetic energy (a) and reduced vertical Reynolds number (b) for the parameters  $Pr=1.5$ and
 $\widetilde {Ra}=50$ from two different initial conditions: the case marked as ‘random IC’ has a random initial condition with no initial LSVs present; ‘LSVs IC’ marks an initial condition with well-developed LSVs in the system.

Similarly, we also found that for cases in which  $\widetilde {Re}\lesssim 6$, LSVs would eventually decay if present in the initial conditions. This result is in apparent contrast with DNS calculations where a large-intensity, domain-scale cyclonic vortex appears to be long lived when injected in a convective system characterised by
 $Ro=O(1)$, in which large-scale structure would not spontaneously form (Favier et al. Reference Favier, Guervilly and Knobloch2019). Note, however, that in Favier et al. (Reference Favier, Guervilly and Knobloch2019) the subcritical sustenance of a LSV is only obtained in regimes for which
 $\widetilde {Ra}$ is large enough for the dynamics to be in a transition regime between states that are rotationally constrained and regimes for which the geostrophic balance is no longer valid at leading order. In the asymptotic QG model employed here, the latter is unattainable by definition (see § 2) and the subcritical formation of LSVs cannot be investigated in the present study. For simulations with
 $Ro\ll 1$ and
 $\widetilde {Ra}$ smaller than the threshold value for LSV formation, Favier et al. (Reference Favier, Guervilly and Knobloch2019) found that the final state is independent of the initial condition, in line with our results.
3.4. The influence of box dimensions
The horizontal dimensions of the simulation domain are represented in terms of integer multiples of the critical wavelength  $\lambda _c$. We indicate the horizontal size of the computational domain by
 $n_c \lambda _c \times n_c\lambda _c$, with
 $n_c$ being an integer. Most of the simulations were carried out with horizontal dimensions of
 $10\lambda _c \times 10 \lambda _c$ (i.e.
 $n_c=10$), which represents a trade-off between using a box size that is large enough to allow for computing converged statistics, and using a horizontal spatial resolution that is computationally feasible for an extensive exploration of the parameter space. Previous work has used values up to
 $n_c = 20$, but, to our knowledge, no systematic investigations of the box size on key quantities such as the Nusselt number and Reynolds number have been reported for rotating convection. For non-rotating convection, however, Stevens et al. (Reference Stevens, Blass, Zhu, Verzicco and Lohse2018) showed that surprisingly large box dimensions are needed to obtain convergence in all statistical quantities; in contrast, the same authors found that globally averaged quantities such as the Nusselt number converged with relatively small box dimensions. For the present work we have carried out simulations for fixed Rayleigh number and Prandtl number of
 $\widetilde {Ra}=40$ and
 $Pr=1$. Robust LSVs are present with this parameter combination. Time series of these simulations are available in the supplementary material (see supplementary figure 1).
Figure 9 shows the convective Reynolds number and Nusselt number, and the barotropic and baroclinic kinetic energy for a range of box sizes. The solid lines in figure 9(a) show the Nusselt and Reynolds number for a simulation in which the barotropic mode was set to zero at each time step. We observe a nearly 23 % increase in the heat transport when the barotropic mode is not present. This result might be interpreted in terms of the horizontal mixing that is induced by the barotropic mode; the vertical transport of heat is reduced when horizontal motions sweep heat laterally. In addition, we find that the Reynolds number is reduced by  ${\approx } 4.4\,\%$ with respect to the
 $n_c=20$ case. This observation suggests that the inverse cascade plays a relatively small role in influencing the amplitude of the convective flow speeds.
Influence of the horizontal dimensions of the simulation domain on various quantities. Results for simulations with different horizontal dimensions, as characterised by  $n_c\lambda _c\times n_c\lambda _c$, where
 $n_c$ is an integer and
 $\lambda _c$ is the critical horizontal wavelength. (a) Time-averaged Reynolds number
 $\widetilde {Re}$ and Nusselt number
 $Nu$ versus
 $n_c$; (b) normalised barotropic kinetic energy
 $K_{bt} n_c^{-2}$ and baroclinic kinetic energy
 $K_{bc}$. For all simulations shown here
 $Pr=1$ and
 $\widetilde {Ra}=40$. The horizontal solid blue and red lines labelled ‘
 $bc$’ represent the average values of
 $\widetilde {Re}$ and
 $Nu$, respectively, calculated for a simulation with
 $n_c=10$ in which the barotropic flow is set to zero. The horizontal dashed lines indicate the
 $n_c =20$ values for comparison with the baroclinic case.

An estimate for the intensity of LSVs based on the domain size can be made from the following simple argument. When well-developed LSVs are present, the dominant component of the kinetic energy spectra ( $k\lesssim 5$) scales approximately as
 $K_{bt}(k^*)\sim {k^*}^{-3}$ (Kraichnan Reference Kraichnan1967; Smith & Waleffe Reference Smith and Waleffe1999; Rubio et al. Reference Rubio, Julien, Knobloch and Weiss2014), where
 $k^* = k \tilde {k}_{box}$, with
 $\tilde {k}_{box} = 2{\rm \pi} L_{box}^{-1}$ and
 $L_{box}=n_c\lambda _c$, is the dimensional box-scale wavenumber. Calculating the total kinetic energy we obtain
 \begin{equation} K_{bt} = \int K_{bt}(k^*)\,\textrm{d}k^*\sim {k^*}^{-2} \sim L_{box}^2, \end{equation}
where  $K_{bt}\simeq K_{bt}(k^*=\tilde {k}_{box})$ when robust LSVs are observed in the system. In particular, by doubling the linear size of the (squared) domain the kinetic energy of LSVs is allowed to quadruple in magnitude. The DNS study of Favier et al. (Reference Favier, Silvers and Proctor2014) also observed an increase in the barotropic kinetic energy with increasing box size. Our QG data shown in figure 9(b) are supportive of this quadratic dependence on box size.
3.5. Scaling laws for the baroclinic dynamics
Here, we discuss least-squares fits to the baroclinic quantities  $\widetilde {Re}$ and
 $Nu$. Power-law scalings were computed from all data collected in this study (see table 1 and figure 1a) for various subsets of
 $\widetilde {Ra}$ and
 $Pr$. For
 $\widetilde {Re}$ with varying
 $Pr$, we used power-law fits of the form
 \begin{equation} \widetilde{Re} = \alpha_r (\widetilde{Ra} - \widetilde{Ra}_c)^{\beta_r} Pr^{\gamma_r}, \end{equation}
where  $\alpha _r$,
 $\beta _r$ and
 $\gamma _r$ are all numerically computed constants. For constant
 $Pr$, we used
 \begin{equation} \widetilde{Re}= \alpha_r (\widetilde{Ra} - \widetilde{Ra}_c)^{\beta_r}. \end{equation}
The numerically computed constants are denoted by  $\alpha _r$,
 $\beta _r$ and
 $\gamma _r$ and given in table 2.
Least-squares fits to the Reynolds number,  $\widetilde {Re} = \alpha _r (\widetilde {Ra} - \widetilde {Ra}_c)^{\beta _r} Pr^{\gamma _r}$ (for data encompassing multiple
 $Pr$) or
 $\widetilde {Re} = \alpha _r (\widetilde {Ra} - \widetilde {Ra}_c)^{\beta _r}$ (when a single
 $Pr$ is considered).

Fitting to all available data reported in this study (including the  $Pr=10$ dataset from Calkins et al. Reference Calkins, Julien, Tobias, Aurnou and Marti2016) we obtain
 $(\alpha _r,\beta _r,\gamma _r) = ( 0.1883, 1.1512, -1.2172)$. We notice that these values are not too different from a linear scaling of the form
 $\widetilde {Re}\sim \widetilde {Ra} Pr^{-1}$, again suggesting that the reduced Grashof number plays a key role in controlling the dynamics. For many of the cases we find that
 $\beta _r$ is closer to unity when a single value of
 $Pr$ is used. Figure 10(a) shows the compensated Reynolds number
 $\widetilde {Re} Pr/\widetilde {Ra}$, where we see that there is a range of
 $\widetilde {Ra}$ values over which this scaling provides a reasonably good fit. However, significant departure from this linear Grashof number scaling is observed for the lower values of
 $Pr$, i.e. those simulations that are characterised by the largest values of
 $\widetilde {Re}$. Interestingly, this departure seems to be correlated with the behaviour of the kinetic energy ratio
 $\varGamma$; the largest departures from the linear Grashof number scaling are observed for cases that possess the peak
 $\varGamma _{max}$, i.e. those cases in which
 $\widetilde {Re}\gtrsim 24$.
Scaling of the Reynolds number with  $\widetilde {Ra}$. (a) Compensated
 $\widetilde {Re}$ calculated according to
 ${\widetilde {Re}\sim \widetilde {Ra} Pr^{-1}}$. (b) Compensated
 $\widetilde {Re}$ calculated according to the law (3.7) and with values of
 $\alpha _r$,
 $\beta _r$ and
 $\gamma _r$ reported in table 2 for
 $Pr\in [1,10]$ and
 $\widetilde {Ra}\in [20,200]$ (i.e. all available
 $\widetilde {Re}$ data).

We note that because the QG model employed here is asymptotically reduced, the Ekman number does not appear explicitly in the governing equations. However, we can relate our small-scale Reynolds number to the large-scale Reynolds number typically employed in DNS studies by noting that the convective length scale and fluid depth are related by  $\ell = H Ek^{1/3}$. Thus,
 \begin{equation} \widetilde{Re} = \frac{\left\langle W_{rms}\right\rangle \ell}{\nu} = \left ( \frac{\left\langle W_{rms}\right\rangle H}{\nu} \right ) \left ( \frac{\ell}{H} \right ) = Re Ek^{1/3}. \end{equation}
Substituting the definition of the reduced Rayleigh number into the linear scaling  $\widetilde {Re} \sim \widetilde {Ra} /Pr$ we have
 \begin{equation} \widetilde{Re} \sim \frac{\widetilde{Ra}}{Pr} = \frac{Ra Ek^{4/3}}{Pr}. \end{equation}
Upon dividing through by  $Ek^{1/3}$ and using (3.9) we have the relationship
 \begin{equation} Re \sim \frac{Ra Ek }{Pr}. \end{equation}
The above scaling is consistent with the recent spherical convection study of Guervilly et al. (Reference Guervilly, Cardin and Schaeffer2019). However, we note that although the above large-scale Reynolds number scaling is diffusion free, the corresponding small-scale scaling is not.
Analogous least-squares fits to the Nusselt number ( $Nu$) are given by
 \begin{equation} Nu = \alpha_n (\widetilde{Ra} - \widetilde{Ra}_c)^{\beta_n} Pr^{\gamma_n}, \end{equation}
or
 \begin{equation} Nu = \alpha_n (\widetilde{Ra} - \widetilde{Ra}_c)^{\beta_n}, \end{equation}
for fixed values of Prandtl number. Results for various subsets of the explored parameters space are given in table 3. Figure 11(b) shows the compensated  $Nu$ according to (3.12) using all available data from the present study. From table 3 we see that the same fit using only the
 $1\leqslant Pr \leqslant 2$ cases suggests a fit that is roughly consistent with the ultimate scaling
 \begin{equation} Nu\sim\widetilde{Ra}^{3/2}Pr^{-1/2}, \end{equation}
in agreement with Julien et al. (Reference Julien, Rubio, Grooms and Knobloch2012b). Cases characterised by a lower  $\widetilde {Re}$ (e.g.
 $Pr\geqslant 3$) lead to a lower value for the exponent
 $\beta _n$ while using only the highest
 $\widetilde {Re}$ cases (
 $Pr=1$,
 $\widetilde {Ra} \geqslant 120$) leads to a higher value of
 $\beta _n$. Compensated
 $Nu$ values, based on the ultimate scaling (3.14), are illustrated in figure 11(a). This plot and the scaling coefficients reported in table 3 show the different scaling behaviours for cases characterised by values of
 $\widetilde {Re}$ below and above the value of
 $\widetilde {Re}=24$ for which
 $\varGamma$ reaches its maximum value (see figure 6b). The former exhibit a
 $Nu$ scaling with
 $\widetilde {Ra}$ less steep than the ultimate scaling (3.14), while above the transition the
 $\widetilde {Ra}$ exponent is higher. We also notice that the exponent
 $\gamma _n$ is, respectively, negative and positive, indicating a complex behaviour of
 $Nu$ in the input parameters
 $\widetilde {Ra}$ and
 $Pr$.
Least-squares fits to  $Nu = \alpha _n (\widetilde {Ra} - \widetilde {Ra}_c)^{\beta _n} Pr^{\gamma _n}$ (for data encompassing multiple
 $Pr$) or
 $Nu = \alpha _n (\widetilde {Ra} - \widetilde {Ra}_c)^{\beta _n}$ (when a single value of
 $Pr$ is considered). The third and fourth rows indicate calculations for the cases for which, respectively,
 $\widetilde {Re}>24$ and
 $1.5<\widetilde {Re}<24$. For
 $\widetilde {Re}=24$ the maximum value of
 $\varGamma$ is reached (see figure 6b) and data points for which
 $\widetilde {Re}<1.5$ are excluded as they exhibit transitional behaviour (see figure 11).

Scaling behaviour of the heat transport with  $\widetilde {Ra}$. (a) Compensated
 $Nu$ calculated according to
 $Nu\sim \widetilde {Ra}^{3/2} Pr^{-1/2}$. (b) Compensated
 $Nu$ calculated according to the law (3.7), and with values of
 $\alpha _n$,
 $\beta _n$ and
 $\gamma _n$ reported in table 3 for
 $Pr\in [1,7]$ and
 $\widetilde {Ra}\in [20,200]$ (i.e. all available
 $Nu$ data).

3.6. Balances
Vertical profiles of the horizontal r.m.s. of each term present in the baroclinic vertical vorticity, vertical momentum and fluctuating heat equations are shown in figures 12(a), 12(b) and 12(c), respectively, for the most extreme calculation of  $\widetilde {Ra}=200$ and
 $Pr=1$ (
 $\widetilde {Re} \approx 84$). All of the quantities shown have been time averaged. As shown previously (Julien et al. Reference Julien, Rubio, Grooms and Knobloch2012b), within this high-
 $\widetilde {Ra}$ regime, the dominant terms in the governing equations are given by
 \begin{gather} \partial_t \zeta' + J[\psi,\zeta] - \langle J[\psi,\zeta] \rangle \approx 0, \end{gather}
 \begin{gather}\partial_t w + J[\psi,w] \approx 0, \end{gather}
 \begin{gather}\partial_t \theta + J[\psi,\theta] \approx 0, \end{gather}
which shows that horizontal advection of all these quantities is a key characteristic of this regime. Close inspection of the first of these balances reveals that, as  $\widetilde {Re}$ grows, the advection of vorticity is increasingly dominated by the advection due to the barotropic flow, i.e.
 $J[\langle \psi \rangle ,\zeta ] \gg J[\psi ',\zeta ]$ for
 $\widetilde {Re}\gg 0$.
Vertical profiles of r.m.s. terms in: (a) the baroclinic vorticity equation (obtained by subtracting (2.9) from (2.1)); (b) the vertical momentum equation (2.2); and (c) the fluctuating heat equation (2.3). Profiles have been calculated as temporal averages for the case  $\widetilde {Ra}=200$,
 $Pr=1$ and are characteristic of all cases in the geostrophic turbulence regime, where LSV formation is robust.

On their own, the ‘balances’ given above reveal little about the resulting dynamics. Higher-order, or subdominant, effects are necessary in the dynamics, especially with regard to heat transport. Figure 12(b) suggests that small differences between the r.m.s. values of  $\partial _t w$ and
 $J[\psi ,w]$ are necessary to balance the vertical pressure gradient,
 ${\partial _Z} \psi$. This perturbative effect repeats again at even higher order, as figure 12(b) shows that the buoyancy force and vertical viscous force are approximately balanced, i.e.
 \begin{equation} \frac{\widetilde{Ra}}{Pr} \vartheta \approx {\nabla_\perp^2} w. \end{equation}
Moreover, we find a subdominant balance in the fluctuating heat equation between the advection of the mean temperature and horizontal thermal diffusion,
 \begin{equation} w {\partial_Z} \bar{\varTheta} \approx {\nabla_\perp^2} \theta. \end{equation}
To better understand the role of the subdominant balance between viscosity and buoyancy, we show in figure 13 the ratio of the vertical components of the r.m.s. viscous force,  $F_{v,z} = {\nabla _\perp ^2} w$, to the r.m.s. buoyancy force,
 $F_{b,z}=\widetilde {Ra} Pr^{-1} \vartheta$, as a function
 $\widetilde {Re}$. All of the different Prandtl number cases appear to show qualitatively similar behaviour, and, as figure 13 shows, a reasonable collapse of the data can be obtained when the force ratio is plotted versus the Reynolds number. Surprisingly, this ratio is an increasing function of
 $\widetilde {Re}$. This result is in stark contrast to non-rotating convection in which viscous forces become ever smaller (relative to other forces) with increasing Rayleigh number. Indeed, the so-called ‘free-fall’ scaling for convective flow speeds, characterised by a balance between buoyancy and inertia, relies on the influence of viscosity being weak (e.g. see Yan et al. Reference Yan, Calkins, Maffei, Julien, Tobias and Marti2019).
Ratio of the vertical components of the r.m.s. viscous force,  $F_{v,z} = {\nabla _\perp ^2} w$, to the r.m.s. buoyancy force,
 $F_{b,z}=\widetilde {Ra} Pr^{-1} \vartheta$, as a function of
 $\widetilde {Re}$.

4. Discussion and conclusions
A systematic investigation of rapidly rotating convection was carried out to determine the necessary conditions under which large-scale vortices (LSVs) form, and how the amplitude of such vortices and associated convective flow speeds scale with the input parameters. To achieve the extreme parameter regimes that are thought to be representative of natural systems such as planetary and stellar interiors, we have made use of an asymptotic description of the governing equations that rely on the assumption of a leading-order geostrophic balance. Varying the thermal Prandtl number has allowed us to determine the influence of fluid properties on the convective dynamics, and has also allowed for a more detailed control of the convective Reynolds numbers over our investigated range of Rayleigh numbers.
The LSVs form as a consequence of an inverse cascade that transports kinetic energy from small-scale, convective motions up to the system-wide scale, characterised by a box-normalised wavenumber of  $k=1$. These LSVs grow in time until the energy input from the convection is balanced by large-scale viscous dissipation. All of the simulations presented show evidence of this equilibration process, regardless of the particular values of
 $Pr$ and
 $\widetilde {Ra}$. We find that LSV-dominant convection can be characterised by a critical convective Reynolds number
 $\widetilde {Re} \approx 6$ across the range of investigated Prandtl numbers, in satisfactory agreement with low-
 $Ek$ DNS simulations performed at
 $Pr=1$ (Favier et al. Reference Favier, Silvers and Proctor2014; Guervilly et al. Reference Guervilly, Hughes and Jones2014). Although an increase in
 $Pr$ leads to a concomitant increase in viscous dissipation for a fixed value of
 $\widetilde {Ra}$, we find, for the first time to our knowledge in the asymptotic regime of rapid rotation, evidence of LSV-dominant convection in the ‘plume’ regime. This finding is in agreement with DNS calculations presented in Guervilly et al. (Reference Guervilly, Hughes and Jones2014), showing the presence of asymmetric LSVs for
 $Pr=1$ for
 $\widetilde {Ra} \geqslant 20$. Whether the emergence of LSVs at lower
 $\widetilde {Ra}$ values is related to their asymmetric nature in finite
 $Ro$ calculations will be the subject of future studies.
In particular we observed the formation of barotropic vortices with a Prandtl number as high as  $Pr=7$, a value that is representative of water at typical laboratory conditions. This finding suggests that LSVs may be detectable in laboratory experiments that use water as the working fluid. From the data reported in this study we can estimate a threshold value of
 $\widetilde {Ra}_t\simeq 120$ for the LSVs to form at
 $Pr=7$ which can be translated into large-scale
 $Ra_{t}$ for a given
 $Ek$ via (2.5). State-of-the-art laboratory experiments can reach
 $Ek=10^{-8}$ (Cheng et al. Reference Cheng, Stellmach, Ribeiro, Grannan, King and Aurnou2015, Reference Cheng, Madonia, Guzmán and Kunnen2019) giving
 $Ra_{t}\simeq 5.6\times 10^{12}$, a value for which heat transfer data suggest convection to be in a transitional regime between rotationally dominated and a non-rotating dynamics. We note that the presence of no-slip boundaries (not used in the present study) has been shown to partially suppress LSV formation (Plumley et al. Reference Plumley, Julien, Marti and Stellmach2016). By extension, we might expect rotating convection calculations in triply periodic domains, such as those used in the referenced turbulence studies (Smith & Waleffe Reference Smith and Waleffe1999; Sen et al. Reference Sen, Mininni, Rosenberg and Pouquet2012; Pouquet et al. Reference Pouquet, Sen, Rosenberg, Mininni and Baerenzung2013; Buzzicotti et al. Reference Buzzicotti, Aluie, Biferale and Linkmann2018; Seshasayanan & Alexakis Reference Seshasayanan and Alexakis2018) to facilitate the formation of vertically invariant, domain-filling vortices when compared to studies in the presence of horizontal boundaries. Note, however, that cases for which
 $K_{bt}(k=1)>K_{bt}(k>1)$ are found in presence of no-slip boundaries as well, suggesting that robust LSVs can be found in realistic settings. Indeed, recent DNS investigations (Guzmán et al. Reference Guzmán, Madonia, Cheng, Ostilla-Mónico, Clercx and Kunnen2020) confirmed the formation of LSVs in presence of no-slip boundaries. In fact, heat transfer data show that the baroclinic dynamics is enhanced in presence of realistic boundary conditions (Stellmach et al. Reference Stellmach, Lischper, Julien, Vasil, Cheng, Ribeiro, King and Aurnou2014; Plumley et al. Reference Plumley, Julien, Marti and Stellmach2016). Given these competing effects, additional studies are needed to determine the threshold for LSV-dominant convection with no-slip boundaries.
Several properties of LSVs have been studied. In agreement with the DNS study of Guervilly et al. (Reference Guervilly, Hughes and Jones2014), we find that the relative size of the kinetic energy of the barotropic flow to that of the convection reaches a maximum value at a particular value of the Rayleigh number. However, with DNS studies, there is a corresponding increase in the Rossby number with increasing Rayleigh number. In contrast, the asymptotic model used here only captures the asymptotically small Rossby number limit, showing that this change in the growth of the LSVs must be present in the rapidly rotating regime. When data from the entire range of  $Pr$ is plotted as a function of Reynolds number, the peak in the barotropic kinetic energy occurs near
 $\widetilde {Re} \approx 24$. Therefore, the growth of the barotropic kinetic energy slows as the Rayleigh number is increased, suggesting that there is an optimum forcing level. We find that this change in behaviour is related to a decrease in the velocity and vorticity correlations that are necessary to drive the inverse cascade. Our findings suggest that additional regimes, beyond the accessible limits of the present investigation, may be present in the convective dynamics as the Rayleigh number is increased further.
The horizontal dimensions of the simulation domain are shown to have a direct influence on the energy present in the LSVs. It is found that the energy associated with the LSVs grows quadratically with the horizontal dimension of the simulation domain (assuming domains of square cross-section), in agreement with DNS calculations (Favier et al. Reference Favier, Silvers and Proctor2014). This finding is likely linked to the total available convective kinetic energy, which also grows quadratically with the horizontal dimensions of the simulation domain. Although a detailed investigation of the dynamical effect of this scaling was beyond the scope of the present investigation, this geometry-dependent effect may nevertheless have implications on the resulting dynamics.
The simulations suggest that there is no obvious scaling regime in the convective flow speeds with increasing Rayleigh number. A linear scaling of the form  $\widetilde {Re} \sim \widetilde {Ra}/Pr$ appears to collapse the data over a limited range in
 $\widetilde {Ra}$, but the highest
 $\widetilde {Re}$ cases diverge from this scaling at the highest accessible values of
 $\widetilde {Ra}$. We note that this linear scaling can be translated to an equivalent large-scale Reynolds number scaling of the form
 $Re \sim Ek Ra/Pr$, which has been noted in previous studies of rotating convection (Guervilly et al. Reference Guervilly, Cardin and Schaeffer2019). Although this scaling is independent of the diffusion coefficients
 $\nu$ and
 $\kappa$ when viewed on the largest scales of the system, the small scales remain influenced by viscosity. Indeed, the simulations have revealed that the ratio of the r.m.s. viscous force to the r.m.s. buoyancy force in the vertical component of the momentum equation is an increasing function of
 $\widetilde {Ra}$ (or equivalently
 $Ra$). This observation may simply be a result of the energetics of the Boussinesq system that requires the net heat transport to be balanced by viscous dissipation. In this regard, it might be argued that viscosity is fundamental to rotating convective dynamics.
Supplementary material and movies
Supplementary material and movies are available at https://doi.org/10.1017/jfm.2020.1058.
Acknowledgements
The authors wish to thank three anonymous referees for their constructive comments that greatly improved the original manuscript. The authors acknowledge the Texas Advanced Computing Center (TACC) at The University of Texas at Austin for providing high performance computing and database resources that have contributed to the research results reported herein. Volumetric renderings were produced with the visualization software VAPOR, a product of the Computational Informations Systems Laboratory at the National Center for Atmospheric Research.
Funding
This work was supported by the National Science Foundation under grant EAR #1620649 (S.M., M.A.C. and K.J.). M.K. was partially supported by the Undergraduate Research Opportunities Program at the University of Colorado, Boulder. This work utilised the RMACC Summit supercomputer, which is supported by the National Science Foundation (awards ACI-1532235 and ACI-1532236), the University of Colorado Boulder and Colorado State University. The Summit supercomputer is a joint effort of the University of Colorado Boulder and Colorado State University.
Declaration of interests
The authors report no conflict of interest.


 Open access

