Layered silicate minerals are widely distributed on the Earth’s surface environment. Through interactions with the atmosphere and aqueous solutions, these minerals continuously undergo refinement, component dissolution, structural evolution and reorganization (Kulp & Brobst, Reference Kulp and Brobst1954; Bowser & Jones, Reference Bowser and Jones2002; Hao et al., Reference Hao, Flynn, Kashiwabara, Alam, Bandara and Swaren2019). Typical transformation pathways include the conversion of serpentine to montmorillonite (Ji et al., Reference Ji, Zhu, He, Tao, Zhu and Ma2018), phlogopite to vermiculite (Wu et al., Reference Wu, Qiang, Fan, Zhao, Liu and Li2018) and illite to montmorillonite (Biondino et al., Reference Biondino, Borrelli, Critelli, Muto, Apollaro and Coniglio2020). These processes not only create diverse mineral assemblages in nature but also play a critical role in maintaining the balance of Earth’s ecosystems through the release of ions during alteration (Murakami et al., Reference Murakami, Utsunomiya, Yokoyama and Kasama2003).
As a common layered silicate mineral found in soils and various mineral deposits, phlogopite releases ions such as K+ and Mg2+ during weathering and alteration processes. These released ions provide essential nutrients for plant growth and play a significant role in shaping groundwater chemistry (Augusto et al., Reference Augusto, Ranger, Turpault and Bonnaud2001; Andrist-Rangel et al., Reference Andrist‐Rangel, Simonsson, Andersson, Öborn and Hillier2006; Barré et al., Reference Barré, Montagnier, Chenu, Abbadie and Velde2008; McMaster, Reference McMaster2012). An objective assessment of the geochemical behaviour of phlogopite in surface environments and its environmental impacts is of substantial significance for advancing research in related fields. As a common layered silicate mineral and an important non-metallic mineral resource, phlogopite is the magnesium endmember of the biotite solid solution series, with the structural formula KMg3(AlSi3O10)(F,OH)2, while vermiculite, with the structural formula (Mg,Ca,Na)x(H2O)n{(Mg,Fe,Al)3[(Si,Al)4O10]}(OH)2, forms in nature through the weathering or hydrothermal alteration of biotite or phlogopite. Both minerals are monoclinic and in the same space group of C2/m. The vermiculitization of phlogopite during weathering and alteration processes not only serves as a key window for understanding the crystal chemistry and genetic mineralogy of layered silicates but also provides critical scientific insights for the rational utilization of mineral resources and coordinated ecological environmental protection by elucidating its transformation mechanisms and associated elemental release patterns.
This study aims to investigate the role of various anions in the vermiculitization process of phlogopite from Yuli, Xinjiang. Although previous research has confirmed that cations such as Na+, Mg2+, and Ba2+ can promote vermiculitization (e.g. Huang et al., Reference Huang, Luo, Sun, Peng and Chen2023), the mechanism by which these various anions (which commonly coexist in natural systems) affect this process remains unclear. Particularly under near-acidic conditions, organic anions can form complexes with metal ions released from minerals, significantly accelerating mineral dissolution, suggesting that anions may play a non-negligible role in the vermiculitization process. Therefore, through a series of constant-temperature water bath experiments, this study systematically examines the regulatory effects of key conditions such as solution pH, temperature and medium composition on vermiculitization, with a focus on elucidating the mechanistic influence of various types of anions on the structure and properties of the resulting products. Through this research, we aim to fill the current knowledge gap regarding the mechanistic role of anions in the weathering alteration process of phlogopite and to provide mineralogical foundations and experimental support to gain a deeper understanding of the release and migration of key elements such as potassium and magnesium in surficial environments (material cycling), the contribution of secondary mineral formation to soil development and the coupled relationship between mineral-phase transformations and water quality evolution during long-term geological–environmental processes.
Experimental
Sample preparation
Phlogopite (XJP) was obtained from the Qeganbulake vermiculite deposit in Yuli County, Xinjiang (China). The purified phlogopite sample was thoroughly ground and sieved to a 150–200 mesh fraction. Utilizing a planetary ball mill with a ball-to-powder ratio of 10:1–15:1 and a rotational speed of ∼350 rpm, the bulk phlogopite was efficiently and uniformly ground to a target fineness of 200 mesh via intermittent grinding.
The crystal structural parameters for vermiculite (a = 5.24 Å, b = 9.17 Å, c = 28.6 Å, β = 94.6°) and phlogopite (a = 5.3158 Å, b = 9.2036 Å, c = 10.31 Å, β = 99.891°, V = 496.914 Å3) were taken from the Minerals Database and Mindat.org (2024), based on Hendricks et al. (Reference Hendricks and Jefferson1938), Pavese et al. (Reference Pavese, Benazzi and Montagnoli2003) and Von Reichenbach (Reference Von Reichenbach1994).
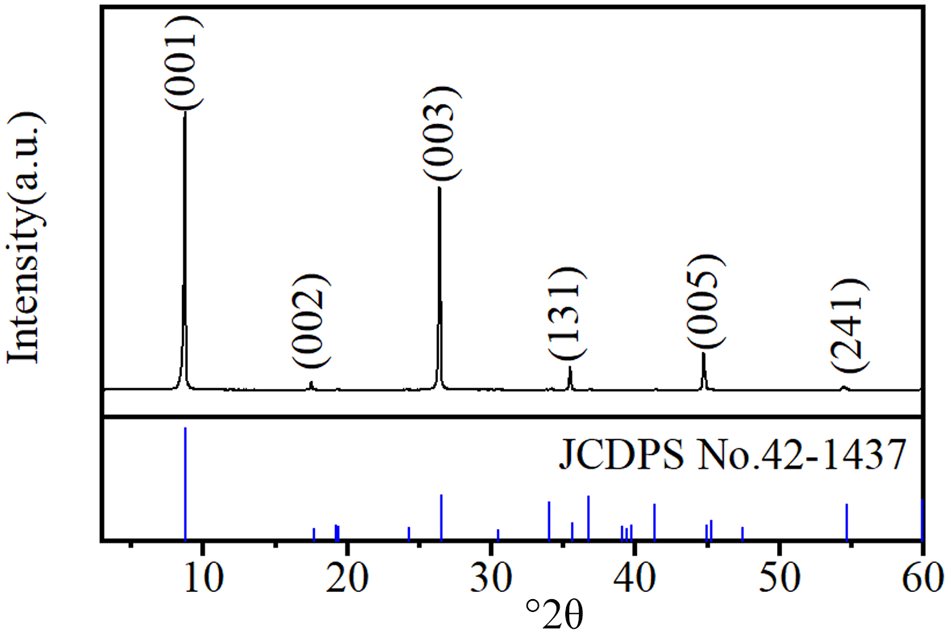
The X-ray diffraction (XRD) trace in Fig. 1 identifies phlogopite as the predominant mineral phase in the raw material (d 001 = 10.05 Å, d 002 = 5.02 Å, d 003 = 3.35 Å, d 131 = 2.51 Å, d 005 = 2.01 Å, d 241 = 1.67 Å). The absence of other discernible diffraction peaks indicates the high purity of the raw material, with negligible mineral content impurities.
XRD trace of phlogopite. JCPDS = Joint Committee on Powder Diffraction Standards.

Figure 1 Long description
Five plots show adsorption capacity qt (mg g superscript -1) over time (min) for conditions MD-R, MD-C, SD-S, SD-M and CD-S. The x-axis ranges from 0 to 400 minutes and the y-axis ranges from 0 to 10 mg g superscript -1. Each plot includes two model fits: PFO Non-linear model (red dashed line) and PSO Non-linear model (blue solid line). Data points are marked with filled circles for F(t) less than or equal to 0.9 and open circles for F(t) greater than 0.9. MD-R and MD-C show rapid adsorption reaching a plateau around 10 mg g superscript -1 by approximately 100 minutes. SD-S and SD-M reach a similar plateau slightly later. CD-S shows a lower plateau around 8 mg g superscript -1. The PSO model generally tracks the data more closely than the PFO model, especially in the initial rise. The legend explains marker categories based on F(t) thresholds, indicating different adsorption phases. The plots highlight differences in adsorption kinetics under varying conditions, with MD-R and MD-C achieving equilibrium fastest.
The reagents used were H2O2 (30%, analytical reagent (AR), Chron Chemicals), oxalic acid dihydrate (99.7%, AR, Chron Chemicals), MgSO4 (99.9%, AR, Chron Chemicals) and MgCl2 (99.9%, AR, Chron Chemicals), as well as self-made ultrapure water with resistivity higher than 18.2 MΩ cm–1.
Effects of H2O2 or MgSO4 solution pH on the vermiculitization of phlogopite
For this experiment, 40 mL of ultrapure water and 20 mL of 30% H2O2 (or a stoichiometric amount of MgSO4 solid to achieve a concentration of 1.0 mol L–1) was added to a 100 mL beaker. The solution pH was then adjusted with oxalic acid to obtain 60 mL of H2O2 (or MgSO4) solution at the various pH values. Subsequently, 1.0 g of phlogopite was introduced, and the mixture was heated under stirring at 45°C for 10 h in a constant-temperature water bath. Upon reaction completion, the filtrate was collected and diluted to 100 mL, while the filter residue was dried in a 100°C oven for 12 h (Table 1).
Experimental scheme regarding the effects of pH of the H2O2–MgSO4 solution on phlogopite vermiculitization.

Table 1 Long description
Experimental setup for converting 1 gram of phlogopite dust toward vermiculite using a peroxide and magnesium sulfate treatment while varying solution pH. The reaction conditions are 45 degrees Celsius and 10 hours. One step uses 60 milliliters of hydrogen peroxide solution, with the sample code formatted as HCP-V-pH followed by the pH value. A second step uses magnesium sulfate at a magnesium ion concentration of 1.0 mol per liter, with the sample code formatted as CMSP-V-pH followed by the pH value. The table defines the components and fixed conditions but does not list specific pH values or measured outcomes, so comparisons across pH are implied by the coding rather than shown as results.
C = oxalic acid dihydrate; H = H2O2; MS = MgSO4; P = phlogopite; V = vermiculite; x = pH value.
Effects of oxalic acid solution anion type on the vermiculitization of phlogopite
MgSO4 or MgCl2 (Na2SO4 or NaCl) was dissolved in water in a 100 mL beaker. Then, 20 mL H2O2 at 30% concentration was added, and the solution pH was adjusted with oxalic acid. Finally, 60 mL oxalic acid solution containing different anions (Cl–, SO42–) in the form of Mg2+ and Na+ salts was added. The concentration of Mg2+ and Na+ in the solution was 1.0 mol L–1. After 1.0 g of phlogopite was added, the solution containing Mg2+ was heated and stirred for 10 h and then removed. The solution containing Na+ was reacted for 2, 4, 6, 8 and 10 h. After the reaction was completed, the suspension was filtered and the filter residue was dried at 100°C for 12 h and then stored (Table 2).
Experimental scheme regarding the effects of the anion type of the oxalic acid solution on phlogopite vermiculitization.

Table 2 Long description
Experimental conditions for converting 1 gram of phlogopite to vermiculite are organized by temperature, reaction time, solution components, ion concentration, volume, and sample code. All runs use 45 degrees Celsius and a 60 milliliter solution volume, with oxalic acid and hydrogen peroxide present as the base solution. One set holds reaction time at 10 hours and varies pH, comparing magnesium sulfate versus magnesium chloride as the added salt, each at 1 mole per liter for the relevant cation. A second set uses sodium salts at 1 mole per liter for sodium and varies reaction time across 2, 4, 6, 8, and 10 hours, comparing sodium sulfate versus sodium chloride. Sample codes encode the salt type and whether pH or reaction time is the variable. The table lists planned conditions and identifiers but does not report measured outcomes such as yield, extent of vermiculitization, or final pH values.
C = oxalic acid dihydrate; H = H2O2; MS = MgSO4; NC = NaCl; NS = Na2SO4; P = phlogopite; Ty = reaction time; V = vermiculite; x = pH value.
Sample characterization
An XRD device (D8 Advance, Bruker, Germany), equipped with a LynxEye silicon strip detector, was used to determine the mineralogy of the samples. The testing conditions were Cu-Kα radiation (λ = 0.15406 nm), 40 kV, 40 mA, divergence slit 1 mm, anti-scatter slit 1 mm, receiving slit 0.6 mm, Soller slit collimator 2.5°, scanning range 3–80°2θ, scanning speed 2° min–1 and step size 0.02°2θ. Field-emission scanning electron microscopy (SEM; Sigma 300, ZEISS, Germany) was used to analyse the morphology of the samples. The operating parameters included an acceleration voltage of 5–10 kV, high vacuum mode (<5 × 10⁻⁴ Pa) and a secondary electron (SE) detector. Powder samples were fixed on conductive carbon tape and sputter-coated with a thin gold layer (∼10 nm) for 60 s to improve conductivity before observation. The ion content in solution was determined by inductively coupled plasma optical emission spectrometer (ICP-OES; PerkinElmer Optima 8300). Thermogravimetric differential scanning calorimetry (TG-DSC) analysis was performed using a NETZSCH STA 449F5 synchronous thermal analyser. Approximately 10 mg of sample was weighed and loosely packed without pressing into a Pt–Rh crucible with a lid. An empty, covered crucible was used as the reference. The testing was carried out in a flowing air atmosphere with a flow rate of 50 mL min–1, heated from room temperature to 1273 K at a heating rate of 5 K min–1. A Type S thermocouple (Pt/Pt90Rh10) was used for temperature measurement. Fourier-transform infrared (FTIR) spectroscopy (Nicolet iS50, Thermo Scientific, USA) was used to characterize the surface functional groups of the samples. The samples were prepared using the KBr pellet method: the sample was mixed with spectral-grade KBr at a mass ratio of ∼1:100 and pressed into a transparent pellet for testing.
Results and discussion
Effects of various pH values of H2O2 or MgSO4 solution on the transformed products
The structure of phlogopite remains largely intact even with decreasing pH in H2O2 solutions, demonstrating that the mineral is resistant to transformation into vermiculite using only oxalic acid and H2O2 (Fig. 2a).
XRD traces of the transformed products of phlogopite in (a) H2O2 and (b) MgSO4 solutions at various pH values.

Figure 2 Long description
Five scatter plots are arranged in a grid: MD-R and MD-C in the top row, SD-S in the top right, SD-M and CD-S in the bottom row. Each plot shares the same axis structure. The horizontal axis is labeled t superscript 0.5 in minutes superscript 0.5, ranging from 0 to 20. The vertical axis is labeled q subscript t in milligrams per gram, ranging from 0 to 12. A shared legend identifies three marker types corresponding to three regions. Region 1 is labeled External Film Diffusion. Region 2 is labeled Pore Diffusion Controlled. Region 3 is labeled Equilibrium. A dashed line connects the data points across all regions in each panel. In each panel, Region 1 markers appear at lower t superscript 0.5 values (approximately 2 to 4), Region 2 markers span the mid-range (approximately 5 to 10) and Region 3 markers appear at higher t superscript 0.5 values (approximately 10 to 20). MD-R panel: Region 1 spans approximately (2, 2) to (4, 5). Region 2 spans approximately (5, 6) to (8, 8). Region 3 spans approximately (10, 9) to (20, 10), with equilibrium q subscript t near 10 milligrams per gram. MD-C panel: Region 1 spans approximately (2, 2) to (4, 5). Region 2 spans approximately (5, 6) to (8, 8). Region 3 spans approximately (10, 9) to (20, 10), with equilibrium q subscript t near 10 milligrams per gram. SD-S panel: Region 1 spans approximately (2, 2) to (4, 6). Region 2 spans approximately (5, 7) to (8, 9). Region 3 spans approximately (10, 10) to (20, 11), with equilibrium q subscript t near 11 milligrams per gram, the highest among all five panels. SD-M panel: Region 1 spans approximately (2, 3) to (4, 6). Region 2 spans approximately (5, 7) to (8, 9). Region 3 spans approximately (10, 10) to (20, 10), with equilibrium q subscript t near 10 milligrams per gram. CD-S panel: Region 1 spans approximately (2, 2) to (4, 5). Region 2 spans approximately (5, 6) to (8, 8). Region 3 spans approximately (10, 9) to (20, 10), with equilibrium q subscript t near 10 milligrams per gram. Across all five panels, the steepest slope occurs in Region 1, a moderate slope is observed in Region 2 and Region 3 shows a near-flat plateau indicating equilibrium. SD-S reaches the highest equilibrium q subscript t value at approximately 11 milligrams per gram. MD-R, MD-C, SD-M and CD-S all reach equilibrium at approximately 10 milligrams per gram. Region 2 to Region 3 transition occurs at approximately t superscript 0.5 equals 10 across all panels.
The intensity of the (001) diffraction peak of vermiculite increases with decreasing pH of the MgSO4 solution (Fig. 2b). This increase indicates that acidic conditions promote the transformation of phlogopite to vermiculite in the presence of Mg2+, as the interlayer K+ is exchanged with Mg2+ from the solution. The reaction results in the conversion of phlogopite into vermiculite (Rich & Black, Reference Rich and Black1964; Sawhney, Reference Sawhney1970). However, the efficacy of Mg2+ alone in driving this transformation appears limited, as evidenced by the XRD traces in Fig. 2b.
Effects of anion type in oxalic acid solution on the transformation products
Previous studies have established that direct transformation of phlogopite to vermiculite in H2O2 or MgSO4 solutions under atmospheric acidic conditions is ineffective (e.g. Huang et al., Reference Huang, Luo, Sun, Peng and Chen2023). This conversion process primarily entails Fe2+ oxidation, layer-charge reduction and the activation and exchange of interlayer K+ (Jeong & Kim, Reference Jeong and Kim2003; Murakami et al., Reference Murakami, Ito, Utsunomiya, Kasama, Kozai and Ohnuki2004). Previous studies have also identified the varying impacts of environmental anions on mineral dissolution and transformation (e.g. Huang et al., Reference Huang, Luo, Sun, Peng and Chen2023). In this study, we investigated the influence of SO42– and Cl– on vermiculite by adding MgSO4 or MgCl2 to a blended solution of H2C2O4 and H2O2. The experiments were conducted under identical Mg2+ concentration conditions to ensure valid comparisons.
Figure 3 presents the XRD traces of the transformed products in various anionic solutions. The degree of phlogopite to vermiculite conversion increases with decreasing solution pH, irrespective of the anionic solution (Fig. 3a,b). The conversion rate is maximal at pH = 1.
XRD traces of transformed products in various anionic solutions: (a) MgSO4 + H2O2 and (b) MgCl2 + H2O2.

There are two reasons explaining this observation. First, the similar hydration radii of Mg2+ and K+ in the solution enables Mg2+ to interact with the interlayer sites of phlogopite. The similarity in hydrated radii between Mg2+ and K+ arises from a trade-off between two opposing factors: the small ionic radius and high charge density of Mg2+ lead to extensive hydration, whereas the large ionic radius and low charge density of K+ result in limited hydration. This counterbalancing effect makes their effective hydrated radii similar, thereby enabling Mg2+ to exchange with K+ and enter the interlayer of phlogopite (Nightingale Jr, Reference Nightingale1959; Volkov et al., Reference Volkov, Paula and Deamer1997). In addition, due to the presence of H2O2, more Fe2+ in the octahedral structure of phlogopite is oxidized to Fe3+, which disrupts the original charge balance in the structure of phlogopite, thus leading to the release of more cations from the mineral structure. Second, as the solution’s pH value decreases, the solution becomes more acidic, partially dissolving the tetrahedral and octahedral sheets of phlogopite, resulting in the release of cations (Al3+, Fe3+) from the structure of phlogopite. Additionally, an increase in the concentration of C2O42– in the solution promotes the formation of metal–organic ligand complexes. These effects expedite the alteration of the electric charge and the discharge of ions in phlogopite’s structure, resulting in the transformation of phlogopite into vermiculite. The increase in C2O42– concentration promotes the formation of stable, soluble metal–organic complexes with structurally released cations from tetrahedral and octahedral sites. This process effectively and permanently extracts these charge-balancing cations from the crystal structure, leading to a permanent reduction in the net negative charge (layer charge) of the 2:1 layer. The diminished layer charge weakens the binding force on interlayer K+, facilitating its exchange with hydrated cations from the solution. Subsequent hydration and expansion of the interlayer domain then ultimately drives the transformation of phlogopite into vermiculite.
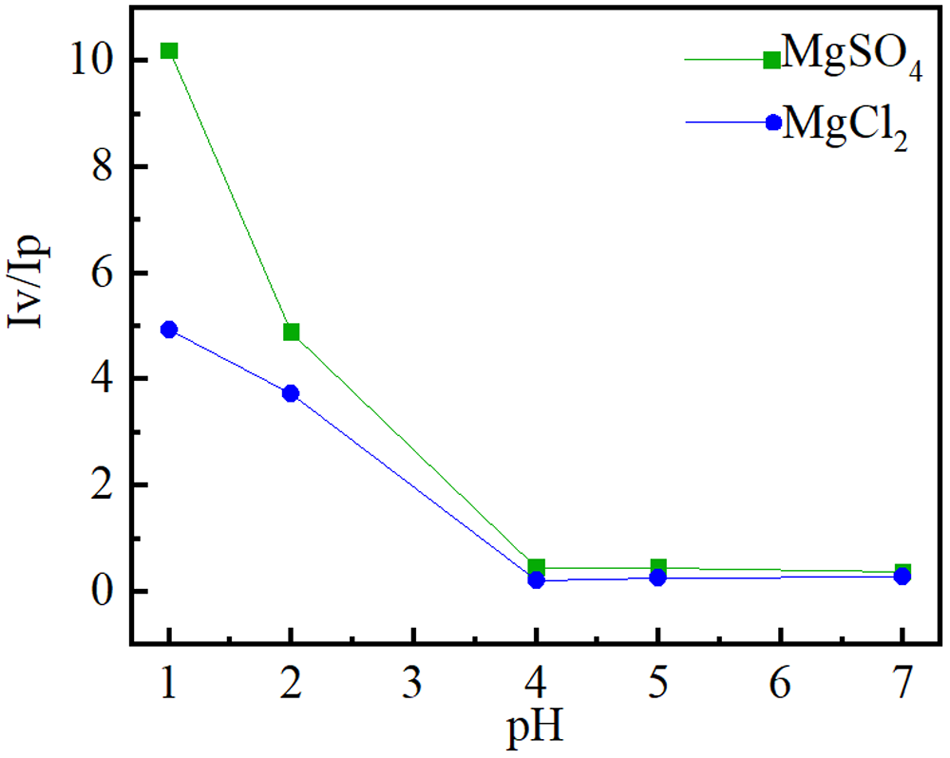
Figure 4 illustrates the intensity ratio of the (002) vermiculite diffraction peak in comparison to that of the (001) phlogopite diffraction peak. At pH > 4, the intensity ratio of the diffraction peaks alters only very slowly. These results imply that at pH > 4 the conversion of phlogopite into vermiculite is negligible. However, the intensity ratio of the diffraction peaks increases rapidly as the solution pH decreases to ≤3, indicating a rapid increase in the vermiculite content in the product. Furthermore, the ratio of the vermiculite to phlogopite diffraction peak intensity is significantly lower in a MgCl2 acid solution compared to a MgSO4 acid solution. This indicates that even though the concentration of SO42– in the acid solution is less than that of Cl–, SO42– has a stronger impact on the conversion of phlogopite into vermiculite than Cl–. This enhancement is probably due to SO42– inducing more severe structural damage in phlogopite, thereby promoting greater ion release and exchange.
Intensity ratio of the (002) diffraction peak of the vermiculite crystal plane into that of the (001) phlogopite peak.

Figure 4 Long description
The image A showing a line graph labeled MD-R. X-axis label: C subscript e (milligram L superscript negative 1). X-axis range: 400 to 1600. Y-axis label: q subscript e (milligram g superscript negative 1). Y-axis range: 0 to 12. Legend entries and visual markers: Experimental Data shown as open circle markers; Langmuir Non-Linear Model shown as a dashed line; Freundlich Non-Linear Model shown as a solid line. Experimental Data coordinate pairs: Insufficient visual information to describe this element accurately. Langmuir Non-Linear Model coordinate pairs: Insufficient visual information to describe this element accurately. Freundlich Non-Linear Model coordinate pairs: Insufficient visual information to describe this element accurately. Observed plotted relationships: Both model lines increase with increasing C subscript e and level off toward higher C subscript e. The Experimental Data markers follow the two model lines closely across the plotted range. The plotted q subscript e values start near about 3 to 4 at the lowest C subscript e and approach about 10 to 11 near the highest C subscript e. The image B showing a line graph labeled MD-C. X-axis label: C subscript e (milligram L superscript negative 1). X-axis range: 400 to 1600. Y-axis label: q subscript e (milligram g superscript negative 1). Y-axis range: 0 to 12. Legend entries and visual markers: Experimental Data shown as open circle markers; Langmuir Non-Linear Model shown as a dashed line; Freundlich Non-Linear Model shown as a solid line. Experimental Data coordinate pairs: Insufficient visual information to describe this element accurately. Langmuir Non-Linear Model coordinate pairs: Insufficient visual information to describe this element accurately. Freundlich Non-Linear Model coordinate pairs: Insufficient visual information to describe this element accurately. Observed plotted relationships: Both model lines increase with increasing C subscript e and level off toward higher C subscript e. The Experimental Data markers follow the two model lines closely across the plotted range. The plotted q subscript e values start near about 3 to 4 at the lowest C subscript e and approach about 9 to 10 near the highest C subscript e. The image C showing a line graph labeled SD-S. X-axis label: C subscript e (milligram L superscript negative 1). X-axis range: 800 to 2800. Y-axis label: q subscript e (milligram g superscript negative 1). Y-axis range: 0 to 12. Legend entries and visual markers: Experimental Data shown as open circle markers; Langmuir Non-Linear Model shown as a dashed line; Freundlich Non-Linear Model shown as a solid line. Experimental Data coordinate pairs: Insufficient visual information to describe this element accurately. Langmuir Non-Linear Model coordinate pairs: Insufficient visual information to describe this element accurately. Freundlich Non-Linear Model coordinate pairs: Insufficient visual information to describe this element accurately. Observed plotted relationships: Both model lines increase with increasing C subscript e and level off toward higher C subscript e. The Experimental Data markers follow the two model lines closely across the plotted range. The plotted q subscript e values start near about 5 at the lowest C subscript e and approach about 10 to 11 near the highest C subscript e. The image D showing a line graph labeled SD-M. X-axis label: C subscript e (milligram L superscript negative 1). X-axis range: 800 to 2800. Y-axis label: q subscript e (milligram g superscript negative 1). Y-axis range: 0 to 12. Legend entries and visual markers: Experimental Data shown as open circle markers; Langmuir Non-Linear Model shown as a dashed line; Freundlich Non-Linear Model shown as a solid line. Experimental Data coordinate pairs: Insufficient visual information to describe this element accurately. Langmuir Non-Linear Model coordinate pairs: Insufficient visual information to describe this element accurately. Freundlich Non-Linear Model coordinate pairs: Insufficient visual information to describe this element accurately. Observed plotted relationships: Both model lines increase with increasing C subscript e and level off toward higher C subscript e. The Experimental Data markers follow the two model lines closely across the plotted range. The plotted q subscript e values start near about 5 at the lowest C subscript e and approach about 10 to 11 near the highest C subscript e. The image E showing a line graph labeled CD-S. X-axis label: C subscript e (milligram L superscript negative 1). X-axis range: 400 to 2800. Y-axis label: q subscript e (milligram g superscript negative 1). Y-axis range: 0 to 12. Legend entries and visual markers: Experimental Data shown as open circle markers; Langmuir Non-Linear Model shown as a dashed line; Freundlich Non-Linear Model shown as a solid line. Experimental Data coordinate pairs: Insufficient visual information to describe this element accurately. Langmuir Non-Linear Model coordinate pairs: Insufficient visual information to describe this element accurately. Freundlich Non-Linear Model coordinate pairs: Insufficient visual information to describe this element accurately. Observed plotted relationships: Both model lines increase with increasing C subscript e and level off toward higher C subscript e. The Experimental Data markers follow the two model lines closely across the plotted range. The plotted q subscript e values start near about 4 to 5 at the lowest C subscript e and approach about 10 to 11 near the highest C subscript e.
X-ray photoelectron spectroscopy analysis
Figure 5 presents the high-resolution Fe 2p X-ray photoelectron spectroscopy (XPS) spectra of the sample, and Table 3 summarizes the corresponding binding energies derived from the Fe 2p XPS spectra. The ratio of the Fe2+ to Fe3+ areas in the Fe 2p3/2 region of raw phlogopite (XJP) is determined to be 0.81:1 (Fig. 5a & Table 3). In contrast, the treated samples (XJP-MgSO4 and XJP-MgCl2) exhibit decreased Fe2+/Fe3+ area ratios of 0.73:1 and 0.66:1, respectively (Fig. 5b,c & Table 3), indicating a discernible reduction in the relative proportion of Fe2+ following the vermiculitization of phlogopite.
Fe 2p high-resolution XPS spectra of the hydrothermal samples: (a) XJP, (b) XJP-MgSO4 and (c) XJP-MgCl2.

Binding energies (eV) for the Fe 2p XPS spectra.

Table 3 Long description
Fe two p XPS peak positions and component atomic percentages are listed for three samples, separating Fe two plus and Fe three plus contributions for the two p three halves and two p one halves regions, plus a Fe two plus to Fe three plus area ratio and peak width. For Fe two p three halves, Fe two plus binding energy is about 709.4 to 709.9 eV and Fe three plus is about 712.2 to 712.6 eV across all samples. For Fe two p one halves, Fe two plus is about 722.5 to 723.5 eV and Fe three plus is about 725.1 to 726.2 eV. The Fe two plus to Fe three plus area ratio declines from XJP (0.81 to 1) to XJP MgSO4 (0.73 to 1) to XJP MgCl (0.66 to 1), indicating a relative shift toward more Fe three plus with the salt treatments. Atomic percentages also reflect this shift: Fe three plus components rise from 14.80 and 19.20 in XJP to 16.20 and 19.36 in MgSO4 and to 17.64 and 21.09 in MgCl, while Fe two plus components are similar or slightly lower. Peak width is constant at 2.40 eV for all samples, so differences are mainly in relative component contributions rather than broadening. Values are specific to the fitting model used for deconvolution, so comparisons are most reliable within this table rather than against different fitting approaches.
FWHM = full width at half maximum.
Combined with the XRD analysis, these results suggest a progressive increase in Fe3+ content within the crystal structure as phlogopite transforms into vermiculite. Furthermore, the higher Fe3+ content observed in the SO42–-treated sample implies that SO42– ions facilitate the vermiculitization process more effectively than Cl– ions.
Chemical composition analysis and layer-charge changes of the samples
Table 4 presents the chemical composition of the samples. The K2O content in the optimally converted sample (XJP-V) is significantly reduced. This suggests that during the phlogopite conversion to vermiculite interlayer K+ was released from the interlayer region into the solution. Based on the data from the chemical analysis, we calculated the structural formulae and layer-charge densities for the samples based on 11O. The formulae are listed in Table 5.
Chemical composition of the samples (wt.%).

Table 4 Long description
Chemical oxide composition in weight percent is reported for two samples, XJP and XJP-V, across SiO2, MgO, Al2O3, K2O, Fe2O3, Na2O, CaO, TiO2, Cr2O3, and BaO. XJP-V has higher SiO2 at 44.49 and MgO at 24.01 than XJP at 42.78 and 21.84. K2O drops from 10.42 in XJP to 6.84 in XJP-V, the largest decrease among listed oxides. Al2O3 and Fe2O3 are very similar between samples, with Al2O3 near 14.3 to 14.5 and Fe2O3 near 7.1 to 7.22. Minor oxides are low in both samples, with Na2O at 0.14 versus 0.05 and CaO at 0.50 versus 0.08, both lower in XJP-V. TiO2 and Cr2O3 are close between samples, while BaO is lower in XJP-V at 0.21 compared with 0.43 in XJP. Values are limited to the oxides listed and do not indicate totals or measurement uncertainty.
Structural formulae of phlogopite (XJP) and vermiculite (XJP-V).

TFe3+ = the total amount of iron ions in the octahedron of phlogopite.
It is observed that: (1) the tetrahedra consist primarily of Si4+ and Al3+, the octahedra are mainly composed of Mg2+ and the interlayer domains are mainly composed of K+; and (2) as phlogopite gradually converts to vermiculite, the layer-charge density decreases.
The structural formulae of the samples are as follows:
 \begin{align*}
&{\text{XJP:}} \\
& {\left( {{{\text{K}}_{{\text{0}}{\text{.893}}}}{\text{C}}{{\text{a}}_{{\text{0}}{\text{.036}}}}{\text{N}}{{\text{a}}_{{\text{0}}{\text{.018}}}}{\text{B}}{{\text{a}}_{{\text{0}}{\text{.011}}}}} \right)_{{\text{0}}{\text{.958}}}}{\text{ \times }}{\left( {{{\text{H}}_{\text{2}}}{\text{O}}} \right)_{\text{n}}} \\ &\quad\times\left\{ {{\left( {{\text{M}}{{\text{g}}_{{\text{2}}{\text{.188}}}}{\text{F}}{{\text{e}}_{{\text{0}}{\text{.359}}}}{\text{T}}{{\text{i}}_{{\text{0}}{\text{.148}}}}{\text{C}}{{\text{r}}_{{\text{0}}{\text{.014}}}}{\text{A}}{{\text{l}}_{{\text{0}}{\text{.010}}}}} \right)}_{{\text{2}}{\text{.719}}}} \right.\\ &\quad\times \left[ {{{\left( {{\text{S}}{{\text{i}}_{{\text{2}}{\text{.875}}}}{\text{A}}{{\text{l}}_{{\text{1}}{\text{.125}}}}} \right)}_{{\text{4}}{\text{.000}}}}{{\text{O}}_{{\text{10}}}}} \right]{{\left( {{\text{OH}}} \right)}_{\text{2}}} \Big\} \\
\end{align*}
 \begin{align*}{\text{XJP - V: }}\quad&{\left( {{{\text{K}}_{{\text{0}}{\text{.571}}}}{\text{C}}{{\text{a}}_{{\text{0}}{\text{.006}}}}{\text{N}}{{\text{a}}_{{\text{0}}{\text{.006}}}}{\text{B}}{{\text{a}}_{{\text{0}}{\text{.005}}}}} \right)_{{\text{0}}{\text{.588}}}}{\text{ \times }}{\left( {{{\text{H}}_{\text{2}}}{\text{O}}} \right)_{\text{n}}}\\ &\quad\times \Big\{ {{\left( {{\text{M}}{{\text{g}}_{{\text{2}}{\text{.345}}}}{\text{F}}{{\text{e}}_{{\text{0}}{\text{.356}}}}{\text{T}}{{\text{i}}_{{\text{0}}{\text{.146}}}}{\text{A}}{{\text{l}}_{{\text{0}}{\text{.033}}}}{\text{C}}{{\text{r}}_{{\text{0}}{\text{.016}}}}} \right)}_{{\text{2}}{\text{.896}}}}\\ &\quad\times \left[ {{{\left( {{\text{S}}{{\text{i}}_{{\text{2}}{\text{.914}}}}{\text{A}}{{\text{l}}_{{\text{1}}{\text{.086}}}}} \right)}_{{\text{4}}{\text{.000}}}}{{\text{O}}_{{\text{10}}}}} \right]{{\left( {{\text{OH}}} \right)}_{\text{2}}} \Big\}\end{align*}
Surface functional groups of phlogopite treated with oxalic acid solutions of various anionic types
Figure 6 shows the effects of anion type on the surface functional groups of transformed products. The absorption band near 3369 cm–1 is attributed to the stretching vibrations of adsorbed water, and the band near 1650 cm–1 is attributed to the bending vibration of interlayer water molecules.
Effects of anion type on the surface functional groups of the transformed products. FTIR spectra of the transformed products in various anionic solutions: (a) MgSO4 + H2O2; (b) MgCl2 + H2O2. (c–f) Enlargements of selected sections of (a) and (b).

The absorption bands of the transformed products in the two anionic solutions were gradually increased with increasing transformation degree of phlogopite (Fig. 6c, d), indicating that the content of adsorbed water and interlayer water molecules on the sample surface also gradually increased with increasing transformation degree of phlogopite into vermiculite. The band at 945 cm–1 is attributed to Si–O–Si stretching, while the band near 659 cm–1 is due to R–O–Si stretching (R = Fe, Al, Mg; Ran et al., Reference Ran, Cao and Zhang1999; Rong et al., Reference Rong, Jian, Ping, Yuzhong, Yelin and Qi2017). After SO42– treatment, the absorption bands of the sample become weaker, indicating that SO42– disrupts the structure of phlogopite (Fig. 6e, f).
Thermal properties of the vermiculitization products (HLMSP-V-pH1 and HYMCP-V-pH1)
Figure 7 displays the TG-DSC curves of the samples. Phlogopite undergoes continuous mass loss after 900°C, whereas the transformed samples displayed continuous mass loss after 500°C, indicating their inferior thermal stability compared to phlogopite.
TG-DSC curves of the samples: (a) HCMCP-V-pH1, (b) HCMSP-V-pH1 and (c) XJP.

Figure 7 Long description
The first plot shows adsorption capacity (q subscript t in mg g superscript -1) over time (minutes). The x-axis ranges from 0 to 450 minutes and the y-axis ranges from 0 to 10 mg g superscript -1. Two models, PFO and PSO, are represented by black and red dashed lines, respectively. Data points for chabazite-rich tuff are in blue and chabazite-phillipsite-rich tuff are in orange. Adsorption capacity increases rapidly initially, then plateaus around 10 mg g superscript -1. The second plot shows removal efficiency (R subscript E in percent) versus solid to liquid ratio (S/L ratio in percent). The x-axis ranges from 0 to 60 percent and the y-axis ranges from 0 to 100 percent. Both tuff types show increasing removal efficiency with higher S/L ratios. The third plot shows adsorption capacity (q subscript e in mg g superscript -1) versus S/L ratio (percent). The x-axis ranges from 0 to 60 percent and the y-axis ranges from 0 to 12 mg g superscript -1. Adsorption capacity decreases as S/L ratio increases for both tuff types. The plots compare the performance of two models and two sample types, highlighting differences in adsorption behavior and efficiency.
All samples exhibited an exothermic reaction above 1000°C due to enstatite formation at high temperature (Niu et al., Reference Niu, Kinnunen, Sreenivasan, Adesanya and Illikainen2020).
Table 6 presents the thermal analysis data for the samples. The transformed samples exhibited two endothermic valleys at 180°C and 480°C that are absent from phlogopite, which suggests the entrance of Mg2+ into the phlogopite interlayer. The ionic potentials of different cations can determine the potency of the electrostatic attraction between oppositely charged ions. Water molecules are polar and are adsorbed by interlayer cations through electrostatic attraction.
Thermal analysis data of the samples.

Table 6 Long description
Thermal analysis results compare three samples by dehydration temperatures, overall mass loss, and dehydroxylation temperature. XJP shows a single dehydration event at 95 degrees C, very low mass loss at 0.61 percent, and dehydroxylation at 930 degrees C. HCMCP-V-pH1 has three dehydration steps at 61, 182, and 486 degrees C, with mass loss of 12.97 percent and dehydroxylation at 797 degrees C. HCMSP-V-pH1 also has three dehydration steps at 87, 183, and 471 degrees C, the highest mass loss at 21.94 percent, and dehydroxylation at 790 degrees C. Both modified samples lose substantially more mass than XJP and dehydroxylate at lower temperatures, suggesting greater volatile or hydroxyl content. Dehydration step temperatures for the two modified samples are similar, while their mass losses differ markedly.
Table 7 displays the respective ionic potentials of K+ and Mg2+. Mg2+ has a higher ionic potential, which leads to stronger binding forces with water molecules. Consequently, water molecules bound to Mg2+ are released at a higher temperature.
Ionic radii and ionic potentials of various cations.

Table 7 Long description
Interlayer cations are compared by ionic radius in nanometers and ionic potential. K plus has an ionic radius of 0.133 nm and an ionic potential of 7.52. Mg2 plus has a smaller ionic radius of 0.065 nm but a much higher ionic potential of 30.77. Across these two entries, smaller ionic radius corresponds to higher ionic potential. Values are limited to two cations, so the apparent trend may not hold for other ions.
Effects of anions on the structure of the transformed products
Mg2+ ions react with water molecules to produce the [Mg(H2O)6]2+ complex, resulting in the expansion of phlogopite interlayers and the weakening of interlayer bonding (Van Khai et al., Reference Van Khai, Gil Na, Sub Kwak, Jung Kwon, Ham, Bo Shim and Woo Kim2013).
Figure 8 presents SEM images of the transformed products. The HCMSP-V-pH1 sample (Fig. 8a) shows significant edge dissolution and a loose, flaky structure. This suggests that a high quantity of water molecules infiltrated the interlayer of the sample when a large amount of Mg2+ entered, leading to the expansion of the phlogopite’s interlayer space. Figure 8b displays smooth edges with limited corrosion, indicating that SO42– caused more significant alteration to the phlogopite structure.
SEM images of the conversion products of phlogopite: (a) HCMSP-V-pH1 and (b) HCMCP-V-pH1.

Effects of reaction time on the transformed products
In natural environments, the transformation of phlogopite to vermiculite is mediated by ambient conditions. The process is initiated by the oxidation of structural Fe2+ by atmospheric or groundwater agents, which reduces the layer-charge density. Concurrently, interlayer K+ is exchanged with external cations and water molecules, ultimately leading to vermiculite formation through prolonged weathering (Walker, Reference Walker1950; Harraz & Hamdy, Reference Harraz and Hamdy2010). Under laboratory conditions, the conversion of phlogopite to vermiculite can be expedited by altering the temperature, ion concentration or reaction solution type.
Figure 9 displays the XRD traces of the transformation products at various reaction times. The transformation of phlogopite into vermiculite increases with reaction time (Fig.9a,b). In the SO42– solution, phlogopite transforms after 2 h of reaction, whereas in the Cl– solution there is significantly less transformation of phlogopite over reaction times of 2–4 h. The clear difference in phlogopite conversion between the sulfate and chloride solutions only occurs within the reaction time window of 2–4 h.
XRD traces of the transformed products at various reaction times: (a) Na2SO4 + H2O2 and (b) NaCl + H2O2.

Figure 9 Long description
Five stacked X ray diffraction line traces labeled HCNSP V T2, HCNSP V T4, HCNSP V T6, HCNSP V T8, and HCNSP V T10. The x axis is labeled degree 2 theta, ranging from 0 to 60 with labeled ticks at 10, 20, 30, 40, 50, and 60. The y axis is labeled Intensity, a u. A legend at the top shows a club symbol labeled Phlogopite and a diamond symbol labeled Vermiculite. The T2 trace shows two tall peaks close to the 10 tick, and a distinct peak between 20 and 30. The T4 trace shows two tall peaks close to the 10 tick and a distinct peak between 20 and 30. The T6 trace shows two tall peaks close to the 10 tick and a distinct peak between 20 and 30. The T8 trace shows two tall peaks close to the 10 tick and a distinct peak between 20 and 30, with a club marker placed near a low angle peak. The T10 trace shows two tall peaks close to the 10 tick and a distinct peak between 20 and 30. Across T2 to T10, the main peak positions appear at similar degree 2 theta locations, with multiple smaller peaks extending through about 60. Five stacked X ray diffraction line traces labeled HCNCP V T2, HCNCP V T4, HCNCP V T6, HCNCP V T8, and HCNCP V T10. The x axis is labeled degree 2 theta, ranging from 0 to 60 with labeled ticks at 10, 20, 30, 40, 50, and 60. The y axis is labeled Intensity, a u. A legend at the top shows a club symbol labeled Phlogopite and a diamond symbol labeled Vermiculite. The T2 trace shows a tall peak close to the 10 tick and a distinct peak between 20 and 30. The T4 trace shows a tall peak close to the 10 tick and a distinct peak between 20 and 30. The T6 trace shows a tall peak close to the 10 tick and a distinct peak between 20 and 30. The T8 trace shows a tall peak close to the 10 tick and a distinct peak between 20 and 30, with a diamond marker near a low angle peak and a club marker near another low angle peak. The T10 trace shows a tall peak close to the 10 tick and a distinct peak between 20 and 30. Across T2 to T10, the main peak positions appear at similar degree 2 theta locations, with multiple smaller peaks extending through about 60.
Effects of reaction time on the release of structural ions
Oxidation of Fe2+ in the phlogopite octahedra results in a charge imbalance within the structure. The release of tetrahedral, octahedral and interlayer cations is necessary to maintain the charge balance (Sasaki & Konno, Reference Sasaki and Konno2000). Figure 10 shows the release patterns of Si4+, Fe, Al3+ and Mg2+ ions in solution at various reaction times. The release of several of these ions gradually increases over time. However, solutions containing SO42– released a greater amount of ions compared to those containing Cl–. Significant differences in the release of Fe, Al3+ and Mg2+ were observed with increasing reaction time. This can be attributed to the intensifying destruction of phlogopite’s tetrahedra and octahedra by SO42– over time, resulting in the increased release of Fe, Al3+ and Mg2+.
Release curves of Si4+, Fe, Al3+ and Mg2+ ions in phlogopite structures at various reaction times: (a) Si4+ ions, (b) Fe ions, (c) Al3+ ions and (d) Mg2+ ions.

Figure 10 Long description
A line graph with the horizontal axis labeled, Time (h), with tick labels 2, 3, 4, 5, 6, 7, 8, 9, 10. The vertical axis is labeled, Si4 plus leaching amount (mg L superscript minus 1), with tick labels 40, 50, 60, 70, 80, 90, 100, 110. Legend entries are Na2SO4 and NaCl. Na2SO4 series coordinate pairs: (2, 55), (4, 68), (6, 92), (8, 101), (10, 108). NaCl series coordinate pairs: (2, 42), (4, 58), (6, 87), (8, 89), (10, 105). The image B showing a line graph with the horizontal axis labeled, Time (h), with tick labels 2, 3, 4, 5, 6, 7, 8, 9, 10. The vertical axis is labeled, Fe leaching amount (mg L superscript minus 1), with tick labels 10, 20, 30, 40, 50. Legend entries are Na2SO4 and NaCl. Na2SO4 series coordinate pairs: (2, 18), (4, 32), (6, 45), (8, 47), (10, 51). NaCl series coordinate pairs: (2, 11), (4, 15), (6, 18), (8, 24), (10, 31). The image C showing a line graph with the horizontal axis labeled, Time (h), with tick labels 2, 3, 4, 5, 6, 7, 8, 9, 10. The vertical axis is labeled, Al3 plus leaching amount (mg L superscript minus 1), with tick labels 20, 40, 60, 80, 100, 120. Legend entries are Na2SO4 and NaCl. Na2SO4 series coordinate pairs: (2, 38), (4, 66), (6, 92), (8, 104), (10, 105). NaCl series coordinate pairs: (2, 18), (4, 30), (6, 33), (8, 44), (10, 57). The image D showing a line graph with the horizontal axis labeled, Time (h), with tick labels 2, 3, 4, 5, 6, 7, 8, 9, 10. The vertical axis is labeled, Mg2 plus leaching amount (mg L superscript minus 1), with tick labels 20, 40, 60, 80, 100, 120, 140, 160. Legend entries are Na2SO4 and NaCl. Na2SO4 series coordinate pairs: (2, 40), (4, 85), (6, 118), (8, 150), (10, 152). NaCl series coordinate pairs: (2, 25), (4, 40), (6, 48), (8, 68), (10, 85).
Correlation between the release of K+ and the release of Si4+, Al3+, Fe and Mg2+
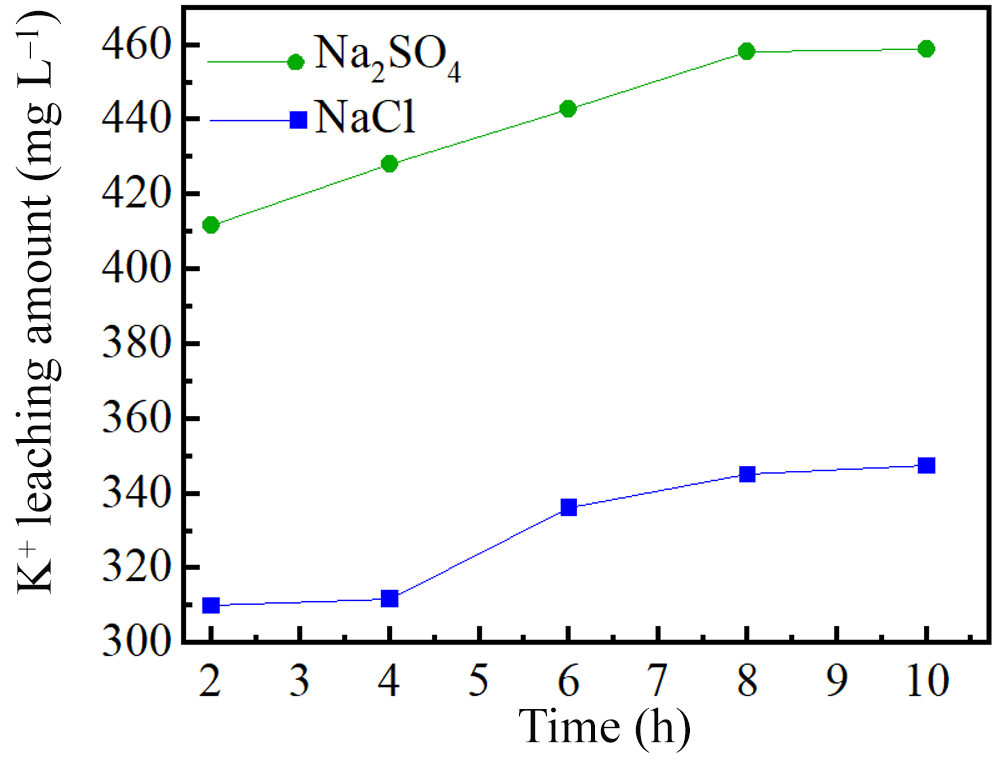
Figure 11 shows the kinetics of K+ release over time. The cumulative release of K+ increased with reaction duration in both solutions, although it was consistently higher in the Na2SO4 system than in the NaCl system. This indicates that SO42– increases the vermiculitization of phlogopite more effectively than Cl– under equivalent conditions.
Release curves of K+ ions in phlogopite structures at various reaction times.

Correlation analysis using Pearson’s coefficient (r) revealed strong positive correlations (r ≥ 0.8) between K+ release and the release of Si4+, Al3+, Fe and Mg2+ in both solutions (Table 8), demonstrating that the extent of K+ release governs the leaching of other structural ions.
Correlation coefficients (r) between the release of K+ and the release of Si4+, Al3+, Fe and Mg2+.

K1 = K+ in NaCl solution; K2 = K+ in NaSO4 solution.
Mechanism of action of the anions
The increased efficacy of SO42–-containing solutions in promoting phlogopite vermiculitization is controlled by the solution’s ionic strength. Previous studies have indicated that although H+ is preferentially adsorbed onto clay surfaces, anions such as NO3– and Cl– exhibit weaker adsorption, a behaviour that is modulated by ionic strength (Ma et al., Reference Ma, Sun, Peng and Zhang2021; Huang et al., Reference Huang, Luo, Sun, Peng and Chen2023). Nevertheless, a clay mineral’s surface activity is influenced by the solution’s ionic strength. Increasing the ionic strength of a solution increases the adsorption of anions in the solution by clay minerals (Gu et al., Reference Gu, Evans and Barabash2010; Hao et al., Reference Hao, Flynn, Kashiwabara, Alam, Bandara and Swaren2019). The ionic strength (I) of the solution can be calculated using Equation 1:
 \begin{equation}I = {\text{ }}\frac{1}{2}{\mathop\sum}{C_{x}}.Z_{x^{2}}\end{equation}
where x is the ion in the solution, Cx is the concentration of x and Zx is the charge of x.
The ionic strengths of various anion solutions are given in Table 9.
Ionic strengths (I) of various anionic solutions.

According to Table 9, the solution with SO42– has a higher ionic strength, leading to increased SO42– adsorption on the surface of phlogopite and greater capturing free hydrogen ions in the aqueous system to form bisulfate (HSO4−) on the phlogopite surface. This process accelerates the phlogopite structure’s degradation.
Figure 12 illustrates the anionic disruption of the phlogopite structure at various pH levels. There is no significant difference in the effects of both anions on the conversion of phlogopite to vermiculite, nor on the extent of structural damage when the solution pH is neutral (process 1, Fig. 12). This inference is supported by the XRD, FTIR and SEM analyses. At lower pH levels of the solution, SO42– inflicts greater disruption to the tetrahedral and octahedral sheets of phlogopite. This results in the release of more ions from the phlogopite structure or exchange with external ions, thus promoting the transformation of phlogopite to vermiculite. Based on the analysis presented earlier, it is evident that the solution containing SO42– serves as a stronger catalyst for the conversion of phlogopite to vermiculite for two reasons. First, SO42– causes more severe disruption of the tetrahedral and octahedral sheets of minerals compared to Cl–, leading to the release of more ions (Mg2+, Fe, Al3+) from the phlogopite’s structure. Second, while most chloride salts are soluble, the presence of SO42– in a solution results in the formation of precipitates such as BaSO4 and CaSO4. Both of these factors enhance ion dissolution and exchange within phlogopite’s structure, thus promoting phlogopite’s transformation to vermiculite.
Process diagram of the destruction of the structure of phlogopite by anions at various pH values.

Figure 12 Long description
The diagram illustrates the structural disruption of phlogopite by anions at different pH levels. On the left, the initial structure of phlogopite is shown with a distance of 10 angstroms between layers. This structure includes potassium ions, iron ions, and magnesium ions, represented by blue, yellow, and grey circles, respectively. Silicon tetrahedrons, aluminum tetrahedrons, and octahedrons are depicted as green triangles, pink triangles, and blue squares. Process 1, indicated by a green arrow, leads to the transformation of the structure. On the right, the structure is shown after the introduction of sulfate and chloride anions, represented by green arrows labeled SO4 superscript 2 minus and Cl superscript minus. The distance between layers increases to 14 angstroms. The presence of water molecules and magnesium hexaaqua ions is indicated by red and grey symbols. The diagram highlights the role of anions in altering the phlogopite structure, promoting the transformation to vermiculite.
Mechanism of phlogopite vermiculitization
Figure 13 shows the conversion process of phlogopite in oxalic acid solution when the external cation is Mg2+. Under acidic conditions, H2O2 oxidizes octahedral Fe2+ of phlogopite, modifying the layer-charge density. To maintain the balance of charge, excess cations will be released from the structure. Oxidation of Fe2+ to Fe3+ increases the positive structural charge and disturbs the layer-charge balance. In addition to the expulsion of interlayer K+, the synchronous release of structural cations (Al3+, Mg2+, Fe3+, etc.) from the tetrahedral and octahedral sheets also serves as a critical pathway for rebalancing the layer charge. Hydrogen ions (H+) attack the Si–O tetrahedra and Mg–Al octahedra via protonation, causing lattice-bond cleavage and cation release. This process directly reduces the net negative charge density of the structure, weakens the electrostatic binding of interlayer K+ and further promotes cation exchange and interlayer expansion. Therefore, the layer-charge balance during phlogopite vermiculitization is achieved cooperatively by interlayer K+ exchange and structural cation release, which together accelerate the mineral-phase transformation.
Conversion process of phlogopite to vermiculite in oxalic acid solution.

Figure 13 Long description
The diagram illustrates the conversion process of phlogopite to vermiculite. Initially, phlogopite is shown with a structure involving various ions, including potassium, silicon, magnesium, oxygen, aluminum, and iron. The process begins with oxidation, where hydrogen ions and hydrogen peroxide convert iron two plus to iron three plus. This is followed by magnesium ion exchange, leading to the elimination of potassium ions and structural failure. The diagram indicates the formation of a complex with magnesium ions and water. Ion leaching occurs, eliminating iron two plus, iron three plus, and aluminum three plus ions. The final step involves the reaction of iron three plus and aluminum three plus with oxalate ions, forming complexes that result in the transformation to vermiculite. The diagram uses arrows to show the direction of each process and includes labels for each step, such as 'oxidation', 'exchange', 'ion leaching', and 'structural failure'.
Mg2+ is exchanged with K+ of phlogopite, and water molecules are introduced into the interlayer of phlogopite, which increases the spacing between the layers. The interlayer domain of phlogopite is a functional structural space that serves not only as an ‘ion reservoir’ for charge balance but also as a ‘reactive centre’ controlling the sheet-like structure of mica minerals and mediating their alteration and transformation. With decreasing solution pH, the tetrahedral and octahedral sheets of phlogopite are gradually destroyed. The released cations (Al3+, Fe3+) are complexed with organic acids to form metal–organic complexes, which further lead to the release of ions and to changes to the charge of the structure. Hence, structural ions of phlogopite are released or exchanged with external ions, modifying the structure of phlogopite and finally promoting the transformation of phlogopite into vermiculite.
Conclusions
The vermiculitization of phlogopite under acidic oxidizing conditions is critically dependent on the type of anion present, with SO42– exhibiting a significantly stronger promoting effect than Cl–. Due to its higher ionic strength, SO42– adsorbs more strongly onto phlogopite, accelerating the destruction of tetrahedral/octahedral sheets and increasing the release of Al3+, Fe and Mg2+. H2O2 oxidizes Fe2+ to Fe3+ via an oxidation-driven charge reduction, thereby lowering the layer charge and forcing the expulsion of excess cations, which facilitates K+ exchange and vermiculite formation. The SO42–-treated products contain a greater amount of adsorbed and interlayer water, indicating a higher degree of vermiculitization.
This work identifies ionic strength and anion-specific adsorption as key controlling factors of phlogopite vermiculitization, offering insights into element cycling and secondary mineral formation in surface environments.
Financial support
This work is supported by the Sichuan Science and Technology Program under the project 2025ZNSFSC0437 and the National Natural Science Foundation of China under the project 42002039.
Competing interests
The authors affirm that they have no known monetary conflicts of interest or close personal ties that could have an impact on the work presented here.