Introduction
The visual evoked potential (VEP) is used as a clinical diagnostic tool for diseases of the visual system and brain (Brigell, Reference Brigell, Fishman, Birch, Holder and Brigell2001). It represents the mass sum of electrical signals recorded from the scalp in response to a visual stimulus (Regan, Reference Regan1989). Development of the multifocal technique (Sutter, Reference Sutter1991; Sutter & Tran, Reference Sutter and Tran1992) and its application to VEP recordings (Baseler et al., Reference Baseler, Sutter, Klein and Carney1994) have improved clinical diagnostic capabilities beyond conventional VEP techniques primarily because of the increased spatial resolution that can now be achieved for detecting abnormalities within the visual field. To date, the multifocal visual evoked potential (mfVEP) has been applied primarily as an objective tool for topographic assessment of visual function in glaucoma (Klistorner et al., Reference Klistorner, Graham, Grigg and Billson1998; Goldberg et al., Reference Goldberg, Graham and Klistorner2002; Hood & Greenstein, Reference Hood and Greenstein2003; Hood et al., Reference Hood, Thienprasiddhi, Greenstein, Winn, Ohri, Liebmann and Ritch2004; Graham et al., Reference Graham, Klistorner and Goldberg2005; Fortune et al., Reference Fortune, Demirel, Zhang, Hood, Patterson, Jamil, Mansberger, Cioffi and Johnson2007) but has also been used to study other neuro-ophthalmic diseases (Hood et al., Reference Hood, Odel and Zhang2000a; Fraser et al., Reference Fraser, Klistorner, Graham, Garrick, Billson and Grigg2006).
Refinement of recording methods and analysis, including multiple channel recordings (Klistorner & Graham, Reference Klistorner and Graham2000; Hood et al., Reference Hood, Zhang, Hong and Chen2002), interocular analyses (Graham et al., Reference Graham, Klistorner, Grigg and Billson2000; Hood et al., Reference Hood, Zhang, Greenstein, Kangovi, Odel, Liebmann and Ritch2000b), and signal-to-noise ratio (SNR) or noise-scaled amplitude analyses (Klistorner & Graham, Reference Klistorner and Graham2001; Zhang et al., Reference Zhang, Hood, Chen and Hong2002), have helped improve the clinical diagnostic accuracy of the mfVEP. Ultimately, however, the diagnostic power of the mfVEP will depend in large part on its SNR as demonstrated by Hood and colleagues (Hood & Greenstein, Reference Hood and Greenstein2003; Hood et al., Reference Hood, Zhang and Winn2003; Zhang & Hood, Reference Zhang and Hood2004a). Therefore, methods to enhance the SNR of mfVEP responses are clinically relevant. Examples of such methods may include analytical approaches that make use of additional information present in mfVEP responses (Zhang & Hood, Reference Zhang and Hood2004a; Maddess et al., Reference Maddess, James, Ruseckaite and Bowman2006) and/or alternative stimuli that might evoke stronger responses (James, Reference James2003; James et al., Reference James, Ruseckaite and Maddess2005b; Maddess et al., Reference Maddess, James and Bowman2005). Indeed, initial reports suggest that both approaches are effective (Zhang & Hood, Reference Zhang and Hood2004a; Ruseckaite et al., Reference Ruseckaite, Maddess, Danta, Lueck and James2005).
Several studies by James and colleagues (James, Reference James2003; James et al., Reference James, Ruseckaite and Maddess2005b; Maddess et al., Reference Maddess, James and Bowman2005) suggest that the SNR of mfVEP responses can be increased by 60–90% if a stimulus consisting of temporally sparse contrast pulses is used instead of the more commonly used contrast reversal stimulus. As mentioned, such an improvement would be predicted to enhance diagnostic accuracy for an otherwise similar recording duration (Hood & Greenstein, Reference Hood and Greenstein2003) or allow for shorter duration recordings to be used without sacrificing diagnostic performance (James, Reference James2003; James et al., Reference James, Ruseckaite and Maddess2005b; Maddess et al., Reference Maddess, James and Bowman2005). Other investigators have also found that an alternative to the commonly used pattern-reversal stimulus, specifically a pattern-onset stimulus, enhanced the mfVEP SNR, but this effect was limited to the central visual field and came at the cost of decreased peripheral SNR (Hoffmann et al., Reference Hoffmann, Straube and Bach2003).
Therefore, the purpose of the present study was to compare standard mfVEP pattern-reversal responses with those produced by pattern-onset, pattern-offset, and pulsed pattern stimuli. Our primary focus was comparison of SNR across the various stimuli, specifically to test the hypothesis that sparse pulse stimuli provide increased mfVEP SNR; our secondary focus was to compare response waveform morphology across stimulus types.
Materials and methods
Subjects
Five individuals with normal vision participated in this study (two female and three male). Their ages were 30, 36, 39, 43, and 45 years. Each was fully informed about the potential risks and benefits of the study and provided voluntary consent to participate. All procedures followed the tenets of the Declaration of Helsinki and were preapproved by the Legacy Health System institutional review board for the protection of human subjects. All subjects met the following inclusion criteria: good visual acuity (≥20/20), normal standard achromatic increment threshold visual fields (Humphrey SITA 24-2 results within normal 95% confidence limits for both mean deviation and pattern standard deviation, and glaucoma hemifield test results “Within Normal Limits”), intraocular pressures <22 mm Hg, and normal ocular fundi. Each subject chose which eye would be tested throughout the study.
Data acquisition
mfVEPs were obtained using VERIS (v4; Electro-Diagnostic Imaging, San Mateo, CA). Three channels were recorded using gold disc electrodes (Grass Model F-E5GH; Astro-Med, Inc., West Warwick, RI). For the vertical midline channel, electrodes were placed 4 cm above the inion (active) and at the inion (reference). For the left and right “oblique” channels, the active electrodes were placed 1 cm above the inion and 4 cm to the left or right, respectively, of the vertical midline; each of these active sites was referenced to the electrode at the inion. The left earlobe served as ground for all three channels. In addition to the three channels recorded, data for three other channels were derived from the differences between various electrode pairs as previously described (Hood et al., Reference Hood, Zhang, Hong and Chen2002; Hood & Greenstein, Reference Hood and Greenstein2003).
In preparation for recording, the skin at each electrode site was scrubbed with Nuprep (D.O. Weaver & Co., Aurora, CO) on a cotton-tipped wooden swab. Electrodes were fixed in position with EC2 conductive cream (Astro-Med, Inc.) and secured with Coban™ wrap (3M, St Paul, MN). Electrode impedance was maintained below 5 kΩ in all cases and was usually below 2 kΩ. Signals were amplified (Grass Model 12), band-pass filtered from 3 to 100 Hz (1/2 amplitude), and sampled at 1200 Hz (i.e., in 0.83 ms bins).
Stimulus: Spatial geometry
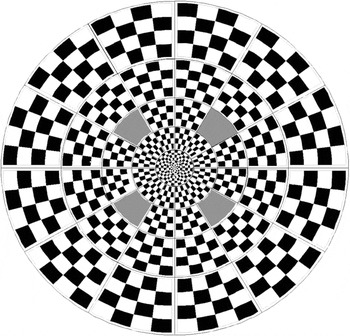
The spatial geometry of the stimulus pattern was constant across all experiments. The pattern was one of the standard stimulus options from the VERIS software package (“Dart Board 60 With Pattern”; Fig. 1). It was displayed on a 21-inch monochrome monitor with a 75 Hz refresh rate (model VB 21300 GLS; Siemens AG, Munich, Germany). It had a total diameter of 44.5 deg and consisted of 60 individual sectors. Each sector contained 16 checks, 8 white (200 cd/m2), and 8 black (<1 cd/m2) and thus had a Michelson contrast of ~99%. Stimulus luminance was calibrated using a spot photometer (SpectraScan PR-650; Photo Research, Inc., Chatsworth, CA). In all cases, the display was viewed through a natural pupil with optimal refractive correction in place.
Stimulus geometry, 60-sector dartboard. The four gray-shaded sectors indicate locations isolated for the spatial mask experiment.

Stimulus: Temporal modulation and experimental design
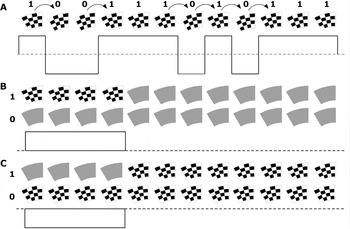
For all recordings, the contrast polarity of each stimulus sector was temporally modulated according to a binary pseudorandom m-sequence automatically chosen by VERIS, given the following predetermined conditions. For the standard reversal stimulus, the sequence had 215-1 total steps that required 7.5 min to complete. Transitions between steps were synchronized to the video frame rate of 75 Hz, so the minimum period between contrast reversals was 13.33 ms. Fig. 2A shows 12 steps of a hypothetical reversal sequence in which there are six reversals (indicated by the curved arrows above the checkerboard pattern) between the two contrast states (indicated by 1s and 0s). The horizontal dashed line below the checkerboard sequence represents the space- and time-averaged luminance level (100 cd/m2). Reversals between the two spatial contrast phases (binary stimulus polarities) are also represented by the upward and downward crossings of the dashed line.
Schematic of temporal sequence for stimulus examples. In these three hypothetical examples, only 12 frames are shown for a contrast reversal sequence (A), four-frame contrast “onset” (B), and “offset” (C) stimuli. In actuality, there were 32 frames per m-step for all onset and offset duration experiments. Temporal modulation between the two states of each stimulus (identified above as 1 and 0) was determined by an m-sequence.

The aims of the first experiment were to compare pattern-reversal responses with responses to contrast steps, that is, pattern onset–offset stimuli, and to evaluate the effect of stimulus duration. All recordings in the series of onset–offset stimuli were m-sequences with 32 frames per m-step and 210 total steps (thus, also requiring 7.5 min total recording time to complete); but the duration of the contrast step varied such that it was 1, 2, 4, 8, 12, or 16 of the 32 frames. The schematic shown in Fig. 2B represents a stimulus that has a contrast step with a duration of four frames (note that this example shows only 12 total frames of the m-sequence step, not 32). Binary modulation for this stimulus was between the m-sequence step indicated by a “1” and a phase that remained at the mean luminance level (100 cd/m2) for all 32 frames (indicated by a “0”). “Onset” and “offset” responses are separated progressively as the duration of the contrast step increases.
The second experiment was designed to evaluate whether the polarity of the change in contrast determines the shape and strength of the mfVEP response or whether the response depends more directly on the change itself, irrespective of polarity. For this experiment, the same series descried above was “inverted” so that adapting contrast remained high and the stimulus step began with a decrement to zero contrast (uniform mean luminance level). Fig. 2C shows an example of the inverted version of the stimulus shown in Fig. 2B. The adapting level of contrast is maintained at a higher level for this stimulus because binary modulation was between the m-sequence step indicated by the “1” and a phase that remained at high contrast for all 32 frames (indicated by the “0”).
The aim of the third experiment was to test the hypothesis that mfVEP SNR is higher for temporally sparse “pulses” of pattern contrast than for standard pattern-reversal stimuli. In this experiment, a pattern pulse was defined as a short-duration contrast increment; the pulse duration chosen was two frames (26.6 ms) instead of a single frame because the SNR of the former was always greater (see Results, Experiment 1). The effect of temporal sparseness was studied by varying the total length of the m-sequence step that contained the two-frame pulse. The SNR was compared across five different sparseness rates, as well as against that of the standard reversal stimulus. The five sparse pulse stimuli, respectively, had 16, 20, 24, 28, or 32 frames per m-sequence step. All had 211-1 total steps, which means that the “2-in-16” stimulus also required 7.5 min to complete (the others proportionally longer). Thus, the clinical significance of relative SNR differences for this stimulus can be assessed by direct comparison with the standard reversal stimulus.
The aim of the fourth experiment was to test the hypothesis that mfVEP SNR is higher for spatially sparse stimuli. For this experiment, 4 of the 60 stimulus locations, 1 from each field quadrant, were spatially isolated using a mask constructed from paper card stock. The four locations are shown in Fig. 1 and represent the 6th, 7th, 43rd, and 46th highest SNR (inferior left, inferior right, superior left, and superior right, respectively) measured in a group of 100 normal controls with the standard reversal stimulus (Fortune et al., Reference Fortune, Zhang, Hood, Demirel and Johnson2004). The ambient illumination was adjusted so that the luminance of the mask was equal to the mean luminance of the unmasked stimulus (100 cd/m2). There were four conditions total: standard pattern-reversal with and without the mask and sparse pulse stimulus (“2-in-16”) with and without the mask. For the former pair, the m-sequence had 215-1 total steps, for the latter, 211-1 total steps; thus, each required 7.5 min to complete.
For each stimulus in the four experiments described above, two separate recordings were obtained on different days. Within a single day’s session, the complete series of stimuli for a given experiment was recorded in random order.
Data analysis
Signal-to-noise ratio
SNR was calculated by two different methods (Zhang et al., Reference Zhang, Hood, Chen and Hong2002). In the first, the root mean square (RMS) amplitude of a signal window (45–150 ms) was divided by the RMS amplitude of a noise window (325–430 ms) for each local response (“nwSNR”) (Zhang et al., Reference Zhang, Hood, Chen and Hong2002). To achieve this, the data from the two recordings for each channel were exported from VERIS and then averaged. (Note, the first slice of the second-order kernel was exported for the reversal stimulus; for all other stimuli, the first-order kernel was exported.) No spatial smoothing, artifact rejection, nor any additional filtering was applied to any data. In the second method, the RMS amplitude from the sum of the two recordings was divided by the RMS amplitude from the difference of the two recordings (“2-run SNR”) (Zhang et al., Reference Zhang, Hood, Chen and Hong2002). The same window was used for calculating the 2-run SNR (45–150 ms).
The best array
SNR was calculated for the six individual channels (three recorded and three derived) (Hood et al., Reference Hood, Zhang, Hong and Chen2002). Comparisons of SNR across the various stimuli were analyzed using the data from the vertical channel alone and then also using the “best” channel array. The best array for each stimulus consisted of the response with the largest SNR among the six channels available at each stimulus location (Hood et al., Reference Hood, Zhang, Hong and Chen2002).
Statistics
Statistical analyses were performed using Prism (version 4.0; GraphPad Software, Inc., San Diego, CA). Analysis of variance (ANOVA, for repeated measures) was applied to test the significance of SNR differences across stimuli. Two-way ANOVA was used to assess between-subject and between-location effects.
Results
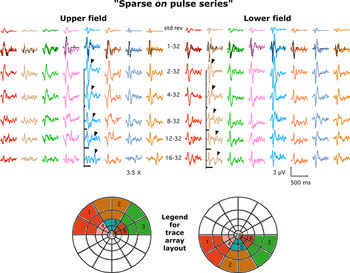
Standard mfVEP fast reversal responses are compared with onset–offset responses of varying step duration in Fig. 3. In all cases, the responses are averaged across all five subjects and across groups of neighboring stimulus locations (see legend). Reversal responses are shown in the top row, onset–offset responses in subsequent rows. The duration of the contrast onset step (n frames) is indicated by the first number in the center column and by the length of the black bars. There were two primary observations: (1) pattern onset–offset responses were ~3.5 times larger than reversal responses and (2) they had a similar shape and timing, regardless of onset duration. To enable direct comparison, the reversal responses are scaled up by a factor of 3.5× and displayed again in the second row as black records. Once scaled, they are nearly identical in shape and timing to the one-frame onset step responses. The arrowheads highlight the offset response features, which have progressively longer implicit times that increase proportionally with step duration. For the longer duration steps, the offset response feature was separated from the onset response so that they did not overlap. Across most of the stimulus field, this offset response feature was notably smaller than the response to the onset of the contrast step.
(Color online) Responses averaged across locations and across all five subjects (see color- and number-coded legend below, legend numbers refer to column in grid). The duration of onset pulse (n frames) is indicated by the first number in the center column and by the length of the black bars. Reversal responses are scaled (3.5×, black records) for comparison with one-frame onset. Arrowheads highlight offset response feature.

We initially hypothesized that the offset feature might be less robust not because of its polarity per se but rather because the adapting level of contrast was low for this series of onset–offset stimuli (the contrast steps were generally short relative to the duration of each m-sequence step, and during each m-sequence step, there is an equal probability of either the contrast step or the null appearing so that even the “16-32” stimulus has checks “on”—i.e., high contrast—only ~25% of the total recording duration). Therefore, we recorded mfVEP responses to a series of “inverted” steps (i.e., offset–onset) with equal durations to the series presented in Fig. 3.
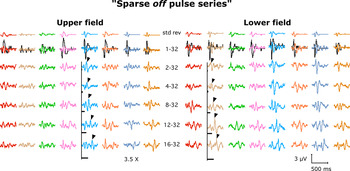
The results of the latter are presented in Fig. 4. Responses are again averaged across locations (as shown in Fig. 3) and across all five subjects. The same reversal responses from Fig. 3 are shown in the top row for reference and for comparison with offset–onset step responses, which are shown in subsequent rows. The duration of the offset step (n frames) is indicated by the first number in the center column and by the length of the black bars. As shown in Fig. 3, the reversal responses are scaled up by a factor of 3.5× and displayed again in the second row as black records for direct comparison with one-frame offset responses. There were two primary observations: (1) The offset step responses (Fig. 4) are generally smaller than onset step responses (Fig. 3), regardless of step duration, and (2) the offset step responses have a rather different shape and timing than the onset or reversal responses. The arrowheads highlight the response feature following the contrast “onset” part of the step in these inverted step stimuli; as expected, it becomes separated with longer implicit times as the offset step duration increases. Note however, that it is generally larger than the portion of the response associated with the offset (beginning) of the step.
(Color online) Responses averaged across locations (as shown in Fig. 3) and all five subjects. The duration of offset pulse (n frames) is indicated by the first number in the center column and by the length of the black bars. Reversal responses are scaled (3.5×, black records) for comparison with one-frame offset. Arrowheads highlight onset response feature.

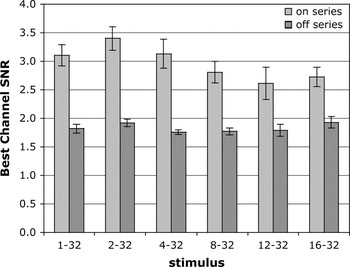
Fig. 5 shows the best channel SNR for individual responses (stimulus location and subject) versus onset–offset duration. We chose to present results of the 2-Run method of calculating SNR to avoid bias that could arise in choosing signal and noise epochs and to include response features from both aspects of the step in all cases. Nevertheless, the results were essentially identical when the nwSNR method was used. Consistent with the qualitative impressions stated above, the responses to an onset (“positive polarity,” light bars) have larger SNR than responses to an offset (“negative polarity,” dark bars; P < 0.0001, ANOVA for onset vs. offset). There was no significant interaction between the step duration and the polarity of the step (P = 0.18). The largest SNR was obtained with the two-frame onset pulse (“2-32,” compare across light bars; P < 0.0001, ANOVA for effect of step duration). The relative pattern of results was identical for channel-1 (the “vertical” channel) in isolation, but inclusion of additional channels elevated the average SNR across the field by 35% (data not shown).
Largest SNR obtained with two-frame onset pulse (compare across light bars). Onset responses have larger SNR than offset (compare light bars to dark bars).

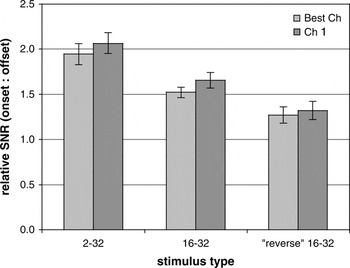
On average, across all locations and subjects, the SNR for responses to onsets was approximately two times larger than for offsets for the two-frame duration step. The left pair of bars in Fig. 6 shows this for the best channel (light bar) and for just channel-1 responses alone (dark bar). Comparing the ratio of onset to offset response SNR for the longer duration (16-frame) steps reveals that onset SNR was 50% larger than offset for best channel responses and 65% larger for channel-1 responses (middle pair of bars in Fig. 6). This was further evaluated by comparing “reverse” onset and offset responses after shifting the epoch for SNR calculation ahead by 16 frames (213 ms) for responses to 16-frame onset or offset steps. Thus, the reverse onset in this case occurred at the end of an offset step and vice versa. The right pair of bars in Fig. 6 shows that the onset response was still ~30% larger than offset even when the adaptation state was less favorable to each direction of contrast change.
By shifting the “window” for SNR calculation ahead 16 frames (213 ms), the onset:offset response ratio was also evaluated for the “inverse” adaptation state. Left pair of bars shows that SNR of onset response is ~2× larger than offset, for the best channel array (light bars) and for channel-1 alone (dark bars). Right most pair shows that the onset is still ~30% larger than offset even when adapted to higher contrast level.

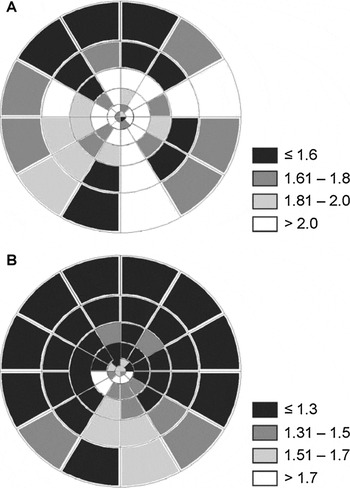
Fig. 7 shows the field topography of the onset:offset response ratio. Onset responses had larger SNR than offset responses throughout the field as shown in Fig. 7A for the 2–32 stimulus comparison. As shown in Fig. 6, this effect was generally smaller when the adaptation state was less favorable to both directions of change (the reverse onset and offset); however, Fig. 7B shows that under those latter conditions, the onset response dominance was more pronounced in the inferior field.
Topography of onset:offset response ratio. Onset responses had larger SNR than offset throughout the field (A). This effect was generally smaller under the “reverse” adaptation state (B), but then more pronounced in the inferior field.

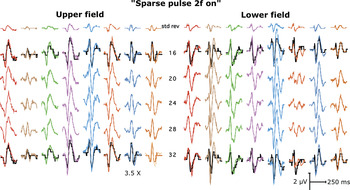
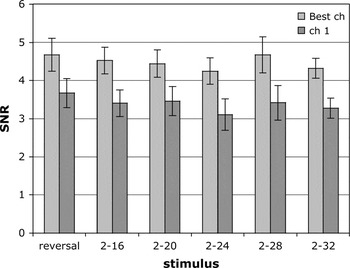
Figs. 8 and 9 show results for the third experiment, which was designed to test the hypothesis that mfVEP SNR is higher for temporally sparse pulses of pattern contrast than for standard pattern-reversal stimuli. Fig. 8 shows mfVEP responses averaged across locations and all five subjects as shown in Figs. 3 and 4. Because the results of Experiment 1 showed that a two-frame step or pulse provided the greatest SNR, it was used for all stimuli in this experiment to test the effect of relative pulse sparseness. The two-frame pulse was embedded in N frames per m-step, the latter indicated by the number in the center column of Fig. 8. Standard contrast reversal responses are shown in the top row, then also scaled up by a factor of 3.5× and shown again as black records for comparison with pulse responses “2-in-16” (second row) and “2-in-32” (bottom row). The amplitudes of pulse responses were ~3.5× larger than reversal responses but had the same waveform morphology. However, Fig. 9 shows that there were no significant SNR differences between the reversal responses and the pulse responses for the range of temporal sparseness evaluated here (P = 0.39, ANOVA, best channel; P = 0.14, ANOVA, channel-1 alone).
(Color online) The effect of temporal sparseness of pattern pulses. Responses are averaged across locations and all five subjects (as shown in Fig. 3). The two-frame pulse was embedded in n frames per m-step (indicated by the number in the center column). Reversal responses are scaled (3.5×, black records) for comparison with pulse responses to the “2-in-16” and “2-in-32” conditions.

The effect of temporal sparseness of pattern pulses. The two-frame pulse was embedded in n frames per m-step (indicated by the number after the dash describing each stimulus in x-axis labels). Best channel array, light bars; channel-1, dark bars.

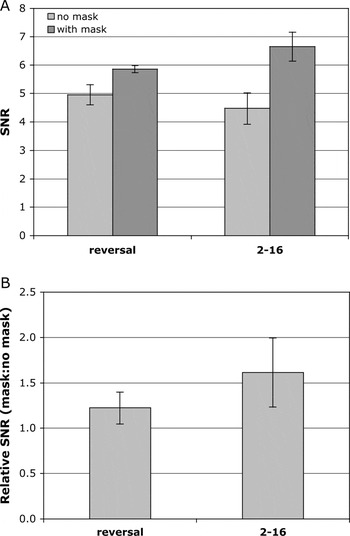
It had been suggested that the lack of an increase in SNR for temporally sparse contrast pulses might be due to the lack of spatial sparseness in the VERIS stimulus paradigm (Maddess et al., Reference Maddess, James and Bowman2005). On average, during each m-sequence step, half of the stimulus locations would present a pulse simultaneously (at least within the raster scan delay time), whereas the James et al. paradigm presents pulses that are both temporally and spatially sparse (James, Reference James2003; James et al., Reference James, Ruseckaite and Maddess2005b; Maddess et al., Reference Maddess, James and Bowman2005) Therefore, in the fourth experiment, the effect of spatial sparseness was evaluated for both contrast reversal and temporally sparse contrast pulse stimuli. Fig. 10A shows the average SNR of the four locations when the standard full dartboard stimulus was presented (“no mask,” light bars) and when the mask was used to spatially isolate these four locations (“with mask,” dark bars). Spatial isolation caused a 22% increase in SNR for the reversal stimulus (P = 0.04) and a 62% increase for the temporally sparse pulse (2-in-16) stimulus (P = 0.01), with no significant effect of subject or location in either case and no significant interactions. Fig. 10B shows the ratio of response SNR in the spatially isolated (with mask) condition versus the no-mask (full dart board) condition (i.e., the control responses obtained during same recording session; average of four locations for each subject). It is clear that the combination of temporal and spatial sparseness produces greater enhancement of mfVEP SNR (62%, on average across subjects and locations).
Average SNR of the four dartboard locations (see Fig. 1 for locations) for the standard full dartboard stimulus condition (“no mask,” light bars) and for the spatially isolated condition (“with mask,” dark bars) for both pattern-reversal and pattern-pulse (“2-16”) stimuli (A). Ratio of response SNR in the spatially isolated (mask) condition to the control (no-mask) condition for the pattern-reversal and pattern-pulse stimuli (average of four locations for each subject ± SEM) (B).

Discussion
The result of this study with the most direct clinical relevance confirms the previous findings of James, Maddess, and colleagues, which demonstrated a sizable increase in mfVEP SNR when checkerboard stimuli are presented as brief contrast pulses, sparsely distributed in time and space, rather than as frequent spatial phase reversals, the latter being the more commonly used stimulus at present. Across a series of their studies, James et al. have found that a sparse pattern-pulse stimulus provides a SNR enhancement of 60–90% above a contrast reversal stimulus (James, Reference James2003; James et al., Reference James, Ruseckaite and Maddess2005b; Maddess et al., Reference Maddess, James and Bowman2005). Our results support this general finding in that we also observed a 62% increase of SNR when contrast pulses were sparse in both time and space. However, our results indicate that spatial isolation had the more significant effect (Fig. 10). Although temporally sparse pattern pulses did indeed evoke larger mfVEP responses (by a factor of ~3.5), the longer duration required for each stimulus presentation and the concomitant reduction in the number of events that could be presented within a given recording duration limited the benefit of response averaging and thus offset any potential gain in SNR (Figs. 8 and 9).
Our failure to observe SNR enhancement for temporally sparse pulses without spatial isolation is unlikely to be due to a difference in pulse rate as our average pulse rate ranged from 1.1 to 2.3/s (for the “2-in-32” and “2-in-16” stimuli, respectively), with maximum pulse rates of 2.3 and 4.7/s, respectively. These are close to the rates that James et al. found to provide the largest benefit (1.3, 2, and 6 pulses/s) (James, Reference James2003; James et al., Reference James, Ruseckaite and Maddess2005b; Maddess et al., Reference Maddess, James and Bowman2005). Though their space-averaged luminance (7.6 or 10 cd/m2) was ~1 log unit lower than that for the present study, James et al. have reported that this difference is negligible for the SNR enhancement provided by temporally sparse pattern pulses (James et al., Reference James, Ruseckaite and Maddess2005b). James et al. have proposed that their results likely reflect the effects of contrast gain control mechanisms, which would dampen responses to pattern stimuli when the adapting contrast level is high, such as in the case of pattern-reversal stimuli where the pattern is always present throughout the recording (James, Reference James2003; James et al., Reference James, Ruseckaite and Maddess2005b; Maddess et al., Reference Maddess, James and Bowman2005). Our results suggest rather that lateral adaptation mechanisms might be the more active contributor to the differences between responses to these two types of stimulus. Maddess, James, and Bowman have discussed the potential importance of the spatial difference between the stimulus paradigms (Maddess et al., Reference Maddess, James and Bowman2005). Importantly, they have also demonstrated that the effect does not seem to operate at lower contrasts (Maddess et al., Reference Maddess, James and Bowman2005). James et al. have also presented evidence previously in abstract form that demonstrated the importance of spatial sparseness to SNR, though in those experiments they still observed an improvement of SNR that was specific to temporal sparseness (James et al., Reference James, Maddess, Goh and Winkles2005a).
We also observed that pattern-onset (Fig. 3) and pattern-pulse (Fig. 8) responses are quite similar in form to pattern-reversal responses throughout the tested field. This is consistent with previous reports (Hoffmann et al., Reference Hoffmann, Straube and Bach2003; James, Reference James2003; James et al., Reference James, Ruseckaite and Maddess2005b; Maddess et al., Reference Maddess, James and Bowman2005) and suggests that the cortical generators of responses to each stimulus type are similar. The polarity inversion across the horizontal meridian (Fortune & Hood, Reference Fortune and Hood2003) and the fact that the majority of the waveform variance for both reversal and pulse responses can be estimated by a single component (Zhang & Hood, Reference Zhang and Hood2004b; Maddess et al., Reference Maddess, James, Ruseckaite and Bowman2006), both argue that these responses are predominantly generated within the calcarine cortex (Area V1). In this light, it is perhaps interesting that we observed pattern-offset responses to have remarkably different form (Fig. 4) and substantially lower SNR (Figs. 5–7). The SNR differences between pattern-onset and pattern-offset responses (Fig. 6) and their field distribution (Fig. 7) did depend on contrast adaptation state, suggesting that gain control mechanisms are active for offset responses but perhaps different than those for onset responses. Pattern-onset responses were always larger than offset responses, even when adapted to higher contrast. Under the latter condition, the effect was largest in the inferior field.
In summary, the results of this study support the previous findings of James et al. in that pattern contrast pulses evoke mfVEP responses with larger SNR when these stimulus events are sparsely distributed in both time and space. Our findings indicate that spatial sparseness may make a substantial contribution to this SNR enhancement. These results have potentially important implications for clinical testing in that mfVEP recordings using such stimuli could be shortened without loss of diagnostic accuracy (Fortune et al., Reference Fortune, Zhang, Hood, Demirel, Patterson, Jamil, Mansberger, Cioffi and Johnson2008) or that recordings of the same duration could achieve larger SNR, extending dynamic range and diagnostic performance (Hood & Greenstein, Reference Hood and Greenstein2003; Fortune et al., Reference Fortune, Demirel, Zhang, Hood and Johnson2006).
Acknowledgment
The supporting institutions are M.J. Murdock Charitable Trust, Vancouver WA and Legacy Good Samaritan Foundation, Portland, OR.