

In principle, electoral democracy should limit corruption by allowing citizens to vote dishonest politicians out of office. The consolidation of democratic regimes in Latin America since the 1990s, however, has failed to bring about sustained improvements in corruption levels.Footnote 1 A vibrant literature, much of it drawing on Latin American cases, has emerged in recent years; it aims to untangle why voters fail to punish corruption.
A principal explanation is that voters lack information on corruption. The information asymmetries hypothesis is bolstered by studies showing that providing evidence of official malfeasance reduces voter support for the officials involved (Ferraz and Finan Reference Ferraz and Finan2008; Winters and Weitz-Shapiro Reference Winters and Weitz-Shapiro2013). However, other researchers find that access to credible information on corruption does not damage incumbents’ electoral prospects and may even bolster them, especially if the government is considered otherwise competent (Pereira and Melo Reference Pereira and André Melo2015; Fernández-Vázquez et al. Reference Fernández-Vázquez, Barberá and Rivero2016; Boas et al. Reference Boas, Hidalgo and Melo2019). This outcome has been explained as reflecting a tradeoff: voters dislike corruption but value other actions taken by the incumbent, such as the provision of public goods or services.
This article explores an alternative mechanism linking public expenditure to corruption perceptions, which has important implications for the electoral punishment of corruption. In particular, we hypothesize that, in the face of information constraints on actual corruption levels, investment in public works functions as a signal that helps determine individuals’ perception of corruption. In this way, we posit a new role for public investment in mediating the relationship between corruption and electoral accountability: rather than serving as an additional criterion against which voters weigh corruption levels, public investment fills the inevitable gap in voters’ knowledge about corrupt activities and therefore shapes perceived corruption independently of actual levels. Following this logic, the salience of public investment as a signal can also be expected to vary by individuals’ level of information about government performance. The less knowledge a voter has about government activities, the greater the effect of “public investment as signal” on the voter’s evaluation of incumbent performance.
This theory draws on core findings in the broader literature on information asymmetries and elections. First, the political budget cycle literature shows that governments often increase spending to produce visible benefits for voters in the run-up to elections.Footnote 2 According to the canonical model, such spending provides a signal of the incumbent’s competence in a context of limited information on actual government performance (Rogoff Reference Rogoff1990). Importantly for our analysis, political budget cycles have been found to be larger and more likely to occur in contexts of low voter information (Shi and Svensson Reference Shi and Svensson2000; Block Reference Block2002). In a similar vein, work on particularistic or targeted public goods emphasizes that infrastructure projects, such as new roads, electricity connections, and water treatment plants, are especially useful in overcoming information asymmetries because it is easy to assign political responsibility for such tangible public works, in contrast to services such as health and education (Keefer Reference Keefer, Devarajan and Widlund2007).
We test this proposition by examining how public spending by municipal governments affects individual-level perceptions of corruption in Mexico. We find that public investment levels and spending on public sector salaries shape corruption perceptions in ways that contravene some of our prior expectations before carrying out the research, as well as previous findings in the literature. First, greater public investment by municipal governments is associated with heightened corruption perceptions, even when controlling for individual bribe payment and additional individual- and municipal-level determinants. This result cuts against the prevailing view in the literature on political budget cycles and targeted public goods that public works should improve citizens’ assessments of government (Hicken Reference Hicken2011; Klein and Sakurai Reference Klein and Naruhiko Sakurai2015; Goetz et al. Reference Goetz, Gonçalves Veiga, Efthyvoulou, Morozumi and Klaus2019).
We also find that the effect of public investment on corruption perceptions is mediated by education level—a commonly used proxy for knowledge about government activities. Here again, however, the results are surprising. Individuals with more years of schooling perceive lower levels of corruption when local public investment is higher, while those with less formal education perceive greater corruption at high levels of public investment. This result runs counter to previous work suggesting that less-educated individuals are more likely to “accept” the tradeoff of corruption in return for public works.
Why might public investment lead less-educated individuals to perceive more corruption while decreasing corruption perceptions among those with more formal education? We propose two possible explanations and assess them using qualitative evidence from government audit reports. First, there may be a “targeting problem.” If municipal governments build infrastructure in relatively well-off neighborhoods while ignoring the needs of poorer areas, then we might expect that less-educated individuals, who also tend to be poorer, would associate such projects with corruption.Footnote 3 A second possibility is that local officials do invest in poorer neighborhoods, but the public goods and services they produce are of low quality. In the case of a “quality problem,” less-educated individuals would interpret the poorly executed projects in their vicinity as evidence of corruption. The higher-educated, by contrast, might view positively local governments’ actions to produce public works while not directly experiencing the costs of low-quality goods and services.
The analysis of audit reports from 12 municipalities included in our dataset shows that municipalities with high levels of public investment often focus this spending on urbanization projects at the expense of basic social infrastructure, such as water, sanitation, and electricity. In addition, these projects tend to benefit relatively well-off localities within the municipality, including the municipal seat, rather than those areas with the greatest gaps in coverage of the basic public services for which local governments are primarily responsible. These trends are consistent with a mechanism in which the targeting of public investment in municipalities favors relatively high-income individuals (who are also more educated) over lower-income individuals with less formal education. In contrast, we do not find strong support for the hypothesis that low-quality or poor implementation of projects explains our main quantitative finding. In this way, our qualitative evidence points to a mechanism whereby education mediates the relationship between public investment and corruption perceptions, not because less-educated individuals have less information about government activities, as we initially hypothesize. Instead, the less-educated tend to be excluded from municipal public works, which leads them to associate public investment with corruption.
Beyond public investment, we find that municipal spending on public employee salaries and benefits does not affect perceptions of corruption. Public spending on government salaries—a large share of which is assigned to teachers and health workers—represents a less visible type of expenditure, as it is more difficult for citizens to link such spending to tangible outcomes (Khemani Reference Khemani2004; Keefer Reference Keefer, Devarajan and Widlund2007). In this sense, absence of an impact on corruption perceptions is in line with our expectations.
The article highlights interesting and novel relationships between the use of public resources and individual perceptions of corruption. It is, to the best of our knowledge, the first study to empirically examine this question. Our results contribute to several areas of research. First, the conclusion that public investment can increase the perception of corruption among certain individuals introduces a new potential determinant of corruption perceptions not previously identified in the literature and calls for updating common assumptions that voters necessarily take a positive view of visible public works projects. This finding, in turn, has broader implications for the electoral punishment of corruption: if public works projects lead to greater perceived corruption among the less-educated, they could conceivably discourage political participation or affect these voters’ response to subsequent revelations of corruption, according to recent work in this area (Chong et al. Reference Chong, Ana de la, Karlan and Wantchekon2015; Arias et al. Reference Arias, Larreguy, Marshall and Querubín2018). On the methodological front, the study employs a multilevel modeling framework that could be useful in understanding corruption perceptions in other developing democracies in Latin America.
The plan for the rest of the article is as follows. The following section reviews relevant literature on corruption perceptions, electoral accountability, and public works and develops a conceptual framework to motivate the empirical analysis. The next section discusses the context of the study, municipalities in Mexico, and describes the research design. Quantitative results are presented, followed by a discussion of qualitative evidence that helps explain the quantitative findings. The final section offers conclusions and identifies avenues for future research.
Theoretical Framework: Corruption Perceptions and Accountability
Many influential scholars argue that societal demands for clean governance are the most effective mechanism to control corruption (Persson et al. Reference Persson, Rothstein and Teorell2013; Fukuyama Reference Fukuyama2014; Mungiu-Pippidi Reference Mungiu-Pippidi2015). However, robust social control of corruption faces numerous barriers. In the first place, information constraints can limit citizens’ ability to hold corrupt officials to account. Corruption is an inherently hidden activity, which makes it difficult for voters to ascertain the prevalence of graft.
This proposition is bolstered by studies showing that the provision of credible evidence of corrupt activities lowers support for incumbent candidates or parties. A pioneering article by Ferraz and Finan (Reference Ferraz and Finan2008) finds that the release of reports by Brazil’s federal audit courts reduced the vote share for incumbent candidates shown to have misappropriated funds during their terms. Importantly, the magnitude of the electoral punishment depends on local media penetration, further suggesting that access to information is the mechanism enabling voters to reject corrupt incumbents. Subsequent work has shown that information about corruption, either through media reports or flyers distributed to households, diminishes support for corrupt officeholders in Mexico (Larreguy et al. Reference Larreguy, Marshall and Snyder2018), India (Banerjee et al. Reference Banerjee, Kumar, Pande and Su2011), and Uganda (Humphreys and Weinstein Reference Humphreys and Weinstein2012). Winters and Weitz-Shapiro (Reference Winters and Weitz-Shapiro2013) find, in an experimental setting, that information about corruption produces a sharp negative reaction in respondents, regardless of politicians’ overall performance.
A second line of research suggests that it is not lack of information but lack of salience that prevents strong demands to reduce corruption from emerging. If voters care more about partisan affiliation (Anduiza et al. Reference Anduiza, Gallego and Muñoz2013), ethnic or kinship ties (Chang and Kerr Reference Chang and Kerr2017), or overall government performance (Pereira et al. Reference Pereira, André Melo and Figueiredo2009; Muñoz et al. Reference Muñoz, Anduiza and Gallego2012), they may be inclined to accept corrupt officeholders. In the context of Latin America, this dynamic has often been described as a tradeoff, in which voters tolerate corruption when incumbents are able to provide other benefits they value, such as the provision of public goods and services (Pereira and Melo Reference Pereira and André Melo2015; Boas et al. Reference Boas, Hidalgo and Melo2019).
In this way, public spending can blunt the negative impact of corruption on politicians’ reelection prospects. Pereira and Melo (Reference Pereira and André Melo2015), for example, find that while corruption decreases the probability that Brazilian mayors are reelected, the negative marginal effect of corruption on reelection disappears at high levels of public expenditure. Their study is motivated by a well-known dictum in Brazilian politics, rouba mas faz (he or she steals but gets things done)—which captures the idea that citizens may know a politician is corrupt but still support the politician if he or she is efficient in providing public goods and services. In a similar vein, Boas et al. (Reference Boas, Hidalgo and Melo2019) leverage experimental data to show that voters who reject corrupt mayors when presented with a hypothetical vignette may still vote for incumbents after receiving credible information about their corrupt activities. The authors interpret this outcome as reflecting a tradeoff between preferences against corruption and voters’ broader evaluation of government performance. This phenomenon has been identified and tested empirically in other parts of Latin America as well. Vera (Reference Vera2020), for example, finds that in Peru, while voters are inclined to punish corrupt politicians, they have a more favorable evaluation when corrupt politicians are also competent in delivering public works.
A third argument suggests that individuals’ perceptions of the pervasiveness of corruption play a central role in determining their inclination to reject corrupt politicians. When individuals perceive corruption levels to be very high, corruption becomes a collective action problem, in which no one has incentives to refrain from or take action against corruption, even if everyone would be better off if corruption were reduced (Persson et al. Reference Persson, Rothstein and Teorell2013; Corbacho et al. Reference Corbacho, Gingerich, Oliveros and Ruiz-Vega2016). Pavão (Reference Pavão2018) shows that when voters believe all candidates to be corrupt, corruption becomes a less salient electoral issue. In a similar vein, Arias et al. (Reference Arias, Larreguy, Marshall and Querubín2018) find that the revelation of evidence of corruption by mayors in Mexican municipalities actually increased incumbent support on average in local elections. This effect was driven by voters in municipalities with low (but non-zero) levels of malfeasance and voters who already believed the incumbent party to be highly corrupt. The implication is that where corruption is believed to be widespread, evidence of moderate levels of malfeasance may not cause voters to update their previous perceptions or may even be interpreted as “positive” news.
This discussion underscores the central role of perceptions in the electoral punishment of corruption. On the one hand, vertical accountability will be stymied when citizens are not able to discern corrupt activities. At the same time, if citizens come to perceive corruption to be systemic, they may lose motivation to vote against a corrupt incumbent. In response, a natural question to ask is what determines individuals’ corruption perceptions. In particular, it is important to tease out how the activities of government, such as the provision of public goods and services, shape individuals’ perception of corruption, given the well-known difficulty of directly observing corruption and the fluidity in understandings of corruption (Mungiu-Pippidi Reference Mungiu-Pippidi2015, 4–10).Footnote 4
The Role of Public Investment
While a large literature exists on the determinants of corruption perceptions, this work focuses on individual-level characteristics such as age and education; relatively static country-level variables, such as natural resources, ethnic fragmentation, democratic institutions, colonial history, and Protestantism (Bohn Reference Bohn2012; Donchev and Ujhelyi, Reference Donchev and Ujhelyi2014); and the role of corruption scandals in the media (Peterson Reference Peterson2021). Surprisingly, scholars have rarely focused on how individual corruption perceptions are shaped by public policy decisions—for example, how governments allocate public resources between investment, public sector salaries, and other types of spending. This lacuna is surprising because the level and type of public spending figure prominently in explanations of how citizens perceive government performance in other strands of the literature.
A prime example is political budget cycles. According to the canonical model, voters lack complete information to evaluate the performance of elected officials (Rogoff Reference Rogoff1990). Incumbents will therefore increase public spending on items such as direct transfers and subsidies to households around elections, while assigning fewer resources to long-term public works projects. By altering spending patterns in this way, politicians signal their competence to voters in hopes of securing voters’ support at the polls.
Interestingly, studies of political budget cycles at the subnational level identify a different compositional effect on spending patterns: governments increase investment expenditure because public works at the local level have shorter time horizons and thus produce visible benefits that signal incumbent competence in the short term (Khemani Reference Khemani2004; Klein and Sakurai Reference Klein and Naruhiko Sakurai2015). A vast body of empirical work has found evidence of such cycles in diverse contexts (see Dubois Reference Dubois2016 and Goetz et al. Reference Goetz, Gonçalves Veiga, Efthyvoulou, Morozumi and Klaus2019 for recent reviews). Importantly, political budget cycles have been found to be more pronounced in contexts of low voter information about government activities—further solidifying the role of spending as a signaling device in the face of information asymmetries (see Shi and Svensson Reference Shi and Svensson2000; Block Reference Block2002). This literature thus provides theoretical grounding for the proposition that citizens look to the visible outputs of government spending as an informational input in evaluating the quality of government—including, potentially, corruption levels.
The literature on particularistic goods further motivates a link between public investment decisions and corruption perceptions. This work, like political budget cycle theory, departs from the assumption that information asymmetries are pervasive and represent a major obstacle to democratic accountability. The core claim is that voters often have difficulty associating the outcomes of public policy with the actions of elected officials. Facing this problem, politicians prefer to allocate public resources to sectors that produce visible benefits clearly linked to their decisions. Keefer (Reference Keefer, Devarajan and Widlund2007) and Keefer and Khemani (Reference Keefer and Khemani2005) show that public works projects, such as roads, electricity lines, and sanitation plants are better able to overcome information asymmetries than investment in public services, such as education and health.
Furthermore, the nature of large public works projects reinforces the idea that they may serve to depress corruption perceptions below actual levels. Studies of corruption in public procurement and construction highlight how characteristics such as large budgets, information asymmetries between public officials and contractors, and the difficulties of physical inspection render large public works ripe for generating and distributing corrupt rents (Rose-Ackerman and Palifka Reference Rose-Ackerman and Palifka2016). For this reason, corruption has been associated with a bias in public expenditure toward large public works projects at the expense of investments in health and education. However, our contention here is that the production of visible public works can be expected to lower corruption perceptions even if the projects involve corruption, as citizens are unlikely to observe fraud in the awarding of contracts or project execution. As a result, citizens may dramatically underestimate levels of actual corruption in public works. Olken (Reference Olken2009), in a seminal paper, finds large gaps between reported perceptions of corruption and the true level of “missing expenditures” in local road projects.
In sum, the different research agendas described above provide strong reasons to believe that public spending will directly shape citizen perceptions of corruption. This discussion leads to our first two hypotheses:
H1. Public investment in visible public works will be associated with lower corruption perceptions.
H2. Public spending on current expenditures and services will not have a significant effect on corruption perceptions.
A further implication of the public-investment-as-signal argument is that its effect can be expected to vary across individuals, depending on how informed they are about government activities. If visible public investment serves to fill in gaps in information about actual corruption levels, then its impact on corruption perceptions should be greater for individuals with less ex ante knowledge of government corruption. This logic is also supported by the finding that political budget cycles are more pronounced in low-information contexts (see Shi and Svensson Reference Shi and Svensson2000; Block Reference Block2002). In this regard, several authors argue that individuals with more education have better information and therefore are more responsive to corruption (Seligson Reference Seligson2002; Weitz-Shapiro and Winters Reference Weitz-Shapiro and Winters2017; Gutmann et al. Reference Gutmann, Padovano and Voigt2020). Melgar et al. (Reference Melgar, Rossi and Smith2010, 125) find that people with secondary education are “more likely to access information about the current level of corruption and have better capabilities to process such information.” Based on these findings, we expect individuals with lower education levels to be less able to observe actual corruption and therefore more prone to take visible outputs of government activity, such as public investment, as proxies for corruption levels:
H3. The association between more public investment and lower corruption perceptions will be stronger for individuals with lower levels of education.
Context, Research Design, and Data
We study these dynamics in Mexico, where corruption has increased according to the main cross-national indices, even as the county has undergone democratization and institutional reform.Footnote 5 Corruption is especially problematic at the local level, where mechanisms of horizontal accountability are weak or nonexistent and intergovernmental transfers provide the bulk of government income. Municipal comptrollers’ offices are generally staffed with members of the mayor’s party or close political allies, while state- and national-level auditing organizations devote scant resources to overseeing municipal spending. Most municipal governments, moreover, operate under severe resource constraints, lacking sufficient human capital, as well as computers and other basic tools that facilitate oversight and control of public employees (Grindle Reference Grindle2007). In addition, access to public information is limited, and participatory mechanisms are often co-opted by local elites or powerful interest groups (Grindle Reference Grindle2007; Selee Reference Selee2011).
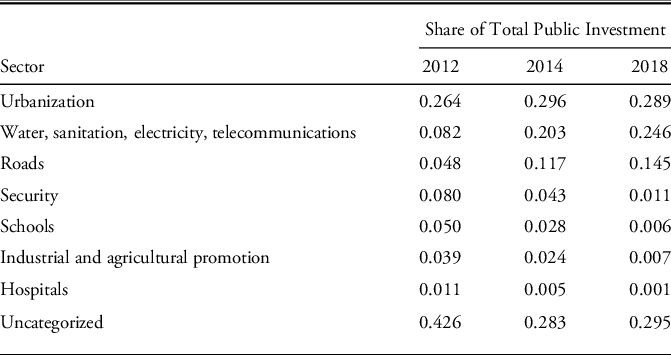
At the same time, municipal governments are responsible for critical public services, such as water treatment, electricity, garbage collection, and the construction and maintenance of basic urban infrastructure, which have a direct and “visible” effect on citizens’ wellbeing. As table 1 shows, these sectors account for the bulk of total public investment by municipalities. In many municipalities, a large share of this expenditure is financed with federal transfers from the Fund for Municipal Social Infrastructure (FISM), which provides earmarked resources for social infrastructure projects that directly benefit poor populations and areas with low coverage of basic services (Chong et al. Reference Chong, Ana de la, Karlan and Wantchekon2015). According to Article 33 of the Fiscal Coordination Law, funds from the FISM are to be spent exclusively on “the financing of public works, investments, and basic social actions that directly benefit the population in extreme poverty and localities with high or very high social gaps.”
Municipal Investment in LAPOP Survey Years

Source: INEGI Public Finance Statistics of States and Municipalities.
The available evidence suggests that corruption perceptions at the municipal level are high. Grandet and Reséndiz (Reference Grandet and Reséndiz2015) report that 76 percent of Mexicans consider corruption to be frequent or very frequent in municipal governments. Bribery is also common in municipal governments. According to Meza and Pérez-Chiqués (Reference Meza and Pérez-Chiqués2020), 26 percent of interactions with municipal authorities involved a bribery solicitation in Mexico. According to Romero et al. (Reference Romero, Parás, Pizzolitto and Zechmeister2020), citizens most frequently encounter bribery in dealing with the police and judicial authorities, followed by health and education service providers.
However, there is important variation within this general picture of how municipal governments operate. Corruption levels vary across municipalities (Arias et al. Reference Arias, Larreguy, Marshall and Querubín2018), while some municipalities devote much larger shares of total expenditure to public investment than others (Unda-Gutiérrez Reference Unda-Gutiérrez2019). As Grindle (Reference Grindle2007) thoroughly documents, the quality of municipal governance varies considerably on the basis of factors such as the entrepreneurialism, management, and leadership skills of mayors, as well as their efficiency in dealing with state and national officials. In this context, it is important to understand how the actions of local governments, including their investments in public works and infrastructure, affect perceptions of corruption.
Research Design and Data
To test the relationship between municipal spending and individual perceptions of corruption, we employ a multilevel model, which allows for the inclusion of both municipal and individual-level controls. As noted earlier, municipal governments are charged with local spending and investment decisions and are responsible for delivering basic public goods and services, such as water and sanitation, electricity, and local roads. As a result, individual perceptions of corruption are likely to be sensitive to the level and composition of spending by municipal governments, given that municipalities are responsible for the type of investments that produce visible public goods and services. A multilevel model is thus the appropriate modeling strategy when the municipal-level covariates affect individual-level outcomes (Steenbergen and Jones Reference Steenbergen and Jones2002). As an empirical check, a variance components model on the dependent variables shows that municipal differences account for roughly 8 percent of the variance, on average. This is above a 5 percent threshold and justifies the use of the hierarchical model. For example, Hayes (Reference Hayes2006) notes that “values of ICC as small as 0.05 can invalidate hypotheses tests and confidence intervals when MLM is not used.”
We employ a multilevel model with random intercepts because our theoretical prior is that levels of municipal expenditure are likely to shift the baseline level of corruption perceptions across municipal units.Footnote 6
The baseline model assumes that unobserved contextual factors at the municipal level (which are captured in the random intercepts) are uncorrelated with the included independent variables. A violation of this assumption could result in heterogeneity bias, though. In line with the general multilevel notation used in Hox et al. (Reference Hox, Moerbeek and van de Schoot2010), the individual (level 1) model is formalized as:
 $$ \eqalign{\rm{Y_{ij }} = &{{{\rm{ }}_{\beta 0{\rm{j }}}\! + _{\beta{1}{\rm j}} {\rm Ag e}}_{{\rm{ij}}}{ + _{\beta {\rm{2j}}}}{\rm{Whit}}{{\rm{e}}_{{\rm{ij}}}}{ + _{\beta {\rm{3j}}}}{\rm{Mal}}{{\rm{e}}_{{\rm{ij}}}}{ + _{\beta {\rm{4j}}}}{\rm{Ed}}{{\rm{u}}_{{\rm{ij}}}}{ + _{\beta {\rm{5j}}}}{\rm{Services\,Inde}}{{\rm{x}}_{{\rm{ij}}}}} + \cr&_{\beta {\rm{6j}}}{\rm{GovtBrib}}{{\rm{e}}_{{\rm{ij}}}} + {\rm{ }}{{\rm{r}}_{{\rm{ij}}}} \cr} $$
where Yij is the individual-level indicator for the outcome variable for each individual i, from municipality j; β0j is the individual-level intercept; β1j through β5j are the coefficients for the six individual-level variables; and rij is the individual-level error term.
At the second level of the model, municipal-level variables are included to model the individual-level intercept as a function of municipal-level conditions.
 $$\eqalign{ _{\beta 0{\rm{j}}} = \,&{\rm{ }}{\gamma _{00\,{\rm{ }} +\, }}{\gamma _{0{\rm{1}}}}{\rm{President}}/{\rm{municipal\,Alignmen}}{{\rm{t}}_{\rm{j}}} + {\rm{ }}{\rm \gamma _{0{\rm{2}}}}{\rm{Poverty\, Rate }} \,+ \cr &{\gamma _{0{\rm{3}}}}{\rm{Public\,Investmen}}{{\rm{t}}_{\rm{j}}} + {\rm{ }}{\gamma _{0{\rm{4}}}}{\rm{Taxe}}{{\rm{s}}_{\rm{j}}} + {\rm{ }}{\gamma _{0{\rm{5}}}}{\rm{Personnel\, Spendin}}{{\rm{g}}_{\rm{j}}} +\!{\rm\mu_{0{\rm{j}}}} \cr} $$
where β0j is the municipal-level intercept, γ01j through γ04j are the coefficients for the municipal-level variables; and μ0j is the municipal-level random error term.
Our dependent variable is Corruption perceptions, which can take the following values: 1 (not at all widespread), 2 (a little widespread), 3 (somewhat widespread), and 4 (very widespread).Footnote 7 Following the literature, we control for economic and demographic characteristics at the individual level that are theoretically and empirically linked to our corruption outcome. These are age, gender, whether someone is White (vs. non-White), years of schooling, and a household services index. (The studies we draw on are Gutmann et al. Reference Gutmann, Padovano and Voigt2020; Lavena Reference Lavena2013; Melgar et al. Reference Melgar, Rossi and Smith2010.) As a robustness check, in appendix table A.1, we include individual-level partisanship as a control variable. We exclude it from the main results because 74 percent of the sample across all survey years does not self-identify with a political party. Moreover, Zimbalist (Reference Zimbalist2018) shows that respondents’ self-reporting of trust in ruling and opposition parties is substantially misreported or biased in environments where political conflict is rife. In addition, we include a control for whether an individual was solicited to pay a government bribe.
In line with the literature, we expect a positive relationship between bribe solicitation and corruption perceptions. In parallel, we anticipate a negative association between education and corruption perceptions (Melgar et al. Reference Melgar, Rossi and Smith2010). For economic controls, we would ideally be able to account for individual income. Unfortunately, we do not have good measures of individual income in the LAPOP data. Instead, we include a household services index and note that years of schooling is a decent proxy for income. We carry out factor analysis to determine the suitability of combined indices. Access to drinking water at home, an indoor toilet, and home sewage all load on to a common factor. We create a “naive” composite indicator by taking the average of the indicators that define this factor.
The individual-level data are drawn from the AmericasBarometer surveys conducted in Mexico. In this survey, individual-level observations are obtained from an individual within a visited dwelling, which are sampled from four regional clusters (i.e., the primary stratum) (see AmericasBarometer 2018–19). However, the regional cluster is not a meaningful unit of government or subnational variation and is thus unimportant in explaining individual-level corruption perceptions and bribe payments.Footnote 8 While the state is a meaningful unit of subnational variation in Mexico, state-level differences only account for roughly 4.5 percent of the variance, on average. In addition, the Akaike’s information criterion (AIC) and Bayesian information criterion (BIC) are either slightly smaller or larger depending on the criterion with state-level effects included, which do not suggest a better-fitting model. As a result, we prefer the more parsimonious model without state-level fixed effects. We use data for the years when AmericasBarometer surveys were conducted consistently for our outcomes of interest: 2012, 2014, and 2019.Footnote 9 Because the AmericasBarometer surveys are conducted in a subset of municipalities, our full merged dataset contains 96 municipalities.
At the municipal level, we account for three municipal public finance covariates: public investment, personnel spending, and taxation. We use INEGI’s Estadísticas de Finanzas Públicas Estatales y Municipales for these variables. “Public investment” includes the construction of public works, such as water and sanitation, electricity, transportation, and telecommunications infrastructure; schools, hospitals, and public housing; and industrial sites and parks. “Personnel spending” includes public sector salaries, benefits (including social security payments), and bonuses paid to public sector employees in the municipality. Taxation refers to local taxes and licensing fees collected by municipal governments, the largest of which is the predial, or property tax. These variables are all lagged by one year (t–1) because we believe that the causal ordering runs from spending decisions to individual-level corruption perceptions. We also control for the municipal poverty rate and for whether there is party alignment between the president and the mayor.
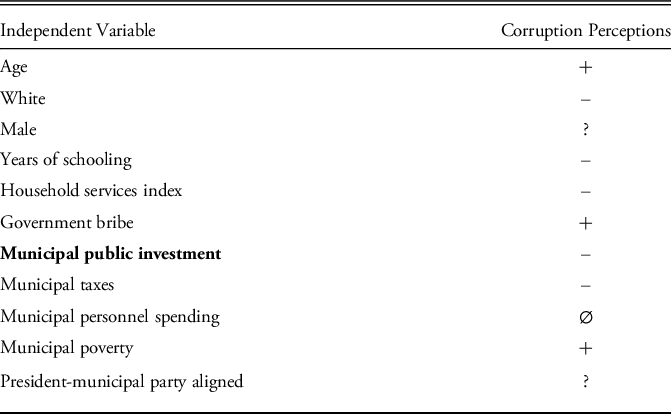
Based on the findings that delivering public works can improve citizens’ evaluation of corrupt officials, as well as our argument that public works may serve as a signal of noncorrupt administration, we expect that public investment will be associated with lower corruption perceptions, in line with hypothesis H1. However, our theoretical framework leads us to anticipate heterogenous effects depending on years of schooling, in which the negative association between public investment and corruption perceptions will be of greater magnitude for individuals with less formal education (see hypothesis H3). In contrast, we do not expect public sector employment spending to have a significant effect on corruption perceptions, as this spending is oriented toward the provision of less visible public services, in line with hypothesis H2. See table 2 for a full list of independent variables and their expected relationships with the outcome variables.
Expected Relationship Between Independent Variables and Corruption Perceptions

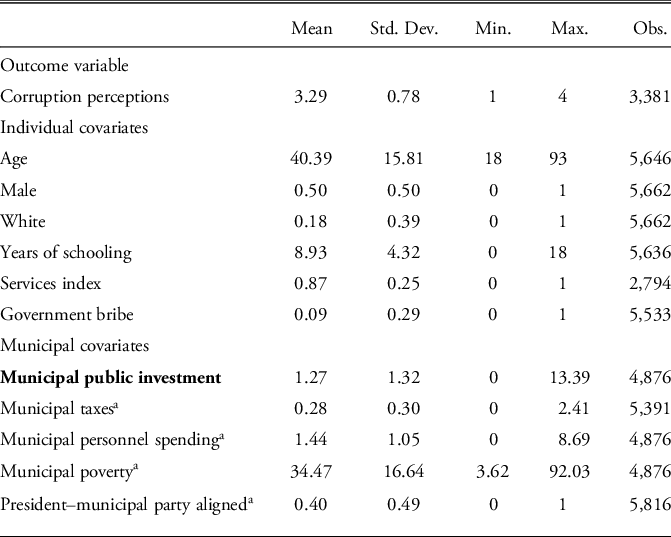
Table 3 provides descriptive statistics for respondent and municipal characteristics included in the model. We exclude data from Mexico City (CDMX) from our main analysis due to the presence of significant outliers, although our main results are robust to the inclusion of CDMX (see appendix table A.3). For our corruption perceptions dependent variable, the average is 3.29, which falls between corruption being perceived as somewhat widespread or very widespread among public officials. For the individual-level predictor variables, the sample is equally split across males and females. Eighteen percent of the sample self-reports being White. Respondents have an average of roughly nine years of schooling and most (87 percent) have access to the three household services included in the index: drinking water, toilet, and sewage in the home. With regard to corruption victimization, 9 percent of respondents report being solicited to pay a bribe to a public sector worker or official.
Descriptive Statistics (CDMX excluded)

a Added to the model as potentially relevant covariates.
At the municipal level, the mean poverty rate is 34 percent, with substantial variation across municipalities. The three municipal finance variables are listed in thousands of pesos per capita. Average public investment is 1,270 pesos per head, ranging from a low of zero to a high of 13,390 pesos per head. Average personnel spending ranges from zero to 8,690 pesos per capita with a mean of 1,440 pesos. Taxation is also low, with a mean of 280 pesos per capita. Forty percent of municipalities are governed by parties that are in alignment with the president’s party.
Quantitative Findings
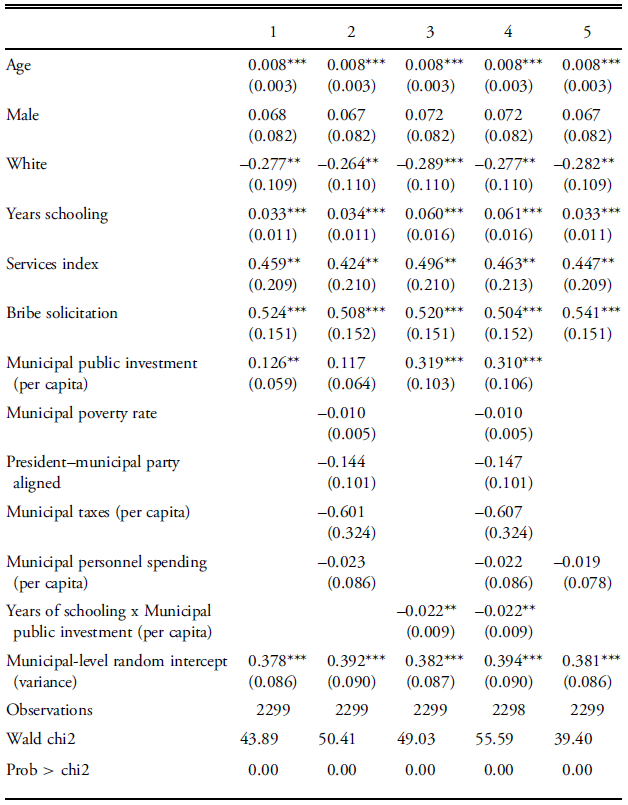
The first two columns of table 4 present results for the regression models without any interaction terms. The most simplified model, presented in column 1, shows a statistically significant positive association between municipal public investment and corruption perceptions. In an extended model including other municipal-level covariates, presented in column 2, this positive association between public investment and corruption perceptions is no longer statistically significant at the 95 percent level. These results run counter to our theoretical expectation that public investment would be negatively associated with corruption perceptions.
Results on Corruption Perceptions

** p < 0.05, *** p < 0.01.
Standard errors in parentheses.
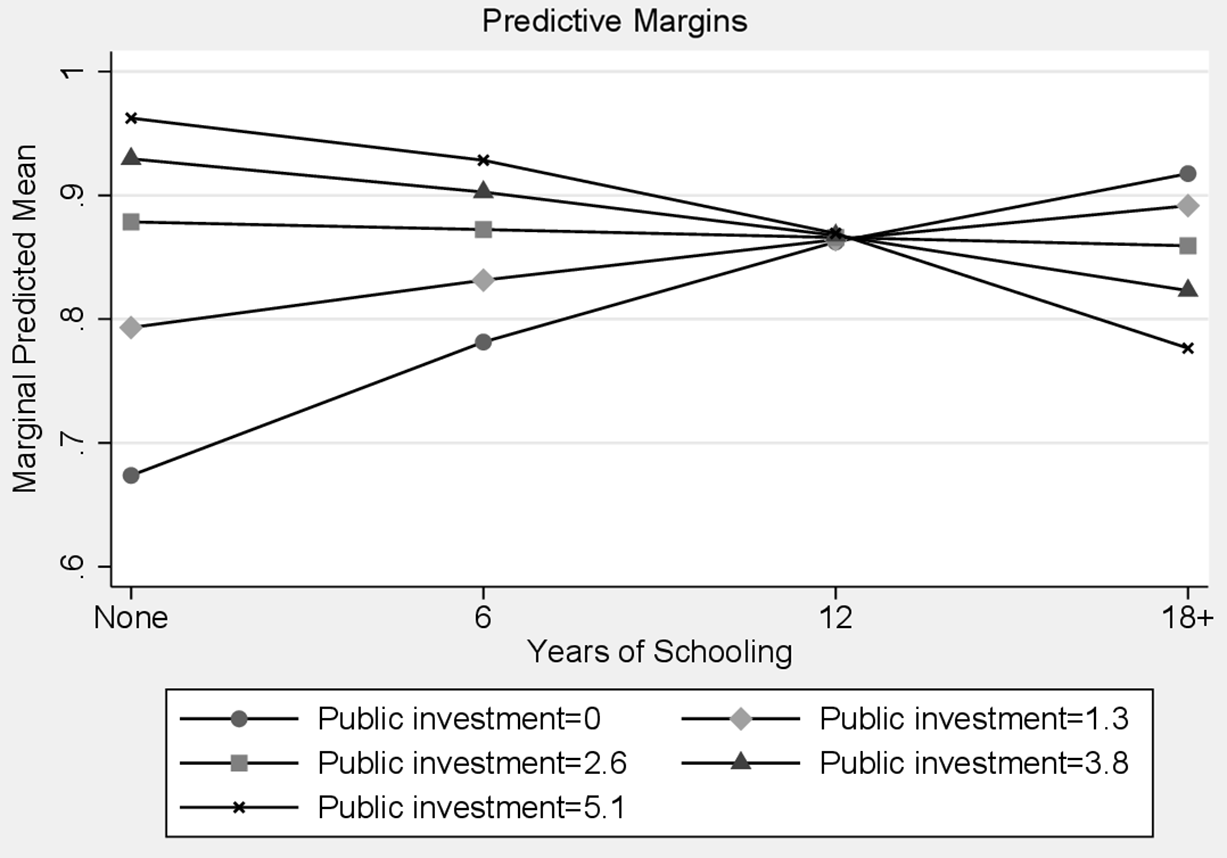
However, in testing whether there is a conditional relationship between public investment and level of education, we find that the inclusion of an interaction term between years of schooling and public investment substantially improves the fit of the model (results presented in columns 3 and 4).Footnote 10 Moreover, the coefficient of the interaction term between schooling and investment is negative and statistically significant. It is important to reiterate here that in this conditional model, investment and schooling are each positively associated with corruption perceptions. This negative sign on the interaction term means that people with more schooling perceive less corruption at higher levels of municipal investment, even though more schooling is (individually) associated with perceiving more corruption.
In addition, column 5 shows a simple model, with municipal personnel spending as the only higher-level covariate. This trimmed-down model confirms that personnel spending has no effect on corruption perceptions, in line with our expectations.
Figure 1 presents a visual representation of these interaction effects. For ease of display, we collapse the four categories of the corruption perceptions variable into a binary 0 to 1 variable. Zero corresponds to “not widespread or not very widespread” corruption among public workers, and 1 corresponds to “somewhat or very widespread” corruption among public workers. We plot five different public investment levels linked to varying standard deviations. (Public investment = 0 corresponds to one standard deviation below the mean; public investment = 1.3 corresponds to the mean; public investment = 2.6 = one standard deviation above the mean; public investment = 3.8 two standard deviations above the mean; and public investment = 5.1 is three standard deviations above the mean.) The graph shows that at higher levels of investment, lower levels of education correspond to higher corruption perceptions. These corruption perception gaps begin to close as people gain more education (disappearing at 12 years). Once individuals obtain postsecondary education, the relationship is inverted: highly educated people perceive less corruption at high levels of investment but more corruption at low levels of investment.
Predicted Margins by Education and Public Investment

Our quantitative findings thus produce surprising results that refute common assumptions in the literature and pose interesting puzzles. First, the positive association between public investment and corruption perceptions cuts against the idea that citizens will necessarily take a positive view of infrastructure projects. The differential effect of public investment based on education levels, meanwhile, calls for further interrogation of why individuals’ reaction to the provision of public goods and services might vary across educational levels.
Qualitative Evidence
In principle, many of the public investments carried out by municipal governments, especially electrification, water and sanitation, and public housing projects, should be expected to benefit lower-educated individuals, who tend to be poorer and to live in areas where coverage of such basic services is more limited.Footnote 11 However, these benefits may not come about if projects are poorly managed and executed, which leads to delays, opportunities for graft, and low-quality public goods and services that fail to meet user expectations. If public investment projects suffer from these issues, the groups directly affected by the consequences of such mismanagement—less-educated, poorer individuals with less access ex ante to public services—could plausibly come to associate public works with higher corruption (even if projects do not entail fraud, bribery, or illicit enrichment, strictly speaking). In contrast, individuals with more education, which is closely tied to income, are likely to be shielded from the negative effects of low-quality public works. Instead, they may interpret municipalities’ efforts to enhance basic service provision as a sign of good public administration, explaining the association between higher public investment and lower corruption perceptions for highly educated individuals.
Another possibility is that the allocation of municipal public investment projects does not actually favor poorer areas, where more low-educated individuals live. Instead of dedicating resources to expanding access to basic services such as water, sanitation, and electricity, for example, local governments may choose to improve roads, sidewalks, and other urban infrastructure in the municipal center. Studies by Chong et al. (Reference Chong, Ana de la, Karlan and Wantchekon2015) and Arias et al. (Reference Arias, Larreguy, Marshall and Querubín2018) find that municipal governments often fail to comply with rules requiring federal transfers to be spent in poorer neighborhoods. Under such circumstances, it is again logical that more public investment would be correlated with lower corruption perceptions among individuals with more education and income, who now would be more likely to directly experience the benefits of better urban infrastructure, and higher corruption perceptions among the poor and less educated, who see the municipal government failing to prioritize their needs.
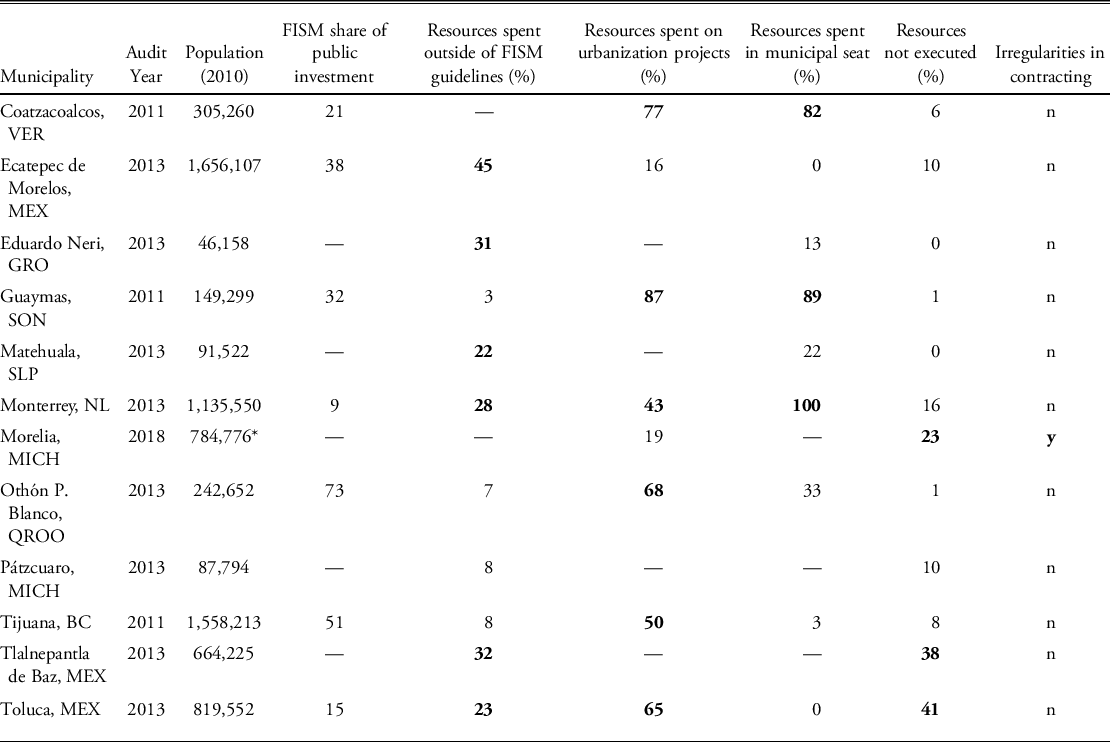
To assess the relevance of these mechanisms—which we refer to respectively as the “quality” and “targeting” mechanisms—we examine the results of audits by Mexico’s Superior Federal Auditor (ASF) of municipalities’ use of federal resources from the FISM for basic infrastructure and services, such as water and sanitation, electricity, urbanization projects, and schools and hospitals. The FISM accounts for a significant share of total public investment in most municipalities (table 5; see also Chong et al. Reference Chong, Ana de la, Karlan and Wantchekon2015; Unda-Gutiérrez Reference Unda-Gutiérrez2019). Each year, the ASF audits the use of FISM funds by a sample of municipalities.
ASF Audit Results, Subsample of Municipalities

Sources: ASF municipal audits, 2011, 2013, and 2018. Available in the ASF yearly general audit reports.
To select audit reports to review, we first identified the municipalities in our data with high levels of public investment (defined as more than one standard deviation above the average) in the year prior to their inclusion in the LAPOP survey.Footnote 12 Among this subgroup, 12 municipalities were also audited by the ASF in that year. This sample covers a diverse range of municipalities, including major urban centers, such as Monterrey; large suburbs, such as Ecatepec outside Mexico City; and small and midsized municipalities with rural and semiurban zones (see table 5).
The audit reports provide evidence in support of the “targeting” mechanism but not the “quality” mechanism. Overall, two types of issues are consistently flagged by the ASF. The first is that the municipal government dedicates a significant quantity of resources to projects outside of the approved sectors for FISM investments or projects that do not comply with other fund guidelines. According to Mexico’s Fiscal Coordination Law, municipalities must spend these resources in the following areas: drinking water, sewage systems, drainage and latrines, municipal urbanization, rural electrification in poor areas, basic health infrastructure, basic education infrastructure, housing, rural roads, and productive infrastructure in rural areas. Second, municipalities regularly spend FISM resources on projects that do not further the fund’s objectives of addressing gaps in the coverage of basic public services and improving development in localities with extreme levels of poverty. This could be the case, for example, if projects in approved sectors, such as water, sanitation, or urbanization, are not adequately targeted to low-income populations or areas with high levels of social needs, or if the municipal government underinvests in basic public services compared to urbanization projects.
As table 5 shows, every municipality in the sample for which there was sufficient data either spent a significant share (at least 20 percent) of resources on projects outside the fund’s ambit or dedicated more than half of its investments to urbanization projects at the expense of basic infrastructure needed to overcome public service gaps. In the case of Eduardo Neri in the state of Guerrero, for example, the municipal government spent 31 percent of FISM resources on projects outside of the permitted sectors, including the construction of a sports complex and the cleaning of a municipal landfill.
Other municipalities generally complied with the formal fund guidelines but still failed to invest sufficient resources toward expanding basic infrastructure coverage for low-income populations. The 2011 audit of Tijuana, Baja California, for example, found that the municipality spent 92 percent of its FISM resources in approved sectors; however, the government dedicated 50 percent of this investment to urbanization projects and only 29 percent on basic infrastructure such as water, sewage, electrification, and housing. The ASF deemed this allocation “not sufficient” to address gaps in coverage and concluded that the municipality made only a “marginal contribution to complying with the objectives [of the fund] by channeling the majority of its funds to projects with a clear orientation toward benefiting sectors of the population [with] the best development conditions, to the detriment of localities and inhabitants with the greatest necessities” (ASF 2011). In a similar vein, the audit report for Tlalnepantla de Baz in the State of Mexico finds that the municipality dedicated 20 percent of its investments to projects that did not benefit the population in extreme poverty or social need. These works included repaving several streets in neighborhoods where, according to the ASF, “basic services such as drinking water, drainage and sewage, and lighting are available, [and] the surrounding streets have sidewalks and curbs” (ASF 2013).
On the other hand, the available evidence does not support the hypothesis that poor management and execution of projects explains our finding on the differential effects of public investment on corruption perceptions. The municipalities in our sample, with few exceptions, executed the vast majority of FISM resources, which provides a basic proxy for effective public sector management (see Chong et al. Reference Chong, Ana de la, Karlan and Wantchekon2015). In addition, only one audit report identifies irregularities in the awarding or payment of contracts. When physical inspection of projects occurred, they were found to be operating satisfactorily. In this way, the qualitative evidence contained in municipal audit reports suggests that inappropriate targeting of public investment projects in municipalities to the benefit of relatively well-off and more-educated individuals may explain our main quantitative finding. It is worth highlighting that this mechanism differs from our initial hypothesis (H3), in which education mediates the effects of public investment on corruption perceptions because less-educated individuals are more likely to use public works as a signal of effective governance. However, further testing is required to make strong claims regarding mechanisms.
Conclusions and Future Research
This article has addresed how the composition of public spending by local governments affects corruption perceptions—a relevant but overlooked question in the literature on corruption perceptions and electoral accountability. The question is relevant because the use of public resources to produce visible public works has been found to shape how citizens view government performance—especially among populations with less information to evaluate their elected officials—in studies of political budget cycles and targeted public goods. The same underlying mechanisms could plausibly be behind a direct relationship between public investment and corruption perceptions, with implications for the electoral punishment of corruption. If ramping up expenditure on public works could lower citizen perceptions of corruption, then holding corrupt officials accountable through the ballot box would be more difficult. Despite these theoretical implications, this is, we believe, the first article to directly study how local government expenditures affect individual corruption perceptions.
Our quantitative analysis produces surprising results that suggest alternative mechanisms linking public investment and corruption perceptions. Contrary to our expectations and prevailing assumptions in the literature, we find that greater expenditure on public works by municipal governments is associated with higher perceptions of corruption. Interestingly, the effect of public investment on perceptions is conditioned by education levels. Individuals with more years of schooling perceive lower levels of corruption when public investment by municipal government is higher, while individuals with less formal education perceive higher levels of corruption when public investment is higher. We also find that municipal spending on public employees’ compensation and benefits, a form of expenditure that produces less visible government services, does not affect corruption perceptions.
We leverage qualitative data from municipal audits to identify possible mechanisms behind our quantitative findings. These reports provide evidence that municipalities’ failure to target public investments to poor neighborhoods with the greatest infrastructure needs may explain why less-educated individuals, who tend to live in poorer areas, perceive higher corruption as municipal investment expenditure increases, while the opposite is true for individuals with more formal education. This proposed mechanism, importantly, is fundamentally different from our hypothesis, motivated by the literature on corruption perceptions, that less-educated individuals would be more susceptible to public investment as a signal.
Our results are relevant from the perspective of the growing literature on the electoral punishment of corruption in Latin America. Recent work in Mexico, Brazil, Colombia, and other countries in the region highlights that even when citizens have credible information on corruption by incumbents, they may not vote them out of office (Chong et al. Reference Chong, Ana de la, Karlan and Wantchekon2015; Arias et al. Reference Arias, Larreguy, Marshall and Querubín2018; Boas et al. Reference Boas, Hidalgo and Melo2019). One explanation is that when individuals already believe corruption to be high, new information about corruption does not change their perceptions. In this case, it is important to understand the factors that drive corruption perceptions in the first place, and this article sheds new light on this question by highlighting the role of local public investment.
In a similar vein, our findings suggest an explanation for the well-documented divergence between corruption perceptions and corruption victimization. In general, the literature finds that corruption is perceived to be far more widespread than actual experience of bribe solicitations would suggest (Mungiu-Pippidi Reference Mungiu-Pippidi2015). This is also true in the setting for our article: our data show that corruption perceptions are high on average, even though only 9 percent of respondents report direct experience of a bribe solicitation from public officials. If municipalities’ allocation of resources for public works has a direct effect on corruption perceptions, then these decisions could help explain why corruption experience is only a weak predictor of perceptions.
These findings and their possible explanations point to several promising avenues of future research. First, interview or survey research could probe how education or informational awareness interacts with individuals’ experiences of public works and government services to shape corruption perceptions. More broadly, future research using datasets from other Latin American countries could investigate, and potentially provide greater empirical support for, the tentative mechanisms implied by our findings. To this end, the construction of a dataset with comparable local-level fiscal data across countries would be an invaluable tool for more rigorous testing of the effects of local spending decisions. Furthermore, our findings suggest that the allocation of public works projects at the local level may shape corruption perceptions and, in turn, citizen evaluations of public institutions more generally. In this regard, a more nuanced understanding of how local government spending decisions can be implemented in a way that improves perceptions of government responsiveness is an important task for both researchers and policymakers, especially in the context of Latin America’s fragile democratic institutions.
Supplementary material
To view supplementary material for this article, please visit https://doi.org/10.1017/lap.2022.12
Conflict of interest
We can confirm that we have no conflict of interest.
Supporting Information
Additional supporting materials may be found with the online version of this article at the publisher’s website: Appendix.