Over the course of the nineteenth century, international trade flows experienced an unprecedented rise. Recent contributions (Steinwender Reference Steinwender2018; Juhász and Steinwender Reference Juhász and Steinwender2018) highlighted the key role played by the telegraph during this “First Globalization.” The development of an international telegraphic network allowed for cheaper and more efficient transmission of information, which boosted international trade. The information transmitted through the telegraphic network could be either private, that is, relevant to a restricted group of agents and shared only within this restricted group of agents, or public, that is, shared with the rest of the world, providing an easily accessible pool of knowledge on relevant market characteristics in foreign countries, where information was previously very scarce and costly to acquire. An increase in public information amounts to cheaper and more accurate data on market sizes, prices, trade costs, and demand shifters in foreign markets, while an increase in private information is more akin to a reduction in search costs (the costs of finding buyers or sellers for a specific product). Our paper confirms the positive effect of information on trade and sheds some new light on the specific role of public information.
Indeed, during the nineteenth century, one shock specifically affected the amount of public information shared between some countries: the emergence of global news agencies. These global news agencies systematically collected and transmitted information across borders, acting as wholesalers of information. They gathered news and sold them to governments, businesses, and newspapers.Footnote 1 The three largest news agencies quickly syndicated into an efficient cost-sharing organization: each of them was given a monopoly over a set of countries, and in exchange, committed to share information on these countries with other news agencies. The sharing of information among the three global news agencies was truthfully enforced, since it ensured that they would stay ahead of the competition. Therefore, when a country was included in the syndication agreement between the global news agencies, it became part of an international network of news sharing, boosting its flows of public information with the other countries included in the syndication agreement.
The development of international news agencies was deeply intertwined with the construction of an international telegraphic network: news agencies relied on the telegraph to communicate and often contributed to its expansion. The telegraph represented a considerable improvement upon previous communication technologies,Footnote 2 allowing for shorter and less volatile transmission delays. Even though it made communications easier, it did not provide, per se, a centralized and reliable source of business information. We argue that in the absence of a global news agency, connecting a country to the global telegraphic network mostly reduced the communication frictions, with large effects on private information flows, but had little effect on the amount of public information available. We use the presence of a news agency on top of the telegraphic network connection to estimate the trade effect of improved access to public information and to disentangle this effect from that of reduced communication costs (mostly private information), a separation that previous studies were unable to make.
Our identification mainly relies on the standard specification in the trade literature: the gravity equation (Head and Mayer 2014). In this specification, the effect is identified from time variations within a country pair, that is, we compare flows within a country pair before and after the two countries (importer and exporter) are included in the news agencies’ agreement and linked by a telegraph. The presence of country pair fixed effects neutralizes all time invariant confounding factors at the country pair level, such as distance. On top of these, time varying fixed effects for the exporting and the importing countries allow us to control for any “country x year” confounding factor.
On top of this baseline specification, we perform various robustness checks to ensure that the effect we estimate is indeed attributable to news agencies and telegraphs. First, we focus on indirect connectionsFootnote 3 which provide a plausibly more exogenous source of variation for our explanatory variables. Second, we control for potential omitted variables in restricted samples for which we are able to construct proxies for those omitted variables. We show that trade policy and changes in the maritime transport technology (the adoption of steamships) do not affect our coefficients of interest. Third, we perform a full set of tests to rule out the possibility of pre-trends. Fourth, following recent advances in the difference-in-difference literature, we implement estimators that are robust to heterogeneous treatment effects. In this case, we compare the evolution of trade after treatment among the group of treated units (i.e., country pairs in which both countries benefit from news agencies’ coverage) to its evolution in a control group (the other country pairs).
We find that public information contributed to the substantial increase in international trade flows observed during our period of study (1850–1914). In our baseline specification (gravity equation), the value of trade flows increases by an additional 30 percent when two countries are included in the global network of news diffusion, in addition to being connected by a telegraph. Our results also corroborate estimates from previous studies that documented a positive effect on trade of the telegraph: we find that, even in the absence of coverage by a global news agency, trade flows increase by over 20 percent when two countries become connected by a telegraph.
Finally, we provide evidence supporting the hypothesis that the trade effect is indeed driven by an increase in the quantity of information available about foreign countries. First, we document an increase in trade volatility after the connection, in line with the findings and theoretical predictions of Steinwender (Reference Steinwender2018). This is consistent with a better ability of traders to adapt to market conditions. Second, using data from French newspapers, we find an increase in the coverage of a foreign country that is more related to trade keywords once this country benefits from a telegraph connection and news agency coverage.
This paper builds on a large literature documenting the effect of information frictions on various economic outcomes, starting with a reduction in price dispersion (Jensen Reference Jensen2007; Ejrnæs and Persson 2010). Linking this literature to international trade, Allen (Reference Allen2014) shows that, in addition to the usual effect on price dispersion, a decrease in information frictions positively affects the volume of trade. More recent approaches to incorporating information frictions in trade models include Dasgupta and Mondria (Reference Dasgupta and Mondria2018) and Lenoir, Martin, and Mejean (Reference Lenoir, Martin and Mejean2022). Empirically, a negative link between trade flows and communication costs is established by Malgouyres, Mayer, and Mazet-Sonilhac (Reference Malgouyres, Mayer and Mazet-Sonilhac2021), who make use of the sequential arrival of high-speed internet in French cities. Unlike our approach, these papers, however, think of information frictions either as search costs or as a mixture of search costs and a constrained information set, and they do not attempt to distinguish these two dimensions.
Our work highlights the importance of explaining export decisions based on the information set available to firms, a dimension that the literature recently started exploring. Indeed, trade decisions crucially rely on the expectations the firm forms about the profits it will earn by serving the foreign market. While perfect foresight is commonly assumed (firms perfectly predict the profits from exporting), Dickstein and Morales (Reference Dickstein and Morales2018) acknowledge that firms actually use only a restricted set of observable variables to assess their expected profits and study the consequences of enlarging this set of variables. Consistent with our results, they find that more information results in more exports.
Other contributions have explored the economic consequences of the expansion of the telegraph network in the nineteenth century. Our results complement the work of Juhász and Steinwender (Reference Juhász and Steinwender2018), who document an increase in trade flows following the opening of telegraph lines, especially for goods whose characteristics are easily codifiable, suggesting that these openings decreased communication costs. They are also in line with recent work by Wache (Reference Wache2020), who finds a positive effect of telegraph lines connecting the United Kingdom with other countries on financial capital flows from the United Kingdom to these countries. He shows that this effect is mainly driven by the “newspaper channel,” without explicitly considering the role of news agencies. We also build on the seminal paper of Steinwender (Reference Steinwender2018), who demonstrates that the transatlantic telegraph led to price convergence in the cotton market and to better adaptation to demand shocks. She mentions the importance of the “Reuters telegram” provided to traders in the exchanges, but is unable to separate the contribution of these telegrams from that of other communications allowed by the telegraph. Additionally, her work focuses on U.K.–U.S. flows, while we adopt a broader scope, which allows us to further control for potential endogeneity by separating direct and indirect connections.
Access to more and better information about foreign markets can also be likened to improved market access. Important historical changes in market access or trading opportunities have been shown to have significant effects on local economies. For instance, Juhász (Reference Juhász2018) shows that the Napoleonic blockade enhanced the productive capacity of cotton spinning in areas that were more shielded from trade. Similarly, Ellingsen (Reference Ellingsen2025) examines the long-term effects of lifting trade restrictions between Europe and the Spanish Empire in the nineteenth century, highlighting its impact on market integration and urban growth.
The importance of the press as a vector of public information is the subject of a large literature. However, to our knowledge, there is no previous work on the importance of news agencies as providers of valuable economic information. The literature on news agencies has focused on industrial organization aspects of the news agencies’ syndication agreements. Wolff (Reference Wolff1991) describes the historical evolution of the news agency industry. Bakker (Reference Bakker2014) explains how their business model was designed to address the specificities of the news market: it provided a solution to the Arrow information paradox (buyers want to know the information in order to determine how much they are willing to pay, but once the information is revealed, they don’t need to pay anymore).
In the next section, we present the historical context of our analysis and our data. The third section details our main results, followed by some robustness checks in the fourth section. In the fifth section, we provide evidence that the effect we find can indeed be attributed to an increase in the circulation of information.
CONTEXT AND DATA
Context
THE CREATION OF AN INTERNATIONAL TELEGRAPH NETWORK
The first telegraph system implemented on a significant scale is the optical telegraph of Claude Chappe, which used blades or paddles to transmit information between towers (semaphore telegraph). It was mostly adopted in France, where, in the first half of the nineteenth century, all major cities were linked together, but had little commercial use and international connections. This is why we focus on the electrical telegraph, which appeared in the late 1830sFootnote 4 and quickly became the dominant communication technology, as evidenced by the spectacular growth of the network, both domesticallyFootnote 5 and internationally. The total length of telegraphic wires reached 7 million km in 1913, and the number of messages exchanged followed a similar pattern, rising sharply from 28 million telegrams sent in 1865 to 528 million in 1913.
For long-distance lines, the preferred technology was the submarine cable, because it avoided having to negotiate with countries crossed by the line. The first successful international submarine cable linked France and the United Kingdom in 1851. Governments quickly recognized the importance of the telegraph for international communications and soon started cooperating within multinational instances: the German-Austrian Telegraph Union in 1851, the Western European Telegraph Union in 1855, and finally the International Telecommunication Union (ITU) in 1865, which still operates today as an UN agency. International conventions were adopted to ensure the smoothness of transmissions. For instance, in 1865, Morse code was chosen for all international communications.
The telegraph was a major improvement over the former communication technologies. It was therefore immediately adopted by private agents to conduct their business operations, as highlighted by Wenzlhuemer (Reference Wenzlhuemer2013, p. 84): “from its very inception, the telegraph was intimately connected with the world of business, finance and trade.” Nevertheless, its use was very expensive, and therefore reserved for wealthy individuals and firms, governments, and news agencies.
THE RISE OF GLOBAL NEWS AGENCIES
The emergence of news agencies is intimately linked to the sharp rise in newspaper diffusion, which made the press the dominant channel of information at the time. The first news agency appeared in 1832 and was named after its creator, Charles-Louis Havas. The success of Havas, which quickly established a monopoly in its domestic market (France)Footnote 6 and started expanding its activities to foreign markets, triggered the creation of competing news agencies. Two former Havas employees, Bernhard Wolff and Paul Julius Reuter, started their own businesses, creating respectively the Wolffs Telegraphisches Bureau (1849) in Germany (henceforth referred to as “Wolff”) and Reuters (1851) in the United Kingdom, which quickly gained contracts with newspapers outside of their domestic markets. In the 1850s, the market for international news was therefore an oligopoly with three major players: Havas, Reuters, and Wolff. These three incumbents quickly understood that more profit could be made by colluding, that is, by avoiding duplicate costs of news production in some countries and avoiding competition in some markets. This led to the birth of the international news cartel in 1859.
The main component of the 1859 agreement is that each agency was granted a monopoly position in some countries, meaning that no competitor could sell news to the press (or to local news agencies) in these countries. For instance, Havas was the only agency allowed to sell news in Spain; Reuters and Wolff agreed to voluntarily refrain from contracting in this country. However, a key dimension of the agreement is that the news agencies committed to sharing information coming from their exclusivity zone without fees. Returning to the Spanish example, this means that Havas had to send the news coming from Spain to the two other cartel members. Moreover, to prevent the appearance of any serious competitor, the three colluding news agencies agreed to communicate only with each other; they could not sell news to another competing news agency. Finally, they pledged to develop the telegraphic infrastructure.
This first agreement mostly concerned only European territories; the rest of the world remained fair game. News agencies were free to collect and sell information in the neutral territories, but there was no systematic exchange of information between them for these territories. Over time, however, the agreement was reshaped to incorporate new markets that the news agencies deemed profitable. The main extensions occurred in 1867, 1876, 1889, and 1902. On each occasion, new countries were added to the cartel. Table A1 (in the Online Appendix) indicates the countries that were added by each cartel agreement. Additionally, two news agencies joined the cartel: Associated Press (AP) in 1859 and the Korrbureau in 1867. The cartel slowly dislocated in the aftermath of WWI. After the conflict, Wolff lost its territories, which were shared between the still highly cooperative duo Reuters and Havas. But AP and the other U.S. news agencies (United Press and International News Service) put more pressure on the historic European duo. In the 1927 cartel agreement, many countries became shared territories. The early 1930s dealt the final blow to the cartel, which officially ceased to operate in 1934. Nowadays, the market is still an oligopoly, with Reuters and AP by far the biggest players and Agence France Presse (AFP) (formerly Havas) as the third player.
With the news agency cartel, for the first time, a systematic collection and transmission of information across countries is in place. Even though the cartel reduced competition in each local market, it made the coverage of the country profitable.Footnote 7 The cartel organization also implied a level of information sharing across the global news agencies that arguably would not have been reached under a more competitive system.Footnote 8 The effect on quality is according to Bakker (Reference Bakker2014) because “existing firms may spend more on their fixed and sunk costs to increase quality, as the reward for quality has now become higher.”
News agencies effectively shared the news collected in their exclusive geographical areas. In some cases, cooperation was even higher; Reuters and Havas entered into a joint-purse agreement in 1870. According to Bakker (Reference Bakker2014) and Allen (Reference Allen2013), this organization allowed for an increase in the coverage area, quality, and quantity of information. The formal inclusion in the cartel matters since, even though a neutral territory could be served by a news agency, this situation was unlikely, given that the market was less likely to be profitable.
Crucially, news agencies were private businesses, and as such, profit maximization remained their primary objective, even though there may have been pressures from their domestic governments on some occasions, especially during periods of conflict. Since none of the news agencies was state-owned, the decision to add a country to the cartel was not directly taken by governments. This does not mean that countries were added independently of diplomatic or economic considerations, but it means that the costs and benefits for the news agency were key factors in the decision. The case of South America points in this direction: South America, at the time more economically and politically linked to Great Britain, was given to Havas to compensate for the fact that Reuters obtained large territories in Asia.
As Figure 1 illustrates, newspapers used the global news agencies as their main, and often sole, source of foreign information. Indeed, it was too costly for each newspaper to collect foreign news on its own.Footnote 9 They could either be direct subscribers to the international news agency’s services or clients of a national news agency, which, in turn, relied on a global news agencies for foreign news. Government or private organizations could also subscribe to foreign news services from the global news agency serving their country.
EXTRACT FROM THE MORNING POST, 02/29/1892
Notes: News are available from all around the world through the “Reuter’s telegrams,” including from a country that is not part of Reuters’ exclusive distribution area (France).
Source: British Newspaper Archive.

NEWS AGENCIES AND TELEGRAPH COMPLEMENT EACH OTHER
The reduction in information friction is fully realized when two countries are both covered by a news agency and linked by a telegraph. In the absence of a telegraph line, news agencies do not have the ability to send news swiftly from one country to another. Conversely, in the absence of news agencies, information can flow among privileged users, but not systematically and with the large audience reached by the newspapers.
Because the telegraph was at the core of the news agency’s operations, the geographic extensions of the cartel coincided with the development of the telegraph network. The motto of Paul Julius Reuter was clear: “Follow the cable” (Wenzlhuemer Reference Wenzlhuemer2013, p. 90). The cartel started by dividing Europe, where the telegraph network was quite dense. Then, South America and Australia were included in 1876, a few years after being linked to Europe by submarine cables (in 1874 for South America and 1872 for Australia). It does not, however, imply that all countries added to the cartel were already connected by a telegraph.Footnote 10 The telegraph provided the speed, reliability, and privacy necessary for the news agencies. The link between news agencies and the telegraph is so tight that they were often referred to as “telegraphic news agencies,” and sometimes even played an active role in the construction of new telegraph lines.Footnote 11
Without the news agencies, a systematic and efficient transmission of information cannot take place, and the impact of the telegraph is restricted to its use as a communication device for those who can afford it. Indeed, sending telegrams was very expensive and therefore de facto reserved for the most important and well-established traders, while the press was relatively cheap and accessible to any potential trader. The role of newspapers as providers of public information is explicitly acknowledged by Ejrnæs and Persson (2010): “A flourishing commercial press turned what used to be exclusively or privately held knowledge into publicly accessible information. While the larger merchants’ houses had access to telegraph transmission directly, others relied on ‘cable news’ reported in the press.”
Thanks to the telegraph, news agencies were able to transmit information considerably faster than before, especially for very distant countries. In Online Appendix Figure A1, we plot the average delay between the date of an event and the date of publication of this event in the Time, a London newspaper. The dramatic drop in transmission times between London and South America coincides with the opening of the 1874 telegraph between Europe and South America. Australia was finally connected with Europe in 1872. Both South America and Australia entered the coverage of news agencies in 1876. From 1880 onward, information is shared within days, compared with months a few decades earlier.
Data
TRADE DATA
Information on historical bilateral trade flows comes from the TRADHIST database (Fouquin and Hugot Reference Fouquin and Hugot2016), which combines data from previous databases with novel information extracted from primary sources (manuscripts from the customs archives). It also contains several bilateral variables linked to trade frictions, such as distance. In addition to its extensive coverage of past trade flows, TRADHIST has the desirable feature that it gives preference to importer reported data, when available, which ensures higher accuracy.
We made two modifications to the original dataset. First, because our analysis relies heavily on time variation, it was crucial to ensure consistency over time among the countries, so we grouped them according to the largest existing legal entity over the period. For instance, Sweden and Norway formed a single kingdom until 1905, at which point Norway became an independent country, so we combined them into a single entity, “Sweden-Norway.” We obtained the trade flows of the newly formed entities by summing the trade flows of their components: trade flows between “Sweden-Norway” and Denmark after 1905 are the sum of trade flows between Sweden and Denmark and trade flows between Norway and Denmark. Second, we re-coded the variables indicating bilateral colonial ties to ensure greater accuracy.
Our analysis starts in 1850, nine years prior to the first cartel agreement (1859) and 15 years after the creation of the first news agency, Havas, in 1835. It ends in 1914, since WWI is known to have significantly disrupted trade patterns, and the cartel agreements were de facto less binding after 1918, even though they still formally existed. Over this period (1850–1914), five cartel agreements were struck: in 1859, 1867, 1876, 1889, and 1902. Our baseline unit of analysis is a directed pair of countries, that is, a combination exporter–importer (France
 Uruguay, for instance). Throughout the paper, we often refer to these pairs of countries as dyads. The country of origin (exporter) is indexed by o, and the destination country (importer) by d.
NEWS AGENCY DATA:
We hand-coded the geographic coverage of the news agency cartel based on information provided in Wolff (Reference Wolff1991). More precisely, we defined a dummy variable NewsAgency odt taking the value 1 when the importer and the exporter are covered by a news agency participating in the international news exchange agreements. This bilateral variable is not directed: if NewsAgency odt = 1, then NewsAgency dot = 1. Colonies are not systematically mentioned in the cartel agreements, so it is hard to determine whether they were actually covered by a news agency or not. Therefore, in our baseline specification, we set the NewsAgency dummy to 1 only for countries whose status is explicitly stated in Wolff (Reference Wolff1991).
In Figure 2, we plot the number of countries mentioned in the cartel agreements and the number of dyads in which both countries are covered by a news agency. As expected, the coverage increases over time, and, more specifically, rises sharply after each extension of the cartel agreements. The largest jump corresponds to the 1876 agreement, since this is the date when many countries were added to the cartel (South America and large parts of Asia).
EVOLUTION OVER TIME OF THE NEWS AGENCY COVERAGE
Notes: Vertical dotted lines denote years in which the geographic coverage of the news agencies’ syndication agreement is extended. Panel (a): We count the number of countries that are recorded in our trade dataset (CEPII TRADHIST), either with a positive trade flow or with a zero trade flow (countries without trade information are not included) Panel (b): We count the number of country pairs (dyads) that are recorded in our trade dataset (CEPII TRADHIST), either with a positive trade flow or with a zero trade flow (country pairs without trade information are not included). The full line counts the number of dyads included in the news agencies’ syndication agreement; the dashed line counts the dyads that are covered by the same news agency and the dotted line corresponds to the dyads in which the importer and the exporter are covered by the same news agency and one of the countries hosts the headquarters of the news agency. Categories are mutually exclusive (i.e., for instance the news agencies count excludes dyads covered by the same news agency).
Sources: CEPII TRADHIST, Journal Télégraphique, Bureau international des administrations telegraphiques and authors’ data collection.

TELEGRAPH DATA
Data on international telegraph links comes from two sources. For the submarine telegraph cables, we rely on data collected by Roland Wenzlhuemer, who kindly agreed to share it with us. His data originally stems from the Journal Télégraphique, a monthly publication by the International Telegraph Union (ITU). In some issues, an Appendix is available with an exhaustive list of the submarine cables in use and the date on which they started operating.Footnote 12 The last nomenclature dates back to 1903, before the end of our sample, but at this time the main submarine cables had already been laid down, and most of the countries were already telegraphically connected. Regarding the terrestrial telegraphic lines, no such nomenclature is available, so we had to rely on the visual analysis of maps from the “Bureau international des administrations télégraphiques,” digitized and made available by the Bibliothèque nationale de France (BnF). The list of the maps we used is available in the Online Appendix, along with one example of such maps (Online Appendix Figure A3). The first map dates back to 1856 and the last one to 1912. Finally, in order to start our sample in 1850, we complement the two previously-mentioned sources with the list of the first international telegraphic lines from Wolff (Reference Wolff1991).
We define a dummy variable DirectTelegraph odt , taking the value one if a telegraph links country o directly to country d at date t. For the submarine cables, we know for sure the first year in which the two countries are linked since the construction dates are given in the nomenclatures. For the terrestrial cables, we assume that DirectTelegraph odt = 0 until the first time we see the telegraph on a map. To clarify, the first telegraph between Chile and Argentina was built in 1871.Footnote 13 We first see it on the 1875 map, so we code DirectTelegraph ARG,CHL,t = 0 until t = 1874. Nevertheless, given the relatively small time span between each map, the imprecision should be small. Since telegraphs can always be used in both directions, the link is symmetric (if country o is connected to country d, then country d is connected to country o).
Based on the direct connections data, we build a dummy variable indicating whether any pair of countries is indirectly connected, meaning that the two countries are connected either directly or via one or more intermediary countries, that is, they belong to the same connected sub-graph. For instance, if DirectTelegraph ok = 1 and DirectTelegraph kd = 1, then Tel od = 1 even if DirectTelegraph od = 0. In more formal terms, two countries o and d are considered indirectly connected if there exists at least one path of any length n that connects o to d.
Figure 3 depicts the number of countries with at least one international telegraph connection (left-hand side) and the number of dyads connected by the telegraph (right-hand side). We distinguish between the dyads connected by a submarine cable, the dyads directly connected (by land or submarine cables), and the dyads that are directly or indirectly connected. In all cases, the number of connections increases, but the number of direct connections lags far behind the total number of connections. This is due to the network structure: adding a new direct link is likely to create more than one indirect link.
EVOLUTION OVER TIME OF THE TELEGRAPH COVERAGE
Notes: Panel (a): We count the number of countries that are recorded in our trade dataset (CEPII TRADHIST), either with a positive trade flow or with a zero trade flow (countries without trade information are not included) Panel (b): We count the number of country pairs (dyads) that are recorded in our trade dataset (CEPII TRADHIST), either with a positive trade flow or with a zero trade flow (country pairs without trade information are not included). The full line counts the number of dyads that are connected by a telegraph, directly or indirectly; the dashed line counts the dyads that are directly connected. Categories are mutually exclusive.
Sources: CEPII TRADHIST, Wenzlhuemer and authors’ data collection.

Our telegraph dummy does not account for the quality and speed of the telegraphic connection between countries, nor does it inform us about how much information is exchanged between countries. Nevertheless, it reflects the ability of two countries to communicate in a fast and reliable manner through this new technology. Most importantly, it is a bilateral measure, unlike earlier attempts such as Lew and Cater (Reference Lew and Cater2006), which relied on unilateral variation.Footnote 14
MAIN RESULTS
Estimation
A replication package for our results is available online (Cotterlaz and Fize 2026).
To determine the effect of news agencies and telegraph on bilateral trade, we estimate panel gravity equations, which constitute the standard approach in the international trade literature:

We regress bilateral trade flows at the exporter × importer × year level (subscript odt) on our variables of interest X odt (news agencies and telegraph coverage), including a set of exporter × year, importer × year, and country pair fixed effects (FE ot , FE dt , and FE od ). The inclusion of exporter × year and importer × year fixed effects warrants that any country specific variable, such as the quality of institutions, GDP, or productivity, is fully captured by the origin-time or destination-time fixed effects. Similarly, the country pair fixed effects ensure that the specific nature of a relationship between two trade partners, that is, the fact that two countries may trade more together because of cultural or historical factors or for any other idiosyncratic reason, does not affect our estimates of interest, as long as these bilateral factors are not time varying.
Gravity equations for bilateral trade flows can be derived from the main models of international trade (Head and Mayer 2014), so that our results do not rely on any assumption about the most appropriate way to model trade flows in the nineteenth century.
Our variables of interest are a dummy variable indicating that the country pair is covered by a global news agency (NewsAgency odt ), a dummy variable indicating that the country pair is connected by a telegraph (Telegraph odt ), and the interaction term between these two dummy variables. If news agencies and telegraphs are complementary, because the telegraph allows for more efficient communication among the network of global news agencies, while news agencies provide content that can be shared with a wider audience than private telegrams, the effect of the interaction term NewsAgency odt × Telegraph odt on trade is expected to be positive.
NewsAgency odt × Telegraph odt is not captured by the fixed effects since its value changes over time within a dyad and over trade partners within a country-year. The signs of the coefficients on NewsAgency odt and Telegraph odt could be either positive or null. It would be positive if the sole fact of being covered by a news agency (or benefiting from a telegraphic connection) increases the amount of information transmitted and, therefore, trade, or null if only the conjunction of the two matters.
News agency coverage and telegraphic links could be correlated with changes in the colonial ties linking both countries, which are in turn linked to trade flows. These variations in colonial ties are not absorbed by the dyadic fixed effects since they vary over time during our period of interest; therefore, failing to account for those ties may result in an omitted variable bias. As a consequence, in our baseline specification, the vector of time-varying variables, X odt , also includes a dummy variable indicating a conflict between the country pair, taken from the Correlates of War dataset (ReidSarkees and Wayman Reference ReidSarkees and Wayman2010), and three controls for colonial ties: BothColonized odt indicates whether both countries currently are colonies (not necessarily of the same empire), SameColonizer odt takes value 1 if the importer and the exporter belong to the same colonial empire, that is, are currently colonized by the same country, and finally MetropoleColony odt captures the specific metropole-colony ties (the importer is the colonizer of the exporter, or vice-versa).
To summarize, our baseline identification strategy relies on a panel gravity estimation, whose rich structure of fixed effects controls for potential confounding factors at the dyadic level and at the country-year level. Estimates for the trade effect of news agencies and telegraphs are identified from time variations in trade flows within a pair of countries and therefore rely solely on dyads whose status changed over time. Concerning news agencies, the overwhelming majority of these changes are entries into the syndication agreements. Very few countries are reassigned to another news agency, and no country is dropped from the syndication agreements. For telegraphic connections, the changes come from telegraphic link creations.
To estimate Equation (1), two methods can be used. The first one consists of log-linearizing. Then, our coefficients of interest can be estimated through OLS. Nevertheless, this OLS estimator may be biased under heteroskedasticity (Santos Silva and Tenreyro 2006). To overcome this, one can use a Poisson pseudo maximum-likelihood estimator (henceforth PPML). Besides the fact that it corrects for the heteroskedasticity driven bias affecting the OLS estimator, the PPML estimator differs from its OLS counterpart on two accounts: first, the weight of large trade flows: PPML gives more importance to large trade flows than OLS (Head and Mayer 2014) and second, the ability to handle zero trade flows: because it relies on a log-linearization, OLS requires to drop the zeros, while PPML does not, allowing for the incorporation of an extensive margin in the estimates (by extensive margin, we mean the switch from zero trade to strictly positive trade for a given dyad).
PPML is our preferred estimator thanks to its ability to correct for the heteroskedasticity driven bias, but we also provide additional results based on OLS estimations. Since PPML puts more weight on larger trade flows, we follow the suggestion of Sotelo (Reference Sotelo2017), who proposes using market shares (i.e., trade flow between the two countries divided by total imports of the destination country) to ensure that countries are treated more equally. This makes the weighting scheme in our PPML estimations more comparable to the one in the OLS estimations. These trade shares are denoted S odt in the rest of the paper and are defined as the share of imports of country d coming from country o:

In our trade dataset (TRADHIST), some zero trade flows are recorded. They correspond to cases in which the creators of TRADHIST considered that there was indeed a null trade flow between the two countries, that is, the missing trade flows were not due to a lack of data. We use this information on zero trade flows as a robustness check in our baseline specification.
RESULTS
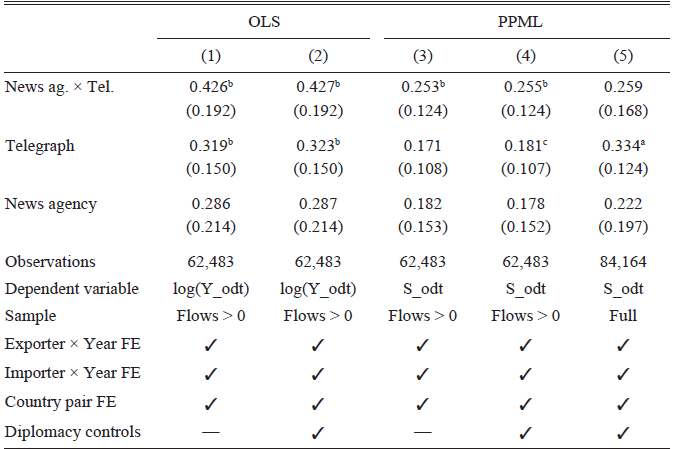
Table 1 presents our main results. We estimate the panel gravity model from Equation (1) using alternatively an OLS estimator in Columns (1) and (2) and a PPML estimator in Columns (3) to (6). We also present results with or without controlling for colonial ties and with different approaches to dealing with zero trade flows.
EFFECT OF NEWS AGENCIES AND TELEGRAPHS ON TRADE FLOWS, PANEL GRAVITY ESTIMATES (1850–1913)

Table 1 Long description
A table comparing the effect of news agencies and telegraphs on trade flows using different estimators. The table has 6 columns and 7 rows, including headers. Column headers are OLS and PPML with sub-columns (1), (2), (3), (4), and (5). Row labels include News ag. x Tel., Telegraph, News agency, Observations, Dependent variable, Sample, Exporter x Year FE, Importer x Year FE, Country pair FE, and Diplomacy controls. Row 1: News ag. x Tel., 0.426b (0.192), 0.427b (0.192), 0.253b (0.124), 0.255b (0.124), 0.259 (0.168). Row 2: Telegraph, 0.319b (0.150), 0.323b (0.150), 0.171 (0.108), 0.181c (0.107), 0.334a (0.124). Row 3: News agency, 0.286 (0.214), 0.287 (0.214), 0.182 (0.153), 0.178 (0.152), 0.222 (0.197). Row 4: Observations, 62,483, 62,483, 62,483, 62,483, 84,164. Row 5: Dependent variable, log(Y_odt), log(Y_odt), S_odt, S_odt, S_odt. Row 6: Sample, Flows > 0, Flows > 0, Flows > 0, Flows > 0, Full. Row 7: Exporter x Year FE, ✓, ✓, ✓, ✓, ✓. Row 8: Importer x Year FE, ✓, ✓, ✓, ✓, ✓. Row 9: Country pair FE, ✓, ✓, ✓, ✓, ✓. Row 10: Diplomacy controls, —, ✓, —, ✓, ✓.
Notes: Data is aggregated at the country pair × year level. The dependent variable is the log of the bilateral trade flow in Columns (1) and (2) and the share of imports of country d coming from country o (S odt ) in the remaining Columns (3) to (5). All estimations include destination × year, origin × year and country pair fixed effects. NewsAg. × Tel. is a dummy indicating that both countries are covered by a news agency and linked by a telegraph. Standard errors are clustered by country pair. Significance levels: ap < 0.01; bp < 0.05; cp < 0.1.
Sources: CEPII TRADHIST, Wenzlhuemer and authors’ data collection.
Column (4) is, in our view, the most appropriate specification: it corrects for the potential heteroskedasticity driven bias of the OLS estimates and gives an equal weight to all countries thanks to the use of trade shares as the dependent variable. With this specification, we find that the telegraph, on its own, increased trade by 20 percent (e 0.181 – 1 = 0.20, see row 2 of Column (4)); the coefficient on news agencies is not significant (a point we comment on later), while the combination of news agencies and telegraph resulted in a magnified increase, 29 percent additional trade. The variable identifying the improvement in information sharing between the two countries is the interaction term, and the fact that its effect is positive and significant confirms that improving the access to public information fosters trade.
In Columns (1) and (3), we present results obtained when omitting the variables controlling for diplomatic ties. These controls include three dummy variables reflecting colonial ties: one indicating that both countries are colonized (potentially by a different country), the other one that they are colonized by the same country (they belong to the same colonial empire), and the last one that a country is a colony and the other one is its colonizer. The fourth control variable is a dummy variable indicating that both countries are in a conflict, extracted from the COW dataset (ReidSarkees and Wayman Reference ReidSarkees and Wayman2010). Comparing estimations with or without diplomacy controls reveals that the estimates are very close in both situations, suggesting that the correlation between our variables of interest and diplomatic relationships is low.
The results are qualitatively unchanged when we use an OLS estimator. The presence of both a news agency and a telegraph in both countries still has a positive and significant effect on trade, which is even a bit larger than the one found with a PPML estimation (a 53 percent increase), but is also slightly less precisely estimated. For the telegraph, the effect is much larger than the PPML estimate (38 percent more trade).
In Column (5), we include the most reasonable zero trade flows (the ones included in TRADHIST). In this specification, the point estimate for our interaction term is very close to its value in PPML specifications where no zeros are included, but the estimate is not significant due to larger standard errors. This suggests that the zeros recorded in our dataset are rather noisy, which is why we do not use these zeros in the following estimations.
The contribution of this paper is to establish the positive effect of a shock on information, identified by the joint presence of a news agency and a telegraphic link between the two countries. On top of being positive and significant, this pure effect of information is relatively large (a 29 percent increase in trade in our preferred specification). Interestingly, this magnitude is in line with the results of Dickstein and Morales (Reference Dickstein and Morales2018), who find that, for contemporary trade in chemicals, switching from minimal information to perfect foresight would result in aggregate exports rising by 25.1 to 33.5 percent. With a value of –5 for the trade elasticity of trade flows with respect to trade costs,Footnote 15 this 29 percent increase in trade value corresponds to a 5 percentage points decrease in the iceberg trade cost.Footnote 16
The positive effect of telegraphs on trade is not a novel finding of this paper, but it confirms in a larger sample and over a longer time-horizon the results of Steinwender (Reference Steinwender2018). Her estimates imply an increase of 87 percentFootnote 17 in cotton exports from New York to Liverpool after the opening of the transatlantic telegraph, an effect that incorporates both the reduction in communication costs and the more efficient provision of information, and that should therefore be compared to the one we find when summing the effects of the telegraph and of the interaction term.
The effect of news agencies per se (i.e., in the absence of telegraph) on trade is always positive, but never statistically significant. This suggests that, in the absence of a telegraph connection, the news agencies had more difficulty sharing fresh information. The positive but noisy estimate could also suggest an heterogeneous effect of news agency coverage without telegraph, with probably a small effect for more distant countries where the boat connection took more time (as Online Appendix Figure A1 indicates). “Important news traveled along telegraph lines. And wherever there were such lines, there was also the latest news” (Wenzlhuemer Reference Wenzlhuemer2013, p. 91). The corollary is that wherever there was no telegraph line, the news agencies were not able to operate in a fully satisfactory manner.
ROBUSTNESS CHECKS
Focus on Indirect Connections
The timing of construction of a telegraphic line may be linked to anticipated trade flows, or to past trade flows between the two countries that would become connected. Even though the technical difficulties of the construction process made the precise timing of a successful telegraph opening hard to predict, especially for submarine cables, as argued by Steinwender (Reference Steinwender2018), our approach relies on long-run time variations, which means that this short-run randomness in opening date may not be sufficient to ensure exogeneity of our explanatory variable.Footnote 18
To alleviate these concerns, we run a robustness check focusing on indirect connections. While countries may broadly control the date at which a direct telegraphic link is established between them, they have less power in deciding when the last missing segment to create a telegraphic path between them will be built. For instance, Brazil and China became indirectly linked in 1874, after the completion of a transatlantic telegraph between Portugal and Brazil (with relays in Madeira and Cabo Verde). Arguably, trade between China and Brazil had little influence on the timing of this connection. Therefore, we estimate separately the effect of direct and indirect connections by adding a dummy variable DirectTelegraph odt that indicates a direct telegraph link. The coefficient on Telegraph odt then captures exclusively the effect of indirect links and should provide a more accurate estimate of the causal effect.
Similar endogeneity concerns can be raised regarding the inclusion dates of news agencies: the decision to add a country to the syndication agreement is linked to the expected profits from selling news in that country, which in turn may be linked to trade flows. Note, however, that to threaten our identification, this link has to be truly bilateral: the fact that countries are added based on their total economic size is not an issue in our setting since we include time varying origin and destination fixed effects in our estimations. Also, additions to the news agencies’ syndication agreements occurred in waves: groups of countries were added in five staggered extensions, so the precise date of inclusion is unlikely to be determined by the concerned countries.
If there was, nevertheless, a link between the date at which a pair of countries is included in the syndication agreement and bilateral trade flows, it could lead either to over- or underestimation of the causal effect. If two countries are included because of the prospect of large trade flows (and high demand for bilateral information), then we would overestimate the information effect. Conversely, if two countries are included because they faced an idiosyncratic positive shock to their past trade flows, we would underestimate the information effect.
Endogeneity concerns on the date of inclusion in the news agencies’ syndication agreement can be addressed with a strategy akin to the distinction between direct and indirect telegraphic links, exploiting the fact that influencing the decision is easier for some country pairs than for others. More specifically, it is easier to lobby a domestic firm than a foreign firm, and therefore attempts to influence the decision on which countries to include in the syndication agreement are less likely to succeed for countries that do not host the headquarters of a global news agency. For instance, it would be harder for Spain than for France to influence the choices of the French news agency, Havas. Our strategy is, therefore, to decompose the country pairs into those in which one of the countries hosts the headquarters of the news agency and those in which neither country hosts the headquarters of the news agency.
The date of treatment is more likely to be endogenous in the former group, in which the news agency is a domestic firm for one of the countries, than in the latter group, in which the news agency is a foreign operator for both countries. For instance, Argentina and Australia started being included in the news agency network in 1876, arguably an exogenous timing since the country pair became linked without any particular intent as a by-product of the agreement’s extension. To isolate the dyads in which we could fear endogeneity, we add a dummy variable HeadquarterNewsAgency odt , taking the value 1 when both countries are covered by the same news agency and one of the countries is the headquarters of the news agency.Footnote 19
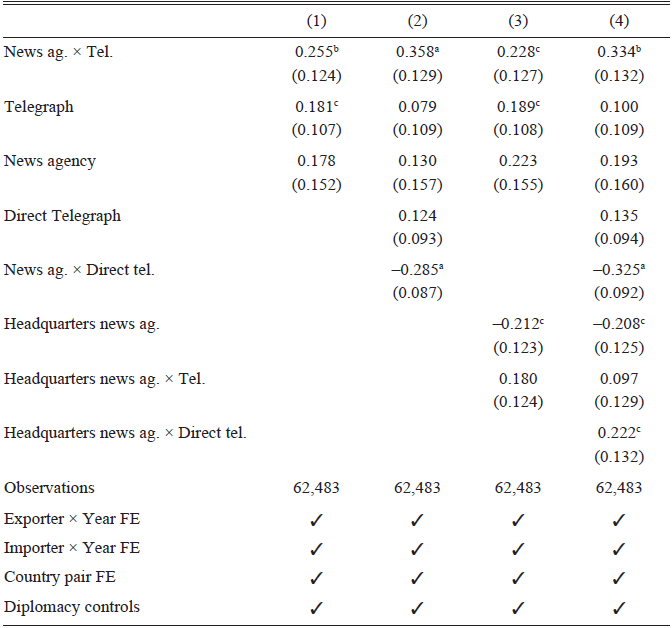
The results from this approach are summarized in Table 2, where we start from our preferred specification (Column (4) of Table 1) and allow in subsequent columns for heterogeneous effects for direct and indirect connections, first for the telegraph (Column (2)), then for news agencies (Column (3)), and finally for both (Column (4)).
EFFECT OF NEWS AGENCIES AND TELEGRAPHS ON TRADE FLOWS, SEPARATING DIRECT AND INDIRECT CONNECTIONS

Table 2 Long description
The table has four columns and nine rows, including headers. Column headers are labeled (1), (2), (3), and (4). Row labels include News ag. x Tel., Telegraph, News agency, Direct Telegraph, News ag. x Direct tel., Headquarters news ag., Headquarters news ag. x Tel., Headquarters news ag. x Direct tel., and Observations. Each cell contains numerical values with standard errors in parentheses. The table also includes footnotes indicating the inclusion of Exporter x Year FE, Importer x Year FE, Country pair FE, and Diplomacy controls. Row 1: News ag. x Tel., 0.255b (0.124), 0.358a (0.129), 0.228c (0.127), 0.334b (0.132). Row 2: Telegraph, 0.181c (0.107), 0.079 (0.109), 0.189c (0.108), 0.100 (0.109). Row 3: News agency, 0.178 (0.152), 0.130 (0.157), 0.223 (0.155), 0.193 (0.160). Row 4: Direct Telegraph, 0.124 (0.093), , , 0.135 (0.094). Row 5: News ag. x Direct tel., -0.285a (0.087), , , -0.325a (0.092). Row 6: Headquarters news ag., , , -0.212c (0.123), -0.208c (0.125). Row 7: Headquarters news ag. x Tel., , , 0.180 (0.124), 0.097 (0.129). Row 8: Headquarters news ag. x Direct tel., , , , 0.222c (0.132). Row 9: Observations, 62,483, 62,483, 62,483, 62,483.
Notes: In Column (1), we reproduce our baseline estimation, which is Column (4) of Table 1. In Column (2), we separate direct and indirect telegraphic links. In Column (3), we separate direct and indirect news agency links: direct links correspond to country pairs where one of the countries hosts the headquarters of the news agency. In Column (4), we combine both approaches, separating direct from indirect links for both the telegraph and news agencies. Standard errors are clustered by country pair. Significance levels: ap < 0.01; bp < 0.05; cp < 0.1.
Sources: CEPII TRADHIST, Wenzlhuemer and authors’ data collection.
We start by introducing indirect and direct telegraphic connections separately (Column (2)). Direct telegraphic connections increase trade flows slightly more than indirect telegraphic connections (from row number 4, Column (2), the additional effect of having a direct telegraphic connection, compared to an indirect one, is e 0.124 – 1 = 0.13, that is, a 13 percent additional increase in trade). For this group of dyads, however, the additional effect of news agencies is lower than for the groups of dyads that are connected by an indirect telegraph: dyads connected by an indirect telegraph see trade increase by 43 percent (e 0.358 – 1, see row number 1), while the trade increase is 25 percent lower (e –0.258 – 1, see row number 5) for dyads that are connected by a direct telegraphic link. So overall, the effect of the interaction term news agency and telegraph remains positive for the dyads with a direct telegraph connection, but less positive than for dyads with an indirect telegraphic connection. Turning to the news agencies (Column (3)): for country pairs that host the headquarters of a news agency, the trade effect of news agencies is lower than the one observed in other country pairs (row 6, Column (3)), but the interaction term is higher for those dyads (row 7, Column (3)), suggesting that these dyads benefit less from the news agencies’ coverage alone but more from the combination of news agencies’ coverage and telegraphs.
Our main results are presented in Column (4) where, since we separated the direct connections from the indirect connections, the first row presents the results of an estimation where the interaction term is purged from direct connections. It remains positive and significant, with a magnitude close to our baseline estimate (trade increases by an additional 40 percent in the presence of both a news agency and a telegraph, e 0.334 – 1, row, 1 Column (4)). This is reassuring since this effect is estimated on the subsample of country pairs for which our variable of interest is more likely to be exogenous.
Control for Trade Policy and Time Varying Transport Costs
TRADE POLICY
Another potential threat to our identification is that the inclusion of a pair of countries in the news agencies and telegraph network could be related to trade protection within this pair of countries (bilateral trade policy between two countries could be correlated to the news agency and telegraphic links between these two countries). In this setting, our estimation would suffer from an omitted variable bias.
Luckily, the TRADHIST database provides information on the average tariffs for 8,000 dyads-year. Tariffs are not the only tools of trade protection, but they are the easiest to quantify and serve as a good proxy for the bilateral trade policy between two countries. We use this tariff data as an additional control variable in a slightly modified version of our main specification and check whether including this additional control variable affects our coefficients of interest. Unfortunately, tariff data in TRADHIST are provided only for a handful of importing countries.Footnote 20 Because of this small number of importing countries available in the data, it is impossible to include the exporter × year fixed effects we use in our main specification. Therefore, we have to use a lighter structure of fixed effects, namely importer × year and exporter × importer fixed effects. To summarize, the equation we estimate is:

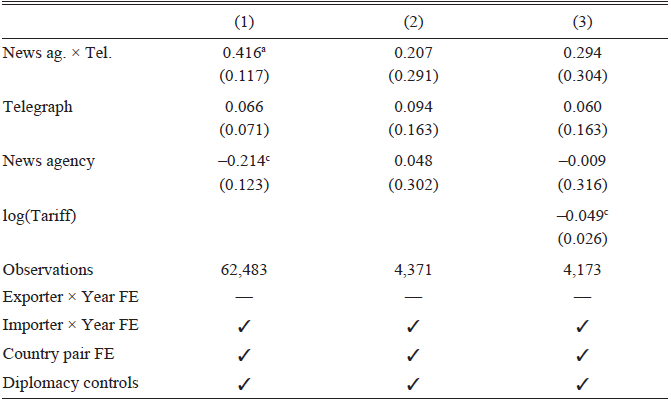
Our results are presented in Table 3. In the first column, we start from something very close to Column (4) of our baseline results: we estimate PPML on trade shares, using the sample of all flows recorded in TRADHIST, except that we do not include exporter × year fixed effects. As can be seen, the mere fact of removing this set of fixed effects has drastic consequences on our estimates. But there is no valid reason to omit these exporter × year fixed effects: Column (1) is only disclosed to serve as a benchmark with other estimations that will use the same specification.
EFFECT OF NEWS AGENCIES AND TELEGRAPHS ON TRADE FLOWS, CONTROLLING FOR TARIFFS

Table 3 Long description
A table with three columns and six rows of data, plus additional rows for observations and fixed effects. The columns are labeled (1), (2), and (3). The rows include variables such as News ag. x Tel., Telegraph, News agency, and log(Tariff). Each cell contains numerical values and standard errors in parentheses. The table also includes observations and fixed effects for Exporter x Year FE, Importer x Year FE, Country pair FE, and Diplomacy controls. Row 1: News ag. x Tel., 0.416, 0.207, 0.294. Row 2: Telegraph, 0.066, 0.094, 0.060. Row 3: News agency, -0.214, 0.048, -0.009. Row 4: log(Tariff), , , -0.049. Row 5: Observations, 62,483, 4,371, 4,173. Row 6: Exporter x Year FE, , , . Row 7: Importer x Year FE, ✓, ✓, ✓. Row 8: Country pair FE, ✓, ✓, ✓. Row 9: Diplomacy controls, ✓, ✓, ✓.
Notes: In Column (1), we estimate on the full sample a specification very close to our baseline (Column (1) of Table 1), except that we do not include the exporter × year fixed effects. In Column (2), we restrict the sample to those observations for which we have tariff data in the TRADHIST dataset. In Column (3), we add as control variable the log bilateral tariff from TRADHIST, estimating Equation (2). Significance levels: ap < 0.01; bp < 0.05; cp < 0.1.
Sources: CEPII TRADHIST, Wenzlhuemer and authors’ data collection.
In Column (2), we restrict the sample to those observations for which tariff data are available. In Column (3), we include tariffs as an additional control variable. The point estimates are not very different between Columns (2) and (3); if anything, the effect of news agencies on trade increases after controlling for tariffs. This confirms that, in this subsample of the data for which we have tariff information, our estimates of interest are not affected by the inclusion of tariffs. However, in this context, our effect of interest does not hold, which is due both to the inclusion of a lighter set of fixed effects (as suggested by Column (1)) and to the smaller size of the sample (as suggested by the comparison between Columns (1) and (2)).
TIME VARYING TRANSPORT COSTS
Another concern could be that changes in maritime transport technologies could be an omitted variable. Indeed, Pascali (Reference Pascali2017) documented the dramatic effect of the adoption of the steamship on bilateral trade patterns. To address this concern, we add to our baseline specification a control variable accounting for the change in transport time enabled by the switch from sail ships to steamships. This variable is constructed based on data publicly available in Pascali (Reference Pascali2017) replication package; it is equal to the sail transport time before 1870 and the steam transport time after 1870, 1870 being the year identified by Pascali (Reference Pascali2017) as the turning point from sail to steam.

By definition, maritime transport time is only relevant between countries that are connected by sea; therefore, part of our sample is removed when we add this maritime transport time (we lose approximately 30,000 observations out of 84,000).
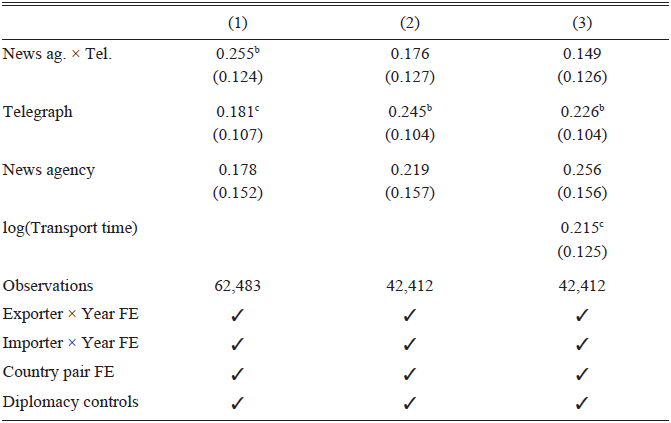
We present the results of this exercise in Table 4. Column (1) reproduces, as a benchmark, our baseline specification (Column (4) of Table 1). In Column (2), we restrict the sample to those observations for which a maritime transport time is available in Pascali (Reference Pascali2017) dataset. This reduces the point estimates, which are no longer significant in this subsample. But interestingly, adding a time varying measure of transport costs (Column (3)) has very little effect on our coefficient of interest, whose point estimate moves from 0.176 to 0.149. This suggests that changes in maritime transport costs play little role in explaining the trade effect we attribute to news agencies and telegraphs, at least for the sample of country pairs that have a maritime connection (in the sample of countries that do not trade by sea, on which we cannot directly use this estimation method, maritime transport time is less likely to be an omitted variable).
EFFECT OF NEWS AGENCIES AND TELEGRAPHS ON TRADE FLOWS, TAKING INTO ACCOUNT HETEROGENEOUS CHANGES IN MARITIME TRANSPORT TIMES ACROSS DYADS

Table 4 Long description
The table presents data on the effects of news agencies and telegraphs on trade flows, taking into account changes in maritime transport times across country pairs. It has three columns and five rows, including a header row. The columns are labeled (1), (2), and (3). The row labels include News ag. x Tel., Telegraph, News agency, log(Transport time), Observations, Exporter x Year FE, Importer x Year FE, Country pair FE, and Diplomacy controls. Each cell contains numerical values or checkmarks indicating the presence of fixed effects. The table shows how different factors influence trade flows, with specific point estimates and their standard errors. The observations count and fixed effects indicators are also provided.
Notes: Column (1): Corresponds to the benchmark, Column (4) of Table 1. Column (2): Same as Column (1), but on the reduced sample for which transport time data is available from Pascali (2017). Column (3): We introduce time varying maritime transport time as an additional control variable. Standard errors are clustered by country pair. Significance levels: ap < 0.01; bp < 0.05; cp < 0.1.
Sources: CEPII TRADHIST, Wenzlhuemer and authors’ data collection.
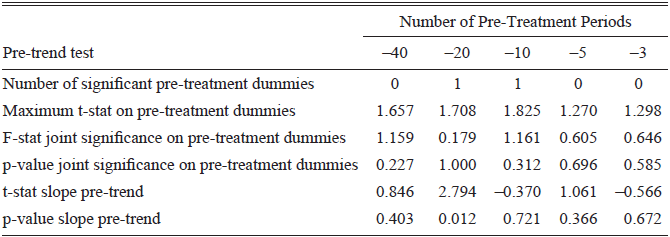
TEST FOR PRE-TRENDS
The validity of our estimates relies on the assumption of parallel pre-trends. Parallel pre-trends are indeed required to attribute to the treatment the different evolution of the outcome of interest between the treated and control groups after the treatment. Without parallel pre-trends, the effect of the treatment could be an artifact of already existing phenomena that differ between the two groups.
In this section, we run a series of tests designed to check whether pre-treatment dummies estimated from an OLS regression reveal a pattern inconsistent with the parallel trend assumption. These tests include: counting the number of significant pre-treatment dummies, checking the significance level of the most significant dummy, running a F-test of joint significance on the set of pre-treatment dummies, and checking that the slope of the linear time trend drawn from these dummies is not significant. We perform these tests for different numbers of pre-treatment periods (from 40 years before treatment to 3 years before treatment).
The results of these tests (Table 5) are reassuring: there is no pattern of pre-treatment dummies being statistically significantly different from zero, joint significance tests reveal that the set of dummies is not statistically different from zero, and the slope of the linear time trend from these pre-treatment dummies is also not statistically significant (except in one specific instance, when including 20 years pre-treatment).
TESTS FOR PRE-TRENDS

Table 5 Long description
A table comparing pre-trend test results across different periods. The table has 6 rows and 6 columns. The columns are labeled as follows: Pre-trend test, Number of Pre-Treatment Periods (-40, -20, -10, -5, -3). The rows are labeled as follows: Number of significant pre-treatment dummies, Maximum t-stat on pre-treatment dummies, F-stat joint significance on pre-treatment dummies, p-value joint significance on pre-treatment dummies, t-stat slope pre-trend, p-value slope pre-trend. Row 1: Number of significant pre-treatment dummies, -40, 0; -20, 1; -10, 1; -5, 0; -3, 0. Row 2: Maximum t-stat on pre-treatment dummies, -40, 1.657; -20, 1.708; -10, 1.825; -5, 1.270; -3, 1.298. Row 3: F-stat joint significance on pre-treatment dummies, -40, 1.159; -20, 0.179; -10, 1.161; -5, 0.605; -3, 0.646. Row 4: p-value joint significance on pre-treatment dummies, -40, 0.227; -20, 1.000; -10, 0.312; -5, 0.696; -3, 0.585. Row 5: t-stat slope pre-trend, -40, 0.846; -20, 2.794; -10, -0.370; -5, 1.061; -3, -0.566. Row 6: p-value slope pre-trend, -40, 0.403; -20, 0.012; -10, 0.721; -5, 0.366; -3, 0.672.
Notes: In this table, we run a series of tests to detect the presence of pre-trends. Each line corresponds to a test, and each column to a number of pre-treatment periods included when running this test. Line 1: We count the number of pre-treatment dummies significantly different from zero at the 10 percent level. Line 2: We provide the highest t-stat among the pre-treatment dummies, for a null hypothesis of a zero coefficient. Lines 3 and 4: F-stat and p value for a test of joint significance of the set of pre-treatment dummies. Lines 5 and 6: t-stat and p value of a test assessing whether the slope of the linear time trend of pre-treatment dummies is zero.
Sources: CEPII TRADHIST, Wenzlhuemer and authors’ data collection.
ACCOUNT FOR THE DYNAMICS OF THE EFFECT
Our results point to a positive impact on the dyadic trade flow after both countries in the dyad enter the coverage of a news agency and obtain a telegraphic connection. We estimate an average effect over the post-treatment years. However, this effect may be heterogeneous over time; it may be increasing or decreasing, immediate or delayed. Therefore, in this section, we rely on estimators that explicitly account for this potential heterogeneity of our effect of our effect over time and allow us to recover the dynamics in an “event-study” design.
The construction of the telegraph network and the extension of the global news agencies cartel progressed over time. The first year in which a pair of countries was both linked by a telegraph and covered by a global news agency differs across pairs of countries, and the dispersion is substantial. This year can be considered a “treatment date.” The fact that not all units in the panel receive treatment at the same time, and that some units are never treated, allows for the use of differences-in-differences tools to estimate the treatment effect.
Our treatment is staggered: new dyads can be treated every year, since the treatment depends on news agencies’ negotiations (there are five different occurrences of these negotiations) and on the creation of a telegraphic connection. We, therefore, observe country pairs entering into the treatment at many points in time. A recent literature alerts us to the fact that two-way fixed effect event study estimation with staggered treatments may suffer biases resulting from “forbidden comparisons.” We, therefore, use alternative estimators immune to those forbidden comparisons, namely Gardner (2022) (henceforth Gardner), Callaway and Sant’Anna (2021) (henceforth CSA), and Borusyak, Jaravel, and Spiess (Reference Borusyak, Jaravel and Spiess2024) (henceforth BJS).
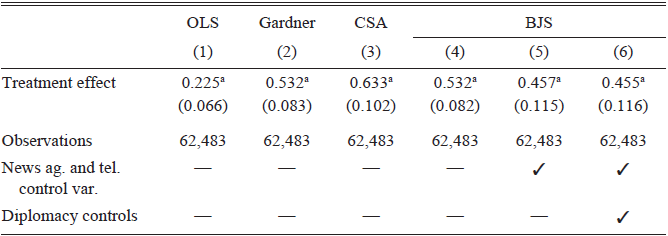
In Table 6, we present average post-treatment effects, estimated either using OLS, Gardner, CSA, and BJS. These results confirm that the effect of news agencies and the telegraph on trade, which we estimate in a diff-in-diff setting, is robust to estimators that take into account the staggered nature of the treatment. In all cases, we find a significant positive average treatment effect. For the BJS estimator (Columns (4) to (6)), which is our preferred estimator thanks to its efficiency, we add as control variables dummies indicating coverage by a news agency and a telegraph (Column (5)) and the set of diplomatic controls used in our baseline specification (Column (6)). Adding these controls reduces our point estimate, but the treatment effect remains largely significant.
DIFF IN DIFF ESTIMATES

Table 6 Long description
The table presents average post-treatment effects estimated using OLS, Gardner, CSA, and BJS. It includes six columns labeled OLS, Gardner, CSA, BJS (4), BJS (5), and BJS (6). Each column shows the treatment effect with standard errors in parentheses, the number of observations, and indicators for news agency and telegraph control variables and diplomacy controls. Row 1: Treatment effect, 0.225, 0.532, 0.633, 0.532, 0.457, 0.455. Row 2: Observations, 62,483 for all columns. Row 3: News agency and telegraph control variables are included in BJS (5) and (6). Row 4: Diplomacy controls are included in BJS (6).
Notes: This table presents the average treatment effect in a diff-in-diff identification strategy, using different estimators. The treatment date is defined as the year in which the dyad is covered by both a news agency and a telegraph. In Column (1), we use a standard OLS estimator; in Column (2) the Gardner estimator; in Column (3) CSA; and in the remaining columns BJS. For the BJS estimator, we provide first an estimation where the treatment is the only explanatory variable(Column (5)); then, we add the news agencies and the telegraph dummy variables (Column (6)); and finally the diplomacy controls used in our previous specifications (Column (7)).
Sources: CEPII TRADHIST, Wenzlhuemer and authors’ data collection.
To gain some insights into the dynamics of the treatment effect, we perform an “event-study”: we estimate the evolution over time of the outcome after the treatment, yielding insights into the duration and evolution of the treatment effect. We estimate the following model:

where s(odt) is the duration separating dyad od in year t from its treatment date (the “time to treatment”). BJS being the most efficient estimator, we use this estimator to recover the dynamics of the treatment. Results of this dynamic estimation are presented in Figure 4. As Roth (Reference Roth2024) and Borusyak, Jaravel, and Spiess (Reference Borusyak, Jaravel and Spiess2024) explain, in these new difference-in-difference estimators, the pre-trends and post-trends are computed differently (asymmetrically), and therefore it can be misleading to display both on a graph. Here we follow their recommendation, and after thoroughly investigating the non-existence of pre-trends, we display only the relevant post-treatment coefficient in Figure 4.Footnote 21
DYNAMIC EFFECT ON TRADE OF THE COVERAGE BY A NEWS AGENCY AND A TELEGRAPH, BJS ESTIMATOR Notes: We estimate the dynamics of the effect of news agencies and telegraph on trade through the BJS method. The treatment date is defined as the year in which the dyad is covered by both a news agency and a telegraph link with France. No control variables are included. Ranges indicate the 95 percent confidence interval. Standard errors are clustered at the dyad level. Sources: CEPII TRADHIST, Wenzlhuemer and authors’ data collection.

The magnitude of the effect is comparable to the one found in our baseline estimations. The fact that it is long-lasting is consistent with the permanent nature of the treatment: once a dyad is connected by a telegraph and a news agency, it never switches back to non-coverage, so the additional flow of information never stops. Moreover, the long-run persistence of the effects of a shock on trade costs has been documented in other contexts (Xu Reference Xu2022; Juhász Reference Juhász2018; Ellingsen Reference Ellingsen2025). The slow increase suggests that, on top of direct knowledge of the foreign market conditions, our information shock affected trade through long-run channels, potentially an increase in Foreign Direct Investments, international migrations, or even a convergence in cultural tastes. The decreasing effect of news agencies in the longer run may come from two potential reasons. First, it may be a composition issue, as in the last years we only estimate the effect of the early treated; it may be that these countries were already trading a lot before the coverage and, therefore, the effect is smaller. Second, it may be that as more and more dyads are treated, the comparative advantage of being treated decreases. We lack the statistical power to really test these hypotheses.
TESTING THE INFORMATION CHANNEL
The previous section identifies a positive and significant impact of the telegraph and news agency coverage on trade. We attribute this effect to improved access to information. However, our variables of interest are only proxies for the increase in the quantity and quality of information. To rule out other channels through which they may have affected trade, we test for the presence of effects that are more specific to the information channel.
In the first sub-section, we document an increase in the volatility of trade flows after coverage by a news agency and a telegraph, consistent with a better ability of traders to adapt to varying market conditions. In a second sub-section, we provide quantitative evidence of an increase in the trade-related press coverage of foreign countries when they become connected by a telegraph and a news agency. This is suggestive evidence that our treatment indeed translates into more public information being available to potential traders.
TRADE VOLATILITY
In this sub-section, we test a prediction of the Steinwender (Reference Steinwender2018) model linking trade and information: a reduction in information frictions increases trade variance. Indeed, exports and imports react to changes in expected demand from other countries. In the extreme case without any information, exporters ship every year the same amount, corresponding to the expected demand. With more information, exporters can respond faster and better to demand fluctuations. With perfect information, the variance of exports should equal the variance of demand, as the exporting country can perfectly adapt to the local demand.
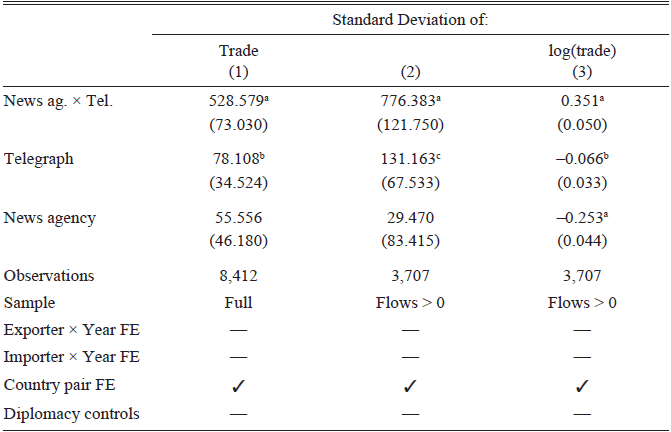
We assess whether trade flows between two countries become more volatile after these two countries are covered by a news agency. To this end, we use several measures of volatility. The first one is the usual sample standard deviation. For each dyad, we compute standard deviations of the value of trade flows by period. Periods are defined based on the news agency and telegraph coverage of the dyad. For instance, a dyad can have three periods: no coverage, then news agency only, then news agency and telegraph. We regress this standard deviation on dummies indicating the coverage status of the dyad, with dyad fixed effects:

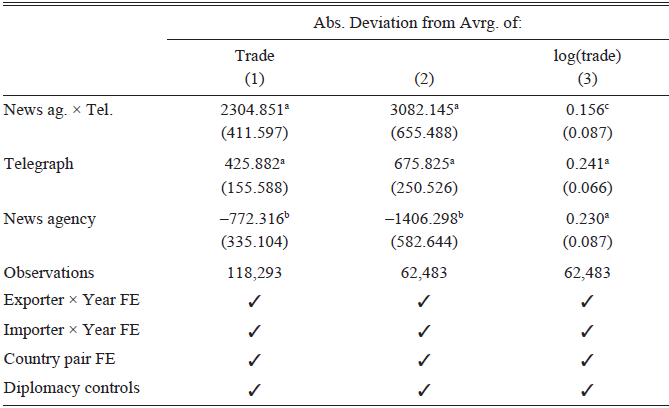
The second measure is the absolute value of the deviation of the trade flow at time t to the mean trade flow in each period (defined by the coverage status of the dyad, as in the first measure):
 . The advantage of this measure is that it allows for several observations within each dyad for each time period. Its drawback is that it can be very noisy, especially with historical datasets that may contain more errors than recent ones. We regress this absolute deviation on dummies indicating the coverage status of the dyad, including destination-year, origin-year, and dyadic fixed effects:

Results are reported in Tables 7 and 8. The level of our volatility measures does not have any meaningful interpretation; we are mostly interested in their change over time. For all possible versions of the outcome variable, we observe a significant and positive impact of the news agency coverage on the volatility of trade flows. Table 7 shows that periods in which a dyad is covered by a news agency and a telegraph are associated with higher standard deviations of the value of trade flows for this dyad. Table 8 documents an increase in the absolute value of deviations from the period average after coverage by a news agency and a telegraph. These results are consistent with the idea that more information is available thanks to the news agencies, which allows trade partners to adapt to the demand shocks.
EFFECT OF NEWS AGENCIES AND TELEGRAPH ON THE STANDARD DEVIATION OF TRADE FLOWS

Table 7 Long description
The table has three columns and four rows of data, plus additional rows for observations, sample details, and fixed effects. The columns are labeled 'Trade', 'log(trade)', and include standard deviation values for different communication methods. The rows are labeled 'News ag. x Tel.', 'Telegraph', and 'News agency'. Each cell contains numerical values representing the standard deviation of trade or log(trade) for the respective communication method. The table also includes observations, sample details, and fixed effects information at the bottom.
Notes: For each dyad, we compute standard deviations of the value of trade flows by period. Periods are defined based on the news agency and telegraph coverage of the dyad (for instance, a dyad can have three periods: no coverage, then news agency only, then news agency and telegraph. We regress this standard deviation on dummies indicating the coverage status of the dyad, with dyad fixed effects. Other fixed effects and control variables cannot be included due to the specific structure of the dataset. Column (1): All trade flows are included. Column (2): We restrict the sample to strictly positive trade flows. Column (3): We use the log of trade flows to compute standard deviations. Standard errors are clustered by dyad. Significance levels: ap < 0.01; bp < 0.05; cp < 0.1.
Sources: CEPII TRADHIST, Wenzlhuemer and authors’ data collection.
EFFECTS OF NEWS AGENCIES AND TELEGRAPHS ON THE DEVIATION FROM PERIOD AVERAGE OF TRADE FLOWS

Table 8 Long description
A table with four rows and three columns showing the absolute deviation from the average of trade, log(trade), and their respective values. The columns are labeled as Trade, Abs. Deviation from Avrg. of: log(trade). The rows are labeled as News ag. x Tel., Telegraph, News agency, and Observations. Each row contains specific values and standard errors in parentheses. The table also includes fixed effects for Exporter x Year, Importer x Year, Country pair, and Diplomacy controls.
Notes: Column (1): For each observation, we compute the absolute value of the difference between the flow and its average over the period. We regress this absolute value of the deviation from the mean on dummy variables indicating news agency and telegraph coverage. Column (2): Same as Column (1), but the sample is restricted to strictly positive trade flows. Column (3): We use the log of trade flows; that is, we compute the absolute value of the difference between log trade flow and the period average of log trade flows. Standard errors are clustered at the dyad level. Significance levels: ap < 0.01; bp < 0.05; cp < 0.1.
Sources: CEPII TRADHIST, Wenzlhuemer and authors’ data collection.
COVERAGE OF FOREIGN COUNTRIES IN FRENCH NEWSPAPERS
We analyze the content of French newspapers to check how the coverage of foreign countries was affected by the inclusion of these countries in the news agencies’ syndication agreement. We rely on the Gallica corpus, accessed through the Gallicagram API (Azoulay and de Courson Reference Azoulay and de Courson2021). This corpus is available only for French newspapers, so that for this text analysis, we work on a much smaller sample than our baseline sample.
For each country, we construct a yearly indicator of “trade intensity” for the country coverage in French newspapers. This indicator is obtained as the ratio between the number of occurrences of the country name (denominator) and the number of co-occurrences of the country name and a trade-related term.Footnote 22 A co-occurrence is defined as both words being separated by less than three words. The ratio is multiplied by 100 to improve readability. For instance, if England is mentioned 17,500 times in a French newspaper in 1890, and out of these 17,500 occurrences, 175 are less than 3 words away from a trade-related term, then our indicator takes the value 1 (= 175/17500 × 100).
Following the approach laid out in the previous section, we estimate the treatment effect of being covered by a telegraph and a news agency on our measure of trade relatedness of the country coverage. We use the BJS estimator to recover the dynamics of the treatment effect.
We present our results in Figure 5. News agencies and telegraphs affect the nature of the press coverage of foreign countries, shifting the coverage toward more trade-related contents. The effect is immediate and rather stable over time, if anything, slightly increasing. The average treatment effect, again estimated via the BJS method, is, however, not significant, at 0.509 (standard error: 0.393). Pre-trend tests, reported in Online Appendix Table A3, suggest that there is no effect prior to the treatment.
EFFECT OF NEWS AGENCIES AND THE TELEGRAPH ON THE TRADE CONTENT OF FOREIGN COUNTRIES PRESS COVERAGE
Notes: The explained variable is a measure of how trade related the coverage of foreign countries is in the French press. It is constructed as the ratio between the number of occurrences of the foreign country (denominator) and the number of times this occurrence of the foreign country is associated to a trade-related term, that is, less than three words away (numerator). The dynamics of the effect are estimated through the BJS method. The treatment date is defined as the year in which the country is covered both by a news agency and a telegraph link with France. Ranges indicate the 95 percent confidence interval. Standard errors are clustered at the country level.
Source: CEPII TRADHIST, Gallica Corpus.

CONCLUSION
We use the joint expansion of the telegraph and the news agencies to disentangle the pure information effect from the effect of reduced communication costs. The positive trade effect of linking two countries through the telegraphic network is magnified when these two countries are also part of a news agency syndication agreement facilitating the exchange of information. We estimate that the decrease in coordination costs allowed by the telegraph raised the value of trade by 40 percent, while the increase in the flow of information associated with the coverage by one of the global news agencies resulted in an additional 30 percent growth in trade.
The positive and significant effect of the interaction between the telegraph and news agencies persists when focusing on indirect connections, which are less likely to suffer from the potential endogeneity bias linked to the expectations of the operators. Additionally, we document patterns consistent with an increase in the flow of information: the variance of trade increases after the connection by a telegraph and a news agency, suggesting an improvement in the ability to adapt to demand shocks, and the presence of a foreign country in French newspapers increases after this country is linked to France by a telegraph and a news agency.
While estimated from a historical event, the results are relevant to understanding contemporary trade flows, since exporters may still lack the necessary information, despite considerable improvements in communication technologies.
This paper does not take a stance on the precise mechanism through which better access to information on foreign countries affects trade. In addition to the improved knowledge of foreign market conditions, news agencies and telegraphs may have affected other outcomes such as Foreign Direct Investment, human migration flows, or even cultural tastes. We leave it to future research to delve into these potential channels.