
Introduction
Transparent conducting oxides (TCOs) are necessary components in many optoelectronic systems, including various renewable energy devices, electrochromic windows, and flat-panel displays.[Reference Ginley and Bright1] Due to the increasing demand for TCOs, significant attempts have been made to find new materials that can serve as TCOs as well as optimize the existing materials.[Reference Barquinha, Martins, Pereira and Fortunato2] Among the prevailing TCOs, the vast majority are based on SnO2, ZnO, and In2O3, usually containing various dopants.[Reference Hosono, Ueda, Kasap and Capper3] Two of the most common commercial TCOs are fluorine-doped tin oxide (FTO) and indium tin oxide (ITO).[Reference Löbmann, Schneller, Waser, Kosec and Payne4]
As expressed by the term transparent conducting oxide, the main requirements for a TCO are[Reference Ingram, Gonzalez, Kammler, Bertoni and Mason5]:
• High optical transparency (>75%)[Reference Löbmann, Schneller, Waser, Kosec and Payne4]
• Adequate electrical conductivity (ρ < 1 × 10⁻² Ω cm)[Reference Löbmann, Schneller, Waser, Kosec and Payne4]
However, three additional requirements need to be fulfilled when looking for the ideal TCO:
• Excellent chemical and thermal stability that will allow the TCO to maintain its physical properties during possibly difficult fabrication and operation conditions[Reference Barquinha, Martins, Pereira and Fortunato2];
• High abundance of each of the constituent chemical elements[Reference Pasquarelli, Ginley and O'Hayre6];
• Minimal surface roughness, i.e., smoother morphology and smaller particles on the surface.
Currently, ITO is the TCO with the lower surface roughness, with an R a of ~1–2 nm.[Reference Wu, Wu, Sturm and Kahn7] A rough surface complicates electrical contact with the adjacent layer, and can result in poor or erratic electrical transport at the interface, increases the chance of forming electrical shorts, and increases the scattering of light, which lowers optical specular transmission.[Reference Sohn, Kim, Kim, Paik and Gupta8]
The two common commercial products, FTO and ITO, do not meet all TCO criteria mentioned above. Both materials demonstrate sufficient transparency and electrical conductivity.[Reference Rey, Ternon, Modreanu, Mescot, Consonni and Bellet9] However, FTO is much more stable than ITO. For example, its optical and electrical properties can be maintained for temperatures up to ~600 °C,[Reference Hongli, John, Cesar and Jingkai10] while ITO is limited to ~200 °C,[Reference Kim, Shin, Song, Cho, Lee and Jung11] limiting it as TCO. Another advantage of FTO is that it contains only readily available, earth-abundant chemical elements, unlike ITO that contains significant amounts of the relatively rare element, indium.[Reference King and Veal12] Although FTO thus comes out on top in many of the TCO criteria, its main disadvantage is that FTO films have a high surface roughness, caused by grainy morphology, unlike the generally smooth ITO.[Reference Sohn, Kim, Kim, Paik and Gupta8] For these reasons, any lowering of the FTO surface roughness (to make it smoother), without significantly harming its other properties is of great interest and potential importance, because it can expand the use of FTO to additional optoelectronic applications.
Previous attempts to alter the surface roughness of FTO had as a goal increasing the roughness for better light trapping within the FTO film,[Reference Wang, Zhong and Wang13, Reference Shi, Wang and Wang14] which does not damage the overall transmission, but increases light scattering, therefore, lowering the specular transmission.
In this study, we introduce a method to substantially lower the surface roughness of FTO while close to or completely maintaining its other qualities required for use as a TCO. By depositing an SnO2 coating on top of a commercial FTO substrate, using pulsed laser deposition (PLD), we successfully reduced the surface roughness of the FTO by a factor of ~2.5. The formed SnO2 layer decreases the surface roughness of the FTO while preserving sufficient optical transparency and excellent electrical conductivity. Such an improvement in FTO surface roughness will allow its use in devices that have so far required the use of the smoother, less stable, more expensive, and less abundant, ITO.
Experimental section
Commercially available 72 × 72 × 2.2 mm3, FTO-coated glass (Hartford, soda-lime glass) was used as a substrate. Both TEC 8 (8 Ω/□) and TEC 15 (15 Ω/□) substrates were examined, to see how SnO2 coating affects their surface roughness. The SnO2 layer was deposited by PLD (Neocera), consisting of a KrF excimer laser with a 248 nm emission wavelength (Coherent, CompexPro 102), with a repetition rate of 5 Hz. The deposition was carried out at 525 °C onto the substrate that was preheated via a radiative heater. The substrate was rotated during the deposition, to minimize lateral inhomogeneity within each sample. An SnO2 target with a purity of 99.99% (Kurt J. Lesker Co.) was used. The laser spot size was measured to be ~4 mm2. Other PLD parameters were varied to investigate their effect on the layer: The SnO2 target was ablated with 12,000–35,000 laser pulses, O2 pressure was in the range of 1–7 mTorr, the target-to-substrate distance was varied between 50 and 90 mm, and the laser energy was varied in the range of 40–85 mJ with a corresponding energy density of ~1–2.2 J/cm2.
Sheet resistance measurements were performed using a home-built collinear four-point probe resistance scanner system.[Reference Shimanovich, Bouhadana, Keller, Rühle, Anderson and Zaban15] The system consists of a four-point probe head (probes from Ingun Prüfmittelbau GmbH), and Keithley 6517B, and 2400 voltmeter as a current supply, respectively. The measurements were performed in a controlled atmosphere (<5% humidity air). The sheet resistance was calculated based on the measured resistance (R), the distance between the probes, and the geometry of the sample.
Optical measurements were conducted using a home-built high-throughput optical transmission (total) and reflection (both specular and total) scanning system, with a spectral range of 320–1000 nm. The scanner is an optical fiber-based system, which consists of two integrating spheres and three CCD array spectrometers (HR4000, OceanOptics).[Reference Anderson, Bouhadana, Barad, Kupfer, Rosh-Hodesh, Aviv, Tischler, Rühle and Zaban16] The results of the optical measurements were also used to determine the thickness of the PLD-deposited SnO2 layer, as previously described.[Reference Keller, Ginsburg, Barad, Shimanovich, Bouhadana, Rosh-Hodesh, Takeuchi, Aviv, Tischler, Anderson and Zaban17]
Both the electrical resistivity measurements and the optical measurements of the resulting film were performed for a grid consisting of 13 × 13 points (169 points total), with a distance of 5 mm between adjacent points.
SEM images were taken using a high-resolution scanning electron microscope (HRSEM, FEI, Magellan 400 L). The energy-dispersive x-ray spectroscopy (EDS) sensor is mounted on the HRSEM, by an 80 mm2 X-max detector (Oxford Instruments).
Atomic force microscopy (AFM) measurements were performed using a Bio FastScan scanning probe microscope (Bruker AXS). The peak force mode was used, with a FastScan-C (Bruker) silicon probe (spring constant of 1.5 N/m). The resonance frequency of the cantilever was ~250 kHz (in air). The measurements were performed under ambient conditions. The presented data were taken in the retrace direction with a scan rate of 1.4 Hz. The resolution of the images was 512 points/line. The average roughness (R a) was calculated using image processing software (Nanoscope Analysis), by averaging the deviations of all points from the average height, to get the arithmetical average deviation. Before analysis of the images, “flatting” and “planefit” functions were applied to each image. Since AFM measurements are considerably slower than the electrical and optical characterization, we performed these measurements only on selected points in each sample, overlapping with the grids of optical and electrical analyses.
Results and discussion
To decrease the surface roughness of FTO-coated glass substrates and improve the overall film abilities for better TCOs, an SnO2 layer was deposited on top of the commercial FTO layer using PLD. The sample structure is schematically shown in Fig. 1. The SnO2 layer was previously found to have low electrical resistivity (8 × 10⁻⁴ Ω cm) and high optical transparency (400–700 nm average optical transmission of 77%).[Reference Keller, Barad, Rietwyk, Ginsburg, Borvick, Priel, Anderson, Meir and Zaban18]
Schematic description of the samples. On a commercial FTO-coated glass substrate, an additional SnO2 layer was deposited, causing the FTO to become much smoother.

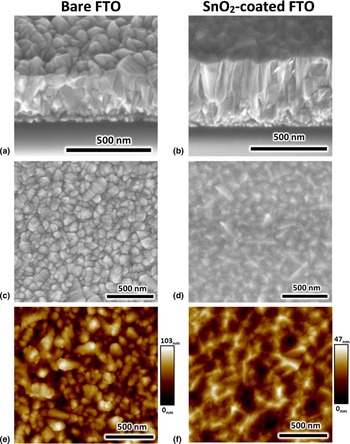
To investigate the effect of the PLD-deposited SnO2 layer on the morphology and the surface roughness of the FTO substrates, SEM and AFM images were taken. Figure 2 presents two samples: a bare FTO substrate (15 Ω/□) without any additional coating, which is used as a reference (left), and an SnO2-coated sample (right) that demonstrates the effect of the coating.
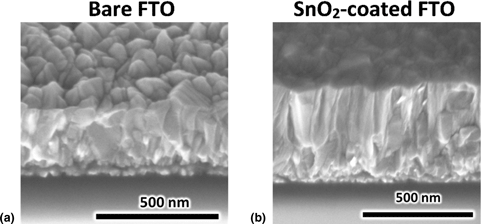
SEM and AFM images of bare FTO (left, TEC 15) and SnO2-coated FTO (right) samples. Top row: SEM side-view images, taken at sample tilt of 45°. The thickness of the FTO-layer in the bare FTO sample (a) is ~275 nm, while the total thickness of the FTO + SnO2 layers in the SnO2-coated sample (b) is ~450 nm. Middle row: SEM top-view images. The surface of the SnO2-coated sample (d) is much smoother and less granular than that of the bare FTO sample (c). Bottom row: AFM images, note the different scale of the z-axis in the two AFM images. The topography of the SnO2-coated sample (f) is smoother than that of the bare FTO sample (e), with an average roughness (R a) reduced from 13.4 ± 0.5 to 5.8 ± 0.5 nm.

SEM side-view images, taken at an angle of 45°, are shown in the upper row of Fig. 2. The SnO2 coating increases the thickness of the TCO layer, as expected. While the thickness of the FTO layer in the bare FTO sample is ~275 nm, as measured by SEM [Fig. 2(a)], the overall thickness of the FTO together with the additional SnO2 coating [Fig. 2(b)] is ~450 nm. Furthermore, the surface of the SnO2-coated sample appears much smoother and less granular than that of the bare FTO sample.
The SnO2 coating successfully covers the FTO surface, without any apparent gaps or cracks between the layers, which is highly important for electrical properties and for performance of devices made with such films. No clear interface between the FTO and SnO2 layers is observed in the coated sample, resulting in one continuous film along the z-axis. The interface cannot be detected also by EDS, because the fluorine content in the commercial FTO substrate was found to be smaller than 0.5%, which is the detection limit for F in our EDS system. A previous study reported the F content in similar FTO layers to be ~0.2% (atomic percentage).[Reference Fukano and Motohiro19] Therefore, no difference is observed in the F-content between the commercial FTO layer and our SnO2 coating.
The top-view SEM images show a smoother surface of the SnO2-coated sample [Fig. 2(d)] than for the bare FTO sample, the surface of which has a granulated structure [Fig. 2(c)]. SnO2 coating results in smaller gaps between adjacent grains on the surface, with less-defined grain shapes, leading to an overall smoother surface.
Similar findings are derived from the AFM images, shown in Figs. 2(e) and 2(f) [note the different z-axis scale between the bare FTO sample, Fig. 2(e), and the SnO2-coated sample, Fig. 2(f)]. Software analysis of the AFM results shows a significant decrease in the average surface roughness (R a), for the samples coated with SnO2, from 13.4 ± 0.5 to 5.8 ± 0.5 nm, While this is still 2–3 times rougher than the ~1–2 nm roughness of ITO[Reference Wu, Wu, Sturm and Kahn7, Reference Raoufi, Kiasatpour, Fallah and Rozatian20], it is a factor of ~2.5 better than bare FTO.
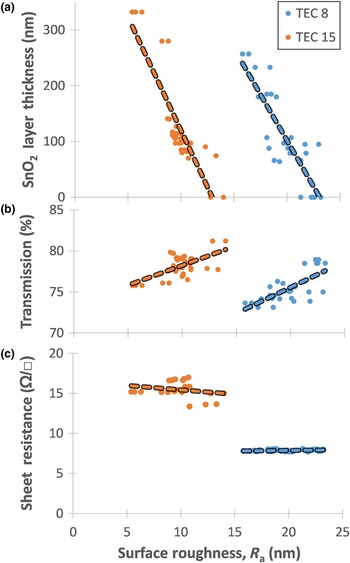
To understand how the SnO2 coating affects other optoelectronic properties, additional samples with various SnO2 layer thicknesses were fabricated and their sheet resistance and optical transmission were measured. The better conducting TEC 8 (8 Ω/□) FTO substrates have higher surface roughness than the previously mentioned TEC 15, and therefore were also examined, to see if SnO2 coating can also smooth TEC 8. The results are presented in Fig. 3, and are plotted as a function of the average surface roughness (R a), measured using AFM, for both TEC 8 and TEC 15 substrates.
Optoelectronic properties of SnO2-coated glass and FTO-on-glass samples: (a) SnO2-layer thickness on glass reference samples (i.e., without FTO); (b) 400–700 nm average optical transmission and (c) electrical sheet resistance as a function of average AFM-derived surface roughness (R a). The figure shows the results for the two types of FTO substrates that were investigated: TEC 15 (15 Ω/□; orange) and TEC 8 (8 Ω/□; blue), both with linear regression trend lines. The thicker the SnO2 layer, the more the FTO roughness decreases. The thicker SnO2 also leads to lower optical transmission, but does not significantly change the sheet resistance. No noteworthy difference was observed in the trends for the TEC 15 and TEC 8 samples.

Figure 3(a) presents the thickness of the SnO2 layer, as a function of average AFM-derived surface roughness (R a). The SnO2 layer thickness was measured in reference samples that were not coated with FTO. When the thickness of the SnO2 coating increases, the surface roughness decreases, for both TEC 15 (orange) and TEC 8 (blue). The intercept of the linear regression trend lines with the x-axis are different for TEC 15 and TEC 8, because uncoated TEC 8 substrates have higher surface roughness (R a = 22.4 ± 0.6 nm) than TEC 15 (R a = 13.4 ± 0.5 nm). However, the slopes of both lines are comparable, suggesting a similar effect of the SnO2 coating on the surface roughness.
If the SnO2 layer was thicker than ~330 nm (not shown here), the surface roughness did not further improve, probably due to the formation of larger SnO2 grains. In addition, apart from the number of laser pulses that governs the layer thickness, none of the other PLD parameters were found to affect the result, including oxygen pressure during deposition, target-to-substrate distance, and laser energy density. Thus because only the coating thickness (i.e., number of pulses) influences the surface roughness, the tailoring of surfaces can be done readily by PLD.
Figure 3(b) displays the change in optical transmission, averaged over wavelengths between 400 and 700 nm. For both types of FTO substrates, the addition of the SnO2 coating causes a reduction of up to 4.1 ± 0.15% in optical transmission. While thicker SnO2 coating yields a larger decrease in surface roughness, the transparency of the films with ~200 nm SnO2, is still within the range of commercially available TCOs.[Reference Barquinha, Martins, Pereira and Fortunato2]
Figure 3(c) shows the change in sheet resistance as a function of the surface roughness. Both types of FTO substrates show no significant change in sheet resistance. The observed changes, decrease of ~0.1 Ω/□ for TEC 8 and increase of ~0.1 Ω/□ for TEC 15, are within experimental measurement error (±0.1 Ω/□). The reason that the ~200 nm thick SnO2 coating does not significantly affect the sheet resistance of the samples, is likely that the sheet resistance of the SnO2 coating itself is only one order of magnitude higher than that of FTO.[Reference Keller, Barad, Rietwyk, Ginsburg, Borvick, Priel, Anderson, Meir and Zaban18] By Kirchoff's law, current will flow through the FTO, and as the 200 nm thickness is negligible to most lateral distances that the current has to cross, this hardly influences the effective sheet resistance.
On average, each roughness decrease of 1 nm requires a ~30–40 nm SnO2 coating with a concomitant transmission decrease of ~0.5% and no significant change in sheet resistance. The data are based on linear regression trend lines, and the exact values are described in the summary table (Table I). For TEC 15, an SnO2 coating of 300 nm reduces the surface roughness from R a = 13.4 ± 0.5 to 5.8 ± 0.5 nm, decreasing the optical transmission by 4.1 ± 0.15%, and increasing the sheet resistance by less than 1 Ω/□, on average. Such a decrease in surface roughness is highly promising since it may allow the use of FTO in additional optoelectronic devices, beyond the ones that presently use FTO, replacing the more expensive and less durable ITO.
Summary table of the average effect for a roughness decrease of 1 nm, based on the linear regression trend lines in Figs. 3(a) and 3(b).

Summary
We introduce a way to decrease the surface roughness of FTO, while preserving most of its original properties for which it is used in optoelectronic devices. SnO2 was deposited using PLD, on top of commercial FTO substrates. The SnO2 layer reduced the surface roughness from R a = 13.4 ± 0.5 to 5.8 ± 0.5 nm, resulting in 4.1 ± 0.15% decrease in optical transmission and no significant change to the sheet resistance of the newly smoothed film. On average, each roughness decrease of 1 nm requires a SnO2 coating of ~30–40 nm, causing a transmission decrease in the 400–700 nm range of ~0.5% and no significant change in sheet resistance. Such an improvement in FTO's properties may allow its use as a TCO in devices that so far used the smoother yet less stable and less abundant ITO.
Acknowledgments
The authors thank Dr. Olga Girshevitz and Dr. Eti Teblum for their kind assistance with the AFM measurements and analyses, and Ben Kayser for his help with the resistivity measurements.
Funding Sources
D.A.K acknowledges the Israeli Ministry of Science, Technology, and Space for their financial support (project 204428). This project has received funding from the Israel Science Foundation (grant 1729/15) and the Israeli National Nanotechnology Initiative (INNI, FTA project).
Conflicts of Interest
There are no conflicts of interest to declare.