Introduction
Conversion disorder can impair individual's quality of life in many ways. Diagnostic difficulty and complexity, redundant blood analyses, imaging techniques and medications increase the cost of this illness. Stigmatisation by hospital workers as a consequence of the repetitive nature of this disorder and multiple hospital admissions are also critical for sufferers. Understanding the underlying neural mechanisms will help these patients to relieve their symptoms in concurrence with development of effective treatment strategies for this disorder commonly regarded as ‘non‐organic’, although may possibly have ‘organic’ origins as shown by studies in the past years Reference Flor‐Henry, Fromm‐Auch and Tapper1, Reference Sackeim, Nordlie and Gur2.
Conversion disorders are classified as somatoform disorders in DSM‐IV to state that possible organic, neurological and general‐medical problems should be excluded 3. This divorce initially introduced in the previous version (DSM‐III) to adopt a descriptive approach to the classification with the intention of being more practically in clinical use based on the nature of presenting symptoms 4. Although the purpose of this separation was to underscore the importance of the exclusion of possible medical problems, this divorce caused a mistaken impression that these two conditions are unrelated which led to considerable perturbations among clinicians. Currently, researchers who aimed to investigate the underlying mechanisms of these disorders mainly take both two conditions aetiologically similar and do not separate them in their studies.
Neurobiological findings led some authors suggest that conversion disorders should be reclassified in dissociative disorders in DSM‐V as used in the 10th Edition of the International Classification of Diseases (ICD‐10) 5, Reference Mayou, Levenson and Sharpe6, Reference Mayou, Kirmayer and Simon7, Reference Brown, Cardena and Nijenhuis8. The main arguments for moving conversion disorders to dissociative disorders are raised from the higher statistical correlation between these two disorders and the involvement of similar psychological and biological processes from an aetiological view. For instance, dissociative disorders are found related with childhood trauma in some studies Reference Nijenhuis, Spinhoven and Van9, Reference Kisiel and Lyons10, Reference Chu and Dill11. Besides, there was found a significant overlap between two disorders in a study by Sar et al. Reference Sar, Akyuz and Kundakci12. Currently, there are so many studies attempting to explore the neurobiological correlates related to these disorders. Studies cited below are aimed to explore the underlying neurological processes of conversion symptoms which emerged in hysterical or dissociative states.
Initial studies including imaging techniques found possible brain blood flow changes in affected conversion patients Reference Marshall, Halligan and Fink13, Reference Spence, Crimlisk and Cope14, Reference Vuilleumier, Chicherio and Assal15, Reference Tiihonen, Kuikka and Viinamaki16, Reference Yazici and Kostakoglu17, Reference Mailis‐Gagnon, Giannoylis and Downar18, Reference Werring, Weston and Bullmore19. Using PET scanning, Marshall et al. Reference Marshall, Halligan and Fink13 studied a conversion patient with left hemiparesis and found cerebral blood flow accumulation in the right anterior cingulate and right orbitofrontal cortex regions, whilst Spence et al. Reference Spence, Crimlisk and Cope14 showed deactivation in the left dorsolateral prefrontal cortex region in hysterically hemiparalysed patients. Using SPECT scanning, Tiihonen et al. Reference Tiihonen, Kuikka and Viinamaki16 showed hypoperfusion in the contralateral frontal lobe and parietal lobe areas which normally expected to be increased by median nerve stimulation in a patient with hysterical hemiparesis and paresthesia. This hypoperfusion was recovered after acute conversion phase (6 weeks later) which was interpreted as an inhibition of somatosensory cortex. Another SPECT study by Yazici and Kostakoglu Reference Yazici and Kostakoglu17 supported these findings by showing hypoperfusion in the dominant hemisphere of temporal and parietal lobes in five patients with astasia‐abasia. Vuilleumier et al. Reference Vuilleumier, Chicherio and Assal15 also used SPECT imaging and found reduced blood flow in the thalamus and basal ganglia regions contralateral to the hysterical deficits of the patients. Two fMRI studies showing decreased activation in somatosensory and visual cortex regions during conversion anaesthesia Reference Mailis‐Gagnon, Giannoylis and Downar18 and hysterical blindness Reference Werring, Weston and Bullmore19, respectively possess considerable findings.
Harvey et al. Reference Harvey, Stanton and David20 reviewed related studies and suggested that conversion symptoms may be evoked during stressful emotional processes in connection with frontal, cortical and limbic activation which could inhibit the strio‐thalamo‐cortical circuits resulting a deficit in conscious sensorial and motor processing. We still definitely don't know the exact biological processes underpinning this inhibition. As we know, conversion symptoms are stress regulated and most conversion patients have the history of a stressful life event Reference Ron21. In addition, it is shown that stress also affects immunological processes in the body by increasing or decreasing susceptibility to immunologically mediated diseases or reactivate infectious (e.g. viral) diseases Reference Ader22, Reference Ader and Cohen23.
Psychoneuroimmunology is a novel research area that investigates the interactions among behaviour, neural and endocrine function, and immune system Reference Ziemssen and Kern24. Studies in this field yielded strong evidence that the immune and nervous systems are in interaction reciprocally Reference Ader22, Reference Ziemssen and Kern24, Reference Irwin25. These interconnections are mainly mediated by neural activations, hormones and cytokines. Cytokines are primary chemical messengers of immune system. Most prominent cytokines related to stress and psychiatric disorders are tumour necrosis factor alpha (TNF‐α), Interleukin‐1 beta (IL‐1β) and Interleukin‐6 (IL‐6) which are known as proinflammatory cytokines Reference Schiepers, Wichers and Maes26.
Organisms are in vigilance to environmental stimuli. These stimuli are perceived and conceived as neutral, stress‐conditioning or threatening in central nervous system. Most of the pathways regarding stress response are coordinated in hypothalamic‐pituitary‐adrenal axis (HPA) through neural or hormonal routes Reference Marques, Cizza and Sternberg27. Corticotrophin‐releasing hormone (CRH) secreted from hypothalamus activates anterior pituitary gland, whilst activates adrenal‐corticotrophin‐releasing hormone (ACTH) release from pituitary gland to adrenal medullar gland ultimately releasing cortisol so called HPA Reference Kilicoglu28. Cortisol receptors are found widely distributed in the brain areas involving limbic system composed of prefrontal cortex, amygdale, hippocampus and hypothalamus organising stress response Reference Bear, Connors and Paradiso29. Stress hormones are shown to affect the plasticity of neurons in these areas Reference McEwen30.
Hormones associated with HPA axis are known to have receptors for almost all immune cells Reference Steinman31. In animal studies, hypothalamic and hippocampal neurons are found to have IL‐1β receptors Reference Lechan, Toni and Clark32. IL‐6 and TNF‐α activates HPA axis and glucocorticoids inhibit secretion of these cytokines Reference Chrousos33. CRH is shown to coordinate changes in brain associated with peripheral immunity in a serial of studies by Irwin et al. Reference Chrousos33, Reference Irwin, Jones and Britton34, Reference Strausbaugh and Irwin35, Reference Irwin, Vale and Britton36. Conditions like stress or depression concurrently causes CRH release leading to down‐regulate in vivo cellular immunity Reference Agarwal and Marshall37. Moreover, gaba‐amino‐butiric‐acid Reference Zavala38 agonists (benzodiazepines) which are known to have antagonist effects on CRH also blocks immune down‐regulating effects of this hormone Reference Irwin, Hauger and Britton39. Benzodiazepine receptors are found on immune cells, so under stressful conditions benzodiazepine agonists are shown to interact neuronal receptors preventing glucocorticoid‐induced immune‐suppression Reference Zavala38.
Stress is also associated with increases in predisposition to infectious and inflammatory diseases Reference Sheridan, Dobbs and Jung40. Stress causes a delaying effect in virus‐specific antibody production and suppressed natural‐killer activity and cytotoxic T lymphocyte development in rats Reference Amkraut, Solomon and Kraemer41. In another animal study, HPA axis activation with latent herpes‐simplex‐virus infection reactivation occurred in majority of rat colony due to stress Reference Padgett, Sheridan and Dorne42. Another serial study using sera derived from medical students by Glaser et al., Epstein‐barr‐virus reactivation is shown in course of their exams Reference Glaser, Rice and Sheridan43, Reference Glaser, Pearson and Bonneau44, Reference Glaser, Pearl and Kiecolt‐Glaser45.
On the other hand, stress affects immune‐response to vaccines. Psychological stress is shown to reduce seroconversion levels to hepatitis‐B vaccine injection Reference Glaser, Kiecolt‐Glaser and Bonneau46. In another study, higher hepatitis‐B surface antigen levels (HbsAg) and polymorphonuclear cell proliferation are found in students with higher social support compared to lower Reference Jabaaij, Grosheide and Heijtink47.
As conversion disorder is known to be prompted by stressful life events and stress is known to change immunity, we estimated that there may be a relationship between conversion disorder and proinflammatory cytokines.
Materials and methods
The study was conducted between 1 October 2009 and 1 September 2010, enrolling 35 conversion patients according to Diagnostic and Statistical Manual of Mental Disorders, Fourth Edition, Text Revision (DSM‐IV‐TR) 3. Patients were recruited from Emergency Unit and Psychiatry Outpatient Clinic as well as Neurology and Psychiatry inpatient services of Trakya University Hospital. Thirty healthy controls with no previous history of psychiatric disorders were also included in the study. Sera were collected from each patient during in acute conversion phase and after conversion phase in order to evaluate proinflammatory cytokine levels (TNF‐α, IL‐1β, IL‐6). Those cytokines were evaluated in 30 healthy controls for comparison. Patients were evaluated psychiatrically at conversion phase and after. All patients and controls were examined for their general medical history and consulted from relevant clinics in case of necessity. None of them were found to have using any medication in the study period. Because of the drop outs due to pregnancy in one patient and withdrawal requisition in four patients, sera for post‐conversion phase could not be studied.
Prior to study, all patients and controls who enrolled the study gave written informed consent. The study protocol was approved by Trakya University Local Ethics Committee.
Entry criteria
Thirty male and 15 female patients between 18 and 65 years of age who met DSM‐IV criteria for the diagnosis of conversion disorder and 30 healthy controls were enrolled in the study. They were also required not to have autoimmune, neurological illnesses or axis I psychiatric disorders, not to take any medications at least for 2 weeks, not to be immunised at least for 6 months and not to have pregnancy which all may possibly interfere with proinflammatory cytokine levels. In addition, patients and controls who had mental retardation were excluded from the study.
Procedure
Laboratory tests
Five millilitre of blood in vacuum tube was collected from patients during acute conversion phase and after acute conversion phase. Blood samples were centrifuged at 800g for 12 min to obtain sera. Same procedure was repeated in controls. All sera were stored at −80 °C freezer until they were assessed by using Enzyme‐Linked Immunosorbent Assay (ELISA) in Immunology Laboratory of Trakya University Hospital for TNF‐α, IL‐1β and IL‐6 levels.
Assessment of cytokine levels
ELISA kits used for TNF‐α, IL‐1β and IL‐6 were KHC3011, KHC0011 and KHC0061 (Invitrogen, CA, USA), respectively. Data achieved by ELISA were read on optic densitometry (Biotek, uQuant Microplate Spectrophotometer Vermont, Winooski, VT, USA) to reveal proinflammatory cytokine levels. Sensitivity of each ELISA kit (the minimum detectable dose) was found to be 1.7 pg/ml, 1 pg/ml and 2 pg/ml, respectively.
Statistical methods
Data analyses were performed with Minitab Statistical software (version: S0064). For descriptive purposes, means and SD's were calculated. Comparison of groups with normal distribution was performed with Independent Samples Student's t‐test, whilst comparison of groups with nominal values was performed with Pearson Chi‐square test. Repetitive variables in groups were analysed by Paired Samples Student's t‐test. Statistical significance was considered as p < 0.05.
Results
Groups were compared according to demographic variables for gender, marital status, education and occupational status and found similar. Average age of patients and controls were 28.69 ± 8.35 and 28.57 ± 5.28, respectively which were also found similar (t = 0.0067, p = 0.94).
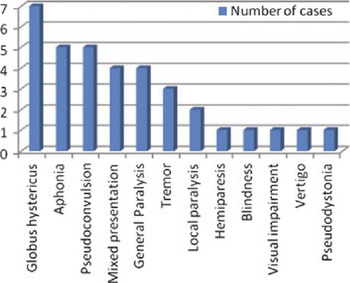
Distribution of conversion symptoms is shown in Fig.1. The mean duration between two blood sample collection points (acute phase and post‐conversion phase) was 6.77 ± 6.43/days.
Distribution of conversion symptoms.

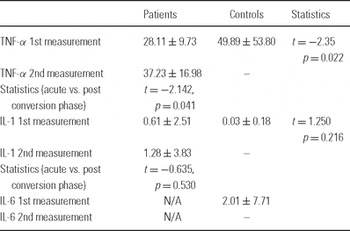
Serum TNF‐α levels between acute conversion phase and controls are compared by Independent Samples Student's t‐test and statistically significant higher serum TNF‐α levels are found in healthy controls (t = −2.35, p = 0.022) (Table Table 1).
Comparison of mean cytokine levels in all groupsFootnote *Footnote †

TNF‐α, tumour necrosis factor‐alpha; IL‐1β, interleukin‐1 beta; IL‐6, interleukin‐6.
* N/A: Values below the minimum detectable dose of kits are not determined.
† All measurements are given as pg/ml.
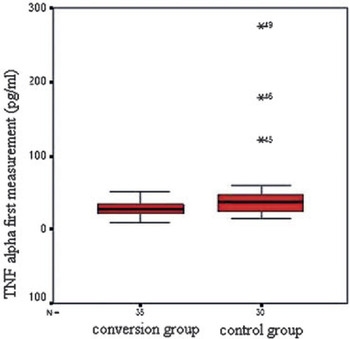
In control group, there were three extreme TNF‐α levels which increased the standard deviation and mean values (Fig. 2). Both groups were reevaluated after excluding those three cases and no difference was found statistically.
Comparison of mean TNF‐α levels between patients and controls at first measurement (acute conversion phase).

In patient group, serum TNF‐α levels were found to be increased in post‐conversion phase when compared with acute conversion phase.
Serum IL‐1β values between patient and control group during acute conversion phase were compared by Independent Samples Student's t‐test. Although higher IL‐1β values were found in acute conversion phase, there was no statistical difference between those groups on comparison. On the other hand, serum IL‐1β values in acute conversion were compared with post‐conversion phase by Paired Samples Student's t‐test in patient group. There was a slight increase in post‐conversion phase, however, this increase was not able to reach a sufficient level of significance on statistical evaluation (t = −0.635, p = 0.530) (Table 1).
Unfortunately, serum IL‐6 levels were found to be under minimum detectable levels of IL‐6 ELISA kit in almost all of controls and whole patient group, thus no statistical evaluation could be performed.
Discussion
The most important finding of this study was that considerable lower TNF‐α levels were found during acute conversion phase. On the other hand, those levels were found to be increased subsequent to acute conversion phase. This is the first study concerning proinflammatory cytokines in conversion disorder in the literature. Statistical evaluation revealed that those initial TNF‐α levels were significantly lower when compared with both control group and post‐conversion period. There was no difference between patients and controls associated with IL‐1β levels during acute conversion phase; however, it is important to emphasise that most of the IL‐1β levels and almost all of the IL‐6 levels were found below the minimum detectable doses of relevant ELISA kits.
Stress triggers changes in proinflammatory cytokine levels which are proved to play important roles in organic diseases Reference Ader and Cohen23, Reference Black48, Reference Dantzer49. Stress‐related factors cause HPA axis to release cortisol and glucocorticoid hormones which are both shown to suppress immune system cells Reference Irwin, Vale and Britton36. Dantzer Reference Dantzer50, hypothesised a molecular and cellular system which is involved in orchestrating danger signals perceived from external or internal stimuli and suggested that the brain cytokine system is sensitised, thus less likely to shut down after danger signals are terminated. Anisman et al. Reference Anisman, Merali and Hayley51, reported psychopathology development after exposure to repetitive stressors and cytokine treatments.
There are many authors that reported TNF‐α levels are correlated with depression. Tilders and Schmidt Reference Tilders and Schmidt52 stated that exposure to stressful environment is positively correlated with TNF‐α levels and predisposition with depression. Tuglu et al. Reference Tuglu, Kara and Caliyurt53 found that TNF‐α levels are higher in patients with depression, whilst those levels are decreased significantly following antidepressant treatment. Sutcigil et al Reference Sutcigil, Oktenli and Musabak54 found that proinflammatory cytokines were higher, whilst anti‐inflammatory cytokines were lower in patients with major depression significantly when compared to healthy controls. They also stated that patients have significantly higher TNF‐α levels than healthy controls which decrease after sertraline treatment. According to those studies we would expect higher TNF‐α levels in severe depression. Gabbay et al. Reference Gabbay, Klein and Guttman55, studied adolescents with major depression but unexpectedly found that suicidal adolescents had significantly decreased TNF‐α levels compared to non‐suicidal ones with major depression. So, suicidality, or in other words higher acute stress may have an inhibiting effect on immunity.
Rief et al. Reference Rief, Pilger and Ihle56 compared cytokine levels between depression and somatization disorder patients and found cytokine levels are decreased and anti‐cytokine (CC16) levels are increased in patients with somatization disorder compared to depression. This finding may also indicate a hyper‐acute inhibiting effect of somatization symptoms on immune system as a result of higher stress during somatization. We know that some somatization symptoms resemble conversion symptoms which are defined as ‘pseudo‐neurological’, thus we would possibly expect a similar inhibition effect on immunity during conversion.
Tunca et al. Reference Tunca, Fidaner and Cimilli57 performed dexamethasone suppression test in 25 conversion disorder patients and 8 healthy controls and found dexamethasone suppression is decreased as indicating higher cortisol levels in patients. However, no elevation was found in basal cortisol levels in this study. These authors performed another study in 18 pseudoconvulsion and 8 healthy controls and found elevated serum cortisol levels in pseudoconvulsion patients than controls Reference Tunca, Ergene and Fidaner58. Bakvis et al. Reference Bakvis, Spinhoven and Giltay59 studied pseudoconvulsion patients with and without trauma history and found both have elevated basal cortisol levels when compared with healthy controls. As cortisol is a well‐known stress‐regulated hormone, authors above suggest that conversion patients may have higher cortisol levels at baseline and during conversion phase when compared with healthy controls. So we can assume that immune system is inhibited in a hyper‐acute situation through rapid cortisol release.
Acute minor stressors have an additive and positive effect on immunity, while prolonged stressors are shown to have opposite effects as reported by Agarwal and Marshall Reference Agarwal and Marshall37. But if we consider ‘acute’ term in a ‘hyper‐acute’ manner, discriminate changes do occur in immunity. In an interesting study by Westerloo et al. Reference Van Westerloo, Choi and Lowenberg60, it is found that plasma catecholamine and cortisol levels increased significantly during bungee jumping, which was accompanied by significantly reduced ex vivo inducibility of proinflammatory cytokines. Waage and Bakke Reference Waage and Bakke61 showed suppression of TNF‐α in a dose‐dependent manner by dexamethasone. Briegel et al Reference Briegel, Jochum and Gippner‐Steppert62 studied patients with septic shock and used hydrocortisone in stress inducing doses. They showed that hydrocortisone selectively reduced circulating IL‐6 and IL‐8 levels but not TNF and IL‐10 levels and suggested that this a result of blocking uncontrolled activation of the immune system for protecting the organism from organ dysfunctions including mental disorders.
However, studies related to glucorticoids and their effects on immunity due to stress are somewhat controversial. It is not yet completely understood whether glucocorticoids have suppressing or enhancing effects on immunity. Corticoids show their effects in a dose and duration‐dependent manner on cytokines which are defined as bi‐directionally Reference Barnes63. Their effects on cytokines depend on many factors including duration of illness (acute vs. chronic), concentration (physiologic or pharmacologic), timing of stress or stress‐related hormone exposure and nature (endogenous vs. synthetic) Reference Dhabhar64.
In a review by Dhabhar Reference Dhabhar64, a ‘stress spectrum’ is purposed to describe these bi‐directional effects between glucocorticoids and immunity. He claims that acute stressors by minutes to hours have an enhancing effect on immunity, while chronic stressors by months to years suppress the immunity. However, Dhabhar emphasised that the will of an organism to return to its steady state condition following stressful life events depends on its capacity of psychological and interacting physiological systems (coping mechanisms, sense of control, social support, early life experiences, learning, genetics vs.). He described those systems as mediators of psychological resilience. Thereby, it is important to emphasise that the perception and processing of stress by brain, or in other terms, the decision of brain to examine the emerging stress as acute or chronic is substantial for the magnitude and duration of stress response.
Conversion disorder is a stress‐related disorder and symptoms like freezing, blindness, visual impairment, globus hystericus or mixed presentations all together may indicate homeostatic urge to come to a steady state condition. Conversion disorder‐related studies suggest that cortisol levels are higher during conversion Reference Tunca, Fidaner and Cimilli57, Reference Tunca, Ergene and Fidaner58, Reference Bakvis, Spinhoven and Giltay59. Cortisol secretion due to stress may have a suppressing effect on immunity as mentioned by studies above Reference Waage and Bakke61, Reference Briegel, Jochum and Gippner‐Steppert62. So we can assume that TNF‐α may eventually be blocked during conversion symptoms. Dhabhar Reference Dhabhar64 clearly stated that glucocorticoids do effect immunity, but it is not yet undoubtedly known whether they suppress or enhance immunity. In our study, although it is not fully explained whether predisposing psychological stressors might be hyper‐acute, acute or chronic, suppression of immune system at conversion phase is frankly shown.
There are some limitations in our study. First, although the exclusion criteria involved the first axis disorders other than conversion disorder, we did not search for possible childhood traumas in these patients which are considerably shown to affect the severity of conversion symptoms by Sar et al. Reference Sar, Akyuz and Kundakci12. Second, there was no standardisation of patients for conversion symptoms, thus conversion levels were not known for each case and may be related with the cytokine levels. Third, duration between acute conversion phase and post‐conversion phase was decided clinically. Finally, there were some extreme values on assessment of cytokine levels and most of the IL‐1β levels and almost all of the IL‐6 levels were found below the minimum detectable doses of relevant ELISA kits. Our findings should be considered in the light of those limiting factors.
In conclusion, TNF‐α levels are decreased in acute conversion phase and approximated to normal levels in post‐conversion phase. So those results can be accepted as a state marker for conversion disorder. These findings may indicate an immune suppressing effect of conversion disorder as a result of stress response. The results of our study may be useful to benefit from immune changes in differential diagnosis, treatment response and follow‐up purposes for managing conversion disorder in the future.