

INTRODUCTION
GABA is now understood to have numerous developmental roles in addition to its classical neurotransmitter role. GABA has been reported to alter the rate of mitosis and migration of neuronal precursors, to increase the outgrowth of neuronal processes, and to influence the expression of its own receptors (Ganguly et al., Reference Ganguly, Schinder, Wong and Poo2001; Varju et al., Reference Varju, Katarova, Madarász and Szabó2001; Bolteus and Bordey, Reference Bolteus and Bordey2004). GABA can be released from growing axons (Gao and van den Pol, Reference Gao and van den Pol2000), and during early stages of development, GABA operates to excite developing neurons rather than inhibit them (Chen et al., Reference Chen, Trombley and van den Pol1996; Ben-Ari, Reference Ben-Ari2002; Owens and Kriegstein, Reference Owens and Kriegstein2002). The question raised in this study is whether GABA may act through glial cells to affect some aspects of neuronal or glial development in the well-described developing olfactory (antennal) pathway in the moth (Oland et al., Reference Oland, Gibson and Tolbert2010).
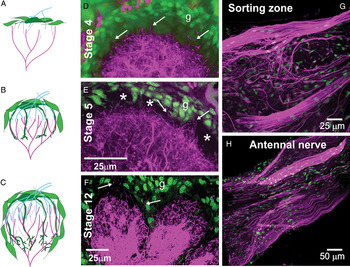
Dendrites of GABAergic local interneurons have long been known to be present in the neuropil of the antennal lobe (AL) during the early stages of metamorphic adult development (Homberg and Hildebrand, Reference Homberg and Hildebrand1994), when the adult AL circuitry is created. In the context of other work requiring examination of the distribution of these GABA-ergic processes in the developing AL, we noted that at the beginning of the period when olfactory receptor axons grow into the neuropil, GABAergic processes extend up to the shell of glial cells that surrounds the neuropil. At this time in development, the neuropil comprises mainly the dendrites of local interneurons and the axons of projection neurons. The dendrites of projection neurons (which persist from larval stages) mostly have been retracted and are beginning to re-extend and the dendrites of newly born projection neurons also are beginning to extend. The axons of the olfactory receptor neurons travel through the glial layer to reach their target region in the lobe, then turn into the neuropil and establish a fringe of processes that gradually lengthen and coalesce into small protoglomeruli between the glial cell layer and the existing dendrites. These protoglomeruli serve as the template on which the mature glomerular array is built (Oland et al., Reference Oland, Orr and Tolbert1990). The glial cells shortly thereafter extend processes that surround each protoglomerulus and serve to stabilize them (Baumann et al., Reference Baumann, Oland and Tolbert1996) as the dendrites of first the projection neurons and then the local interneurons invade the protoglomerular territory. Figure 1 summarizes these steps schematically.
GABA in the developing olfactory pathway. (A,D) Stage 4: At the time the first olfactory axons reach the AL, the neuropil is surrounded by glial cells (green, g) and the processes of GABAergic local interneurons (magenta) reach to the glial border, with only a few processes extending into the border (arrows). (B,E) Stage 5: By the end of this stage, the terminal branches of the olfactory axons have formed protoglomeruli (*) just inside the glial border, now separating most GABAergic dendrites from contact with the glial border (arrows indicate a few processes still in contact). A few glial cells have begun to migrate and extend processes around the outside of each protoglomerulus. Complex glial cells (dark green in B) also are extending processes toward the base of the newly forming glomeruli. (C,F) Glomerular architecture is fully established by stage 12, with simple glial cells forming an envelope around each glomerulus. A few GABAergic processes of unknown origin are visible within the axonal fascicles (arrows) entering glomeruli from the olfactory nerve layer. GABAergic axons and axon bundles are present in the antennal nerve (arrows and arrowheads, respectively, in G) and individual GABAergic processes (arrows in H) appear to join with or emerge from the strongly GABA-positive dendrites of AL neurons during the period of axon ingrowth, shown here at stage 7.

In other words, as indicated in Fig. 1, there is a short period of time before the protoglomerular layer is interposed between the glial cells and the dendrites of the GABAergic neurons, when the glial cells surrounding the nascent neuropil could be exposed directly to GABA released from interneurons. Their responses to GABA could affect subsequent steps either in their own development or in that of the intrinsic neurons of the AL.
Objective
In this study, we set out to the determine whether the neuropil glial cells are capable of responding physiologically to the presence of GABA and whether exposure of the glia to GABA would allow the glial cells to induce changes in the morphology of developing AL neurons or would affect the glial cells' own migratory or process-extension behavior. We used a combination of reverse transcription and polymerase chain reaction (RT–PCR), whole-cell electrophysiology and calcium-imaging techniques, immunocytochemistry and culture methods to address the question.
METHODS
Animals, staging and drug injection
Manduca sexta (Lepidoptera: Sphingidae) were reared from eggs on artificial diet under a long-day photoperiod (17 h light and 7 h dark) at 26°C in the departmental insect rearing facility as described previously (Oland and Tolbert, Reference Oland and Tolbert1988). Metamorphic adult development is divided into 18 stages, each stage lasting 1–4 days, beginning at the time of pupation and ending with emergence of the moth. Pupae were staged by using fiber-optic illumination to follow changes in structures lying immediately under the pupal cuticle (Oland and Tolbert, Reference Oland and Tolbert1987). Animals were treated with the GABA receptor blockers Picrotoxinin (Sigma #P8390) and CGP54626 (Tocris #1088), both shown to be effective GABA receptor blockers in insects (Waldrop et al., Reference Waldrop, Christensen and Hildebrand1987; Olsen and Wilson, Reference Olsen and Wilson2008), by injection of the drug, or vehicle (DMSO), into the head one or more times beginning at stage 3 of metamorphic development. Final drug concentrations cited assume a 2-ml volume of hemolymph (Morton and Truman, Reference Morton and Truman1985). Animals were anesthetized with CO2 (injections) or by cooling on ice (dissections) for 20–40 min.
Cultures
AL neuron cultures were established using our standard protocol (Oland et al., Reference Oland, Pott, Bukhman, Sun and Tolbert1996). The ALs of 1 stage-5 female animal were used for each dish being prepared. Briefly, the overlying perineurial sheath was removed from the dissected ALs. The tissue was dissociated, first enzymatically with 5 µl Liberase (Roche, #119-884-17-001) then mechanically using a fire-polished glass pipette. The cells were rinsed and centrifuged twice, the pellet was resuspended in enough IL-15 to yield 100 µl per dish, and then cells were plated into laminin- and Concanavalin A-coated, 8-mm, glass-bottomed wells in the bottom of 35-mm Petri dishes (Oland et al., Reference Oland, Pott, Bukhman, Sun and Tolbert1996). Drugs were added at this time, and the neurons were allowed to grow in a 26°C humidified incubator.
Neuropil glial cell cultures were prepared following Tucker and Tolbert (Reference Tucker and Tolbert2003). In most cases, the neuropil glia from the ALs of 2 late-stage-5 female animals were used for each dish to be prepared. Briefly, the ALs were dissected into dissecting solution and desheathed. In insects, the neuronal cell bodies are located in clusters outside the neuropil. These clusters, as well as the antennal nerve entry region (sorting zone) of each lobe, were cut away from the neuropil, leaving neuropil glial cells as the only remaining cells. The neuropil was then dissociated, first enzymatically with 0.1 mg/ml papain in HBSSO (HBSS adjusted to 375 mOsm) and then mechanically by trituration with a fire-polished, silicone-coated, glass pipette. The tissue was washed in 5 ml of recovery solution and 1 ml of 200 U/ml deoxyribonuclease I from bovine pancreas (Sigma #D4263), centrifuged, washed in IL-15 and centrifuged again. The cells were re-suspended in an amount of IL-15 medium sufficient to yield 100 µl per dish. Drugs were added at this time if needed.
In some cases, neurons and glia were co-cultured in a configuration that allowed a shared medium but not direct contact between the two cell types. AL neurons were dissociated as above but plated onto 100-μl spots of substrate centered on coverslips. After 2 h, they were added to newly made glial-cell cultures by inverting the neuron-containing coverslips onto 5-mm-wide strips of #1.5 coverslips that had been glued adjacent to the wells. On the third day (with respect to the neuronal culture), the neuron-containing coverslip was moved to new glial cultures as the glial cultures begin to deteriorate after the third day.
Whole-cell patch-clamp recording
Neuropil glial cells dissociated from stage-4 or late-stage-5/early-stage-6 ALs were plated and allowed to rest for 2–4 h. Membrane currents were recorded using the whole-cell configuration of the patch-clamp technique (Hamill et al., Reference Hamill, Marty, Neher, Sakmann and Sigworth1981). Electrodes were made from borosilicate glass using a Narishige PP-83 puller and were filled with a solution containing either potassium aspartate (150 mM) or potassium chloride (150 mM) plus 10 mM NaCl, 2 mM MgCl2, 1 mM CaCl2, 11 mM ethylene-glycol-bis(beta-aminoethyl ether)-N,N,N,N-tetraacetic acid (EGTA), 2 mM ATP, adjusted to pH 7 with 5 mM Hepes and to 330 mosm with mannitol. Typical electrode resistance was 5–8 MΩ, a little higher than usual because of the small size (5–8 µm diameter) of the glial cells. The recording solution, perfused continuously, was Standard Insect Saline, described below. For whole-cell recording, a gigohm seal was established by extremely light suction; even brief high-voltage pulses destroyed the possibility of establishing a good seal. Membrane currents were recorded using an Axopatch 200B amplifier (Axon Instruments, now Molecular Devices Corporation, Sunnyvale, CA) with a Digidata 1200 interface. Data were acquired and analyzed using pClamp6 software (Axon Instruments). Cells were clamped initially at a holding potential of −70 mV. Membrane currents were filtered with a 10 kHz low-pass-four-pole Bessel filter and sampled at intervals of 100 µs. Junction potentials were nullified prior to seal formation and linear leakage currents were subtracted electronically from all records. No compensation was made for series resistance.
GABA was applied by pressure ejection from a micropipette positioned ~2–3 cell-body diameters from the cell under study. Pipette resistance with standard internal patch-pipette solution was 4–6 MΩ; Picospritzer pressure set at 7 psi.
Calcium imaging
Neuropil glial-cell cultures from stage-5/6 ALs were prepared 2 h prior to beginning an experiment (see protocol above). The calcium-imaging protocol followed that of Lohr et al. (Reference Lohr, Heil and Deitmer2005). Cells were incubated in 1.7 µM Fura 2 AM solution (1 µl Pluronic F-127, 0.5 µl 5 mM Fura, 1.5 ml IL-15) for 30 min at room temperature (RT). A ring of Sylgard was placed over the well containing the cells to form a small perfusion chamber of 500 µl, and the dish was mounted on the stage of an Olympus BX50WI upright microscope. A perfusion of oxygenated standard insect saline (SIS) flowing at a rate of 1.2 ml/min was started into the dish. SimplePCI was used to control a cooled-CCD camera (Hamamatsu C4742-95), Uniblitz shutters D510/40 and Chroma 71,000 filter to excite the dye at 340 and 380 nm alternatively, collecting images at 2 Hz. Solution changes were made by a manually controlled solenoid switch. All solutions were chilled and flowed through a multi-tip perfusion inflow port. Drug-containing solutions were made fresh each day. After an experimental run, cells were incubated in Ca2+ free SIS with a 20-μM solution of the Ca2+ ionophore 4-bromo-A23187 (Molecular Probes #B7272) for 10 min, and then ratio and fluorescence values were collected. Cells were then incubated in 5 mM Ca2+ SIS with the ionophore for 10 min and the same values recorded. Internal calcium concentrations were determined by the following formula (Grynkiewicz et al., Reference Grynkiewicz, Poenie and Tsien1985): [Ca2+] = K D × Sf2/Sb2 × (R − R min)/(R max − R) where K D is the dissociation constant 225 nM taken from Grynkiewicz et al. (Reference Grynkiewicz, Poenie and Tsien1985), Sf2 and R min are the florescence (380 nm) and ratio values, respectively, measured in cells in Ca2+-free SIS, Sb2 and R max the florescence (380 nm) and ratio values, respectively, measured in cells in 5 mM Ca2+-SIS, and R the ratio measured during an experimental run.
Solutions for cultures, for calcium-imaging experiments and for whole-cell recording
HANK'S BUFFERED SIMPLE SALT SOLUTION (HBSS)
About 160 mM NaCl, 6 mM KCl, 88.8 mM d-glucose, 100 U/ml penicillin, 100 µg/ml streptomycin, 10 mM HEPES, pH 7.0 and 390 mOsm.
CULTURE CHOW
About 149.9 mM NaCl, 3 mM KCl, 3 mM CaCl2, 0.5 mM MgCl2, 10 mM TES (TCI T0683), 11 mM d-glucose, 5 g/l tissue culture (TC) yeastolate, 10% fetal bovine serum, 100 U/ml penicillin, 100 µg/ml streptomycin, pH 7.0 and 360 mOsm.
DISSECTING SOLUTION
Fifty percent (v/v) Leibovitz's L-15 culture media, 25% (v/v) Culture Chow, 25% (v/v) HBSS with 5 mM EDTA tetra-sodium-salt (Sigma #ED4SS), 18 mm d-glucose, pH 7.0 and 360 mOsm.
RECOVERY SOLUTION
Fifty percent (v/v) Culture Chow, 50% (v/v) HBSS, pH 7.0 and 390 mOsm.
CULTURE MEDIUM (IL-15)
The following substances were added to 500 ml of Leibowitz's L-15 culture media: 50 ml fetal bovine serum, 185 mg α-ketoglutaric acid, 200 mg d-(-)-fructose, 350 mg d-glucose, 335 mg d-l-malic acid, 30 mg succinic acid, 1.4 g TC yeastolate, 1.4 g lactalbumin hydrolysate, 0.01 mg niacin, 30 mg imidazole, 500 µg 20-hydroxyecdysone (20-HE), 100 U/l penicillin, 100 U/l streptomycin and 2.5 ml stable vitamin mix (SVM). A 5-ml stock solution of SVM consisted of 15 mg aspartic acid, 15 mg cystine, 5 mg β-alanine, 0.02 mg biotin, 2 mg vitamin B12, 10 mg inositol, 10 mg chline chloride, 0.5 mg lipoic acid, 0.4 mg coenzyme A (Pharmacia Biotech 27-8300-02), 15 mg glutamic acid and 0.5 mg phenol red. The pH was adjusted to 7.0 with NaOH, and osmolarity was adjusted to 375 mOsm using mannitol to reach 360 and d-glucose to reach 375. The solution was then filter sterilized.
STANDARD INSECT SALINE
About 150 mM NaCl, 4 mM KCl, 2 mM CaCl2, 1 mM MgCl2, 10 mM HEPES; pH adjusted to 7.0 with NaOH, osmolarity adjusted to approximately 375 mOsm with mannitol (to reach 360) plus glucose (to go from 360 to 375). For the Ca2+-free solution, CaCl2 was replaced by MgCl2 and 1 mM EGTA was added. For the Ca2+-saturated solution, CaCl2 was increased to 5 mM. GABA, muscimol and baclofen solutions were made fresh each day in SIS.
INTERNAL PATCH-PIPETTE SOLUTION
About 150 mM K aspartate, 2 mM MgCl2, 10 mM NaCl, 1 mM CaCl2, 11 mM EGTA, 5 mM HEPES, pH 7.0 and 335 mOsm.
Actin/tubulin labeling of cultures
Cultures were labeled for actin/tubulin following the methods of Tucker and Tolbert (Reference Tucker and Tolbert2003). Cultures were rinsed in insect saline and then in K-PIPES buffer (80 mM K-PIPES (pH 6.8), 5 mM EGTA and 2 mM MgCl2), fixed with 0.5% glutaraldehyde in K-PIPES buffer. Cultures were treated with sodium borohydride (1 mg/ml in PBS, pH 8.0) to reduce auto-fluorescence due to glutaraldehyde, and incubated in a ‘block/perm’ buffer (0.2% bovine serum albumin and 0.1% Triton X-100 in PBS). The cultures were incubated in a 1:800 dilution of primary antibody (monoclonal α-tryosinated alpha tubulin, Sigma #T-9028) in block/perm buffer for 2 h at RT, followed by incubation in secondary antibody goat anti-mouse Cy3 (Jackson ImmunoResearch 115-165-003) and Alexa-488 phalloidin (1.25–2.5 µl/100 µl final volume, Molecular Probes, Inc. #A-12379) for 1.5 h at RT. After sequential washes in block/perm buffer, PBS, and finally distilled water, for 10 min each, the cultures were cleared and mounted in 80:20 glycerol:water.
Immunocytochemistry
ANTIBODIES
The anti-GABA antibody used was a rabbit polyclonal antibody raised against synthetic GABA conjugated to BSA with glutaraldehyde (GABA-G-BSA, Gemacbio #AP027, Cenon, France) as described previously (Oland et al., Reference Oland, Gibson and Tolbert2010). Antibody specificity tests conducted by Gemacbio via ELISA showed cross-reactivity ratios of 1/10,000 or less to β-alanine-G-BSA, glycine-G-BSA, d-aspartate-G-BSA and d-glutamate-G-BSA. In our experiments, pre-absorption with 100 µM GABA-G-BSA (Gemacbio #AG027) removed all labeling (not shown). We also used an anti-GABA antibody from Sigma (#A2052) which was developed against GABA conjugated to BSA and which produced equivalent results.
For both antibodies, no-primary antibody controls were carried out with each iteration of the protocol, and the control tissue was imaged using the same parameters as used for the antibody-labeled tissue.
To monitor AL morphology and ORN axon path finding following pharmacological blockade of GABA receptors, we used an antibody to Manduca Fasciclin II (MFasII) as described previously (Higgins et al., Reference Higgins, Gibson, Eckholdt, Nighorn, Copenhaver and Nardi2002; Gibson and Tolbert, Reference Gibson and Tolbert2006).
PROCESSING
For in situ labeling with the anti-GABA antibodies, the brains, including antennal nerves, of females of stages 2, 3, 4, 5, 6, 7, 9, 12 and 17 were dissected into cold insect saline, and then fixed, sectioned and processed as previously described (Oland et al., Reference Oland, Gibson and Tolbert2010). Following labeling for GABA or Fasciclin II, tissue was washed in 10 mM Tris buffer, pH 7.4, followed by a 1 h RT incubation in 1:10,000 Syto 13 (Molecular Probes #S-7575) in Tris buffer to label cell nuclei, then washed 1× with Tris buffer. The tissue was cleared in 50:50 (v/v) glycerol in H2O for 1 h, then mounted on glass slides in 80:20 glycerol:H2O.
For in vitro labeling with the GABA antibody (GEMAC), the same protocol was used except the tissue was not microwave fixed, wash times were reduced to 5 min each, and antibody incubation times were shortened to 1 day.
CONFOCAL MICROSCOPY
Images were collected on a Bio-Rad MRC 600, a Nikon PCM 2000 or a Zeiss Meta 510 laser scanning confocal microscope using the appropriate filters and lasers. For cultures, starting at the top of a dish and working from left to right, images were taken of each field that contained one or more neurons that had minimal or no contact with other neurons and that had morphologies that made it possible to trace their individual processes (e.g. no processes making multiple overlying loop or processes with extensive flattened sections). When the edge of the dish was reached the frame was shifted down, and then surveyed from right to left. This was repeated until at least 30 fields were imaged or until all usable neurons were imaged, whichever came first. Subsequent image processing with Corel Draw included only changes in brightness and contrast.
Analysis of neurons and glial cells
Using a digitizing tracing monitor (Wacom) and Compix Simple PCI software, the processes of each neuron were traced. To ensure standardized tracing, rules were developed to define where a process started and ended, what defined a branch, and what to do with expansions and growth cones. Two investigators traced a set of neurons following these rules, and their results agreed within 95% (data not shown). All neurons included in the data set analyzed here were subsequently traced by one investigator who was blinded to treatment. Data were collected on length of individual processes, total (summed) length of all processes and number of branches. All tubulin-containing processes were traced, regardless of length.
Data were analyzed using SPSS for Windows. Data were non-normal (Kolmogorov–Smirnof test) and normality was not achieved through data transformations. We therefore analyzed the data using non-parametric statistics. For each cell, we determined mean branch length, number of branches and total branch length, and then compared these across treatments using Kruskal–Wallis tests. Post-hoc comparisons were made using Mann–Whitney, with Holmes sequential Bonferroni to correct for multiple comparisons. Significance values with these tests are calculated as exact P values, and data are plotted as medians; the box plots show outliers (greater than 1.5 times the interquartile range).
Process extension by glial cells was more simply examined using phase optics. For each dish, a series of 25–35 contiguous fields were imaged with simple PCI and printed. Overlap between adjacent fields was indicated on the prints to avoid counting any cell twice. Each cell was scored as having no, some (1–4) or multiple (>4) processes.
Reverse transcription and polymerase chain reaction
Neuropil and sorting zone glial cells (both centrally derived) were isolated from 16 female stage-5/6 ALs following the standard culture procedures above, but were not plated. After rinsing and centrifuging in IL-15, fluid was reduced to approximately 30 µl. TRIzol LS Reagent (Invitrogen #10296-028) was used following the manufacturer's directions to isolate total RNA. cDNA was generated with oligo-dT primers using the Omniscript RT Kit (Qiagen #30511) following the manufacturer's instructions. A control reaction was performed in which the reverse transcriptase was omitted. PCR was run using RedTaq DNA polymerase (Sigma #D-4309), 1 µl of cDNA, 200 µM dNTPs and each primer at 1 µM. Thirty-five cycles were run at 94°C for 20 s, 56°C for 20 s and 72°C for 30 s. We had cloned GABAA and GABAB receptor fragments from a Manduca sexta cDNA library. Using those sequences, specific primers were designed with Primer Premiere (Biomedal), against the Manduca GABAB R1 (ACAATGTTCGAGTTCCGGTCTT and CGGTTTCTCAATGGCTTAC) and the GABAA-type ligand-gated chloride channel homolog 3 (LCCH3) receptor (GCAGCGGCTGATCGACT and TCTCTTCGGGCAAACC) sequences.
RESULTS
The possibility of a GABA-based interaction between the dendrites of AL neurons and glial cells depends first on the presence of temporal and spatial overlap. Figure 1 shows GABAergic dendrites in the AL neuropil at stage 4 (Fig. 1A,D), just after the first ORN axons have entered the nerve layer, at stage 5 (Fig. 1B,E), as glomeruli are just beginning to form, and at stage 12 (Fig. 1C,F), by which time the architecture of the olfactory glomeruli has been well established. At stage 4, the glial cells form a rind around the neuropil and GABAergic dendrites reach up to the glial rind, with only an occasional process extended as far as 5–6 µm, into the rind. By the end of stage 5, the ingrowing ORN axons have formed protoglomeruli just below the glial rind and glial cells have begun to migrate and extend processes around each protoglomerulus. The axonal protoglomeruli largely, but not entirely, separate the dendrites of the GABAergic neurons from the glial cells. Thus, there is a short period of time just prior to and during the early phase of axon ingrowth when the dendrites of GABAergic AL neurons could interact with the glial cells, either directly from neuron to glial cell, influencing the subsequent development of the glial cells or indirectly from neuron to glial cell and back to neuron, thus affecting neuronal development.
In addition to the robust labeling of AL neuron dendrites, we also found strong labeling of individual and bundled axons in the antennal nerve (Fig. 1G, arrows and arrowheads). We were able to follow the axon bundles to the antennal mechanosensory and motor center (AMMC) posterior to the AL (Homberg et al., Reference Homberg, Montague and Hildebrand1988, Reference Homberg, Hoskins and Hildebrand1995). In sections of stage-6 and -7 ALs, we also noted a few GABA-positive processes, most short but some of considerable length, within the bundles of receptor axons entering glomeruli (Fig. 1H). We could not unambiguously determine whether these were dendrites, perhaps those extending at earlier stages into the glial rind or newly extending dendrites, or axons entering the glomeruli. These processes are not present in the ALs of stage-18 animals.
Do neuropil glial cells express GABA receptors and transporters?
A second requirement for an effect of GABA on developing glial cells is glial expression of one or more receptors for GABA and/or expression of a GABA transporter. By stage 4, a relatively small subset of the neuropil glial cells, called complex glial cells, strongly express a functional GABA transporter (Oland et al., Reference Oland, Gibson and Tolbert2010) while the majority of neuropil glial cells show no immunocytochemically detectable transporter expression but do show barely detectable GABA uptake in functional tests. The complex neuropil glial cells maintain strong expression into adulthood.
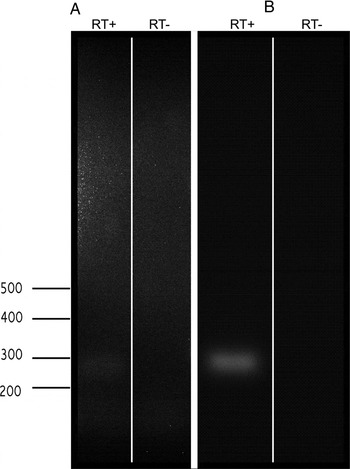
To test whether one or more GABA receptors are expressed within the population of neuropil glial cells, we dissociated glial cells from ALs in which the perineurial and subperineurial sheaths and all three neuronal clusters were removed, and then used RT-PCR to determine if they express RNA for either GABAA or GABAB subunits. We found a strong band for the GABAB receptor subunit and a much weaker band for the GABAA subunit (Fig. 2), suggesting that this population of glial cells expresses mainly a metabotropic form of the GABA receptor, but also expresses a low level of an ionotropic form.
RT-PCR on dissociated neuropil and sorting zone glial cells. RNA was isolated from dissociated cells and subjected to RT-PCR in the presence (RT+) or absence (RT−) of reverse transcriptase. RNA was then subjected to PCR with primers against either (A) a GABA-A receptor subunit or (B) a GABA-B receptor subunit. A strong band can be seen in the GABA-B lane and a weak band can be seen in the GABA-A lane after increasing the exposure time.

Do AL neurons express GABA in culture?
Because it was necessary to separate direct and indirect effects of GABA, we used a cell culture approach in which cell types could be separated from each other. We asked whether GABA was expressed by cultured AL neurons, first to ensure that the in vitro developmental expression patterns reflect the in vivo pattern and second to know whether the neurons in the dish could be an endogenous source of GABA in the in vitro experiments.
Our current in vivo data, and that of Hoskins et al. (Reference Hoskins, Homberg, Kingan, Christensen and Hildebrand1986), indicate that GABA immunoreactivity is present only in about 30% of the neurons, and only in neurons belonging to the lateral group of cell bodies. The lateral group includes both local and projection neurons. Developmentally, Homberg and Hildebrand (Reference Homberg and Hildebrand1994) indicated that GABA-immunoreactivity disappeared from the lateral group neurons from shortly before the larva-to-pupa transition through approximately stage 4 of the 18 stages of metamorphic development. For a short time thereafter, they found that nearly all the neuronal cell bodies in the lateral group showed some level of labeling, after which the adult pattern gradually emerged. In our hands, however, with a different antibody, we found labeling throughout adult metamorphic development, with less obvious variation in labeling intensity. Figure 1 thus shows results from our study, focusing on the range of stages of most interest for this study.
Neurons (n = 2236) were dissociated from ALs of different stages (stage 2: before ORN axon ingrowth; stage 5: during the period of ingrowth; stage 9: at the end of axon ingrowth; and stage 12, when the adult pattern of GABA expression is well established). Neuronal expression of GABA was examined after 2 weeks in vitro because AL neurons reach a stable morphology after 1 and 2 weeks in culture (Oland and Hayashi, Reference Oland and Hayashi1993). In addition, because neurosteroids have been shown to change glial morphology and to enhance the efficacy of GABA at certain neuronal GABAA receptors (Mong et al., Reference Mong, Nuñez and McCarthy2002; Wohlfarth et al., Reference Wohlfarth, Bianchi and Macdonald2002; Bianchi and Macdonald, Reference Bianchi and Macdonald2003; Lambert et al., Reference Lambert, Belelli, Peden, Vardy and Peters2003), we tested the effect on GABA expression of exposure to the steroid hormone 20-HE, which has a major role in choreographing metamorphic development and shows a dramatic rise in titer during the period of axon ingrowth (Weeks, Reference Weeks2003). No significant differences in pattern of GABA expression were seen in cultures exposed to 0.2 or 1.0 µg/ml 20-HE, the titers found during this ingrowth period (Kirschenbaum et al., Reference Kirschenbaum, Higgins, Tveten and Tolbert1995). Because there were no differences, the two groups were combined.
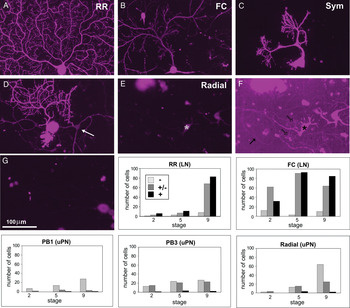
Within the population of neurons isolated from the ALs, several subtypes can be identified routinely by their distinctive morphologies (Hayashi and Hildebrand, Reference Hayashi and Hildebrand1990; Oland and Hayashi, Reference Oland and Hayashi1993). Figure 3 shows examples of GABA immunolabeling in some of these subtypes. Of these, three are known to be projection neurons based on their presence in cultures made solely from the medial group of neurons, which contains only uniglomerular projection neurons, as well as the presence of a long thin axon-like process (Fig. 3D, arrow). The others (Fig. 3A–C) are probable local interneurons based on cell-body diameter, absence of an identifiable axon and tissue source (only from the lateral cluster). Neuronal labeling was scored simply as strongly (+), weakly (±) or not (−) present. The graphs in Fig. 3 show that projection neurons typically are strongly negative or only weakly positive while local interneurons are weakly or strongly positive, particularly at stage 5 and older, consistent with the in vivo data.
GABA is expressed in some AL neuronsin vitro. All images in this series collected with the same parameters. AL neurons grown in culture for 2 weeks display distinct morphologies. Neurons in A–C are local interneurons, expected to be GABAergic in vivo. (D) Shows a strongly labeled local interneuron and a weakly labeled projection neuron (arrow). (E,F) The dendrites of a known projection neuron subtype are visible only when the gain is greatly increased (F) to allow determination of the cell's morphological identity. (G) No-primary control. Some cell bodies are auto-fluorescent. In each dish at each of three stages, all clear examples of each of six neuronal subtypes, three local interneurons (LN) and three projection neurons (PN), were identified using phase optics. There were not enough neurons meeting the criteria for the Sym subtype to be quantified, but this subtype is a known local interneuron and is GABA-positive. Each neuronal subtype has a characteristic stage-dependent expression pattern. The LNs were GABA-positive while the PNs were either negative or only weakly positive, mirroring the pattern seen in vivo.

Is there a direct effect of GABA on the morphology of AL neurons in culture?
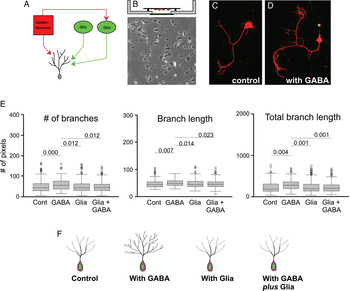
To determine whether GABA affects AL neurons directly, or indirectly via effects on glia, we compared the effect of extrinsically applied GABA on the morphology of AL local interneurons when grown with and without glial cells (Fig. 4A). An initial dose–response test in vitro (not shown) indicated that the outgrowth of AL neurons was affected by GABA at doses of 100 nM or less; higher doses elicited no changes, possibly because of desensitization in the continuous presence of relatively high doses of GABA. In subsequent experiments, we used a dose of 100 nM GABA added 1 h after plating. All experiments were carried out in the bridge configuration described in Methods and shown in Fig. 4B. This configuration was used so that we could directly compare the results in these experiments, in which only neurons were present, to those of later experiments in which glial cells were added to the bottom of the well.
Direct versus indirect effects of GABA on neuronal morphology.n = 1036 neurons. (A) Schematic diagram of possible effects of GABA on AL neurons or glia. GABA released by GABAergic interneurons might directly affect interneurons, or might directly affect glial cells, causing them to affect the interneurons. Both of these types of effects could be further modified by direct, GABA-independent signaling from glial cells. (B) Experimental set-up and typical glial density in the well. No direct contact between neurons on the overlying coverslip and glia in the well. Total of six divisons. (C,D) Two local interneurons, labeled with the anti-tubulin antibody, on the left (control) a neuron grown without exposure to GABA or glia and on the right, a neuron grown in the presence of GABA, but not glia. (E) Comparison of neurons grown with and without glia and/or GABA. Because the distributions were not normal, non-parametric statistics were used. Error bars represent the median absolute deviation and significant P equals values are shown. (F) Schematic diagram showing effects of GABA (100 nM) with and without glia. GABA increases arbor size and complexity; the presence of glia alone has no effect; the presence of glia during GABA exposure counters the direct GABA-mediated increase in size and complexity.

Analysis was carried out at 6 days in vitro, so that we could compare these neurons to those grown in the presence of shorter-lived glial cells. At this time point, it is more difficult to reliably identify all of the known neuronal types by their morphology so we chose to compare all neurons that plausibly met the morphological criteria for a local interneuron, specifically, the absence of a long axon-like process and the presence of a multiply branched arbor. Thus the population examined is a mixed population of interneurons, some of which in vivo would have had highly branched bushy arbors and others of which would have had more sparsely branched arbors with longer individual branches. The neurons were dissociated from stage-5 ALs and grown in the presence of 1 µg/ml 20-HE as these are conditions under which the neurons have been best characterized in culture, and 1 µg/ml is approximately the hemolymph titer measured at the time of dissociation (Kirschenbaum et al., Reference Kirschenbaum, Higgins, Tveten and Tolbert1995), and cultures maintain the largest number of healthy neurons that survive for the longest period when grown under these conditions (Hayashi and Hildebrand, Reference Hayashi and Hildebrand1990; Oland and Hayashi, Reference Oland and Hayashi1993; Oland and Oberlander, Reference Oland and Oberlander1994). At the time of dissociation, most interneurons in vivo would be GABA-positive and would have been exposed for about a stage (~1 day) to receptor axons (the period of ingrowth begins at late stage 3 to stage 4, continuing to stage 9). The neurons were labeled with an antibody against tubulin, imaged with the confocal microscope and the arbors traced on a digitizing pad (n = 1036 neurons).
All the neurons in the full data set (control, glia only, GABA only and glial + GABA) came from the six experiments in which the data from the control dishes were statistically the same. Thus, for each condition, we combined the data from all six experiments. In the presence of 100 nM GABA, the summed length of the processes comprising the cells' arbors (total length), the number of branches and mean branch length all increased significantly compared to the no-GABA control (n = 322, U = 6546.5, P = 0.000; U = 2705, P = 0.007; and U = 7080, P = 0.004, respectively) (Fig. 4E). Thus exposure to low concentrations of GABA increased the total size and branching complexity of the arbors of AL interneurons (Fig. 4F).
Is there a direct effect of glial cells or an interaction between GABA and glial cells that indirectly affects the outgrowth of AL neurons in culture?
Neurons were grown on the overlying coverslip in the bridge configuration, but now with glia in the well below, with and without the addition of 100 nM GABA, to test first, whether a diffusible signal from the glia could affect process outgrowth and second, whether one consequence of activating GABA receptors on the glial cells could be an effect on neuronal outgrowth. Glia alone had no significant effect on any parameter compared with control. Comparison of GABA-treated cultures with those exposed only to glial cells revealed that AL neurons grown in the presence of GABA had significantly greater number of branches (n = 404, U = 9803, P = 0.012), mean branch length (U = 9869, P = 0.014) and total length (U = 8883, P = 0.001).
When AL neurons were grown in cultures exposed to glial cells and treated with 100 nM GABA, however, the effects of GABA on arbor size and branching were blocked, bringing the changes back to control values (Fig. 4E,F) and significantly different from the values seen in GABA-treated cultures (number of branches: n = 316, U = 7149, P = 0.012; mean branch length: U = 7312, P = 0.023; total length: U = 6562, P = 0.001). This finding supports the hypothesis that the glial cells do respond directly to GABA in a non-contact-dependent manner and that the consequence of that response counters the arbor-increasing effect found with GABA alone.
Is there a direct effect of GABA on the morphology of neuropil glial cells?
There are two sub-types of neuropil glial cells in the Manduca AL, the small (5–6 µm in diameter) simple or ensheathing type that forms a multi-layered envelope around each glomerulus, and the much larger and highly branched complex glial cells that invest the glomerular neuropil and ensheathe the large dendrites as they enter at the base of a glomerulus. Synapses do not appear in the developing glomerular neuropil until about stage 6, but at no time in development are the processes of complex glial cells directly associated with synapses (Oland et al., Reference Oland, Orr and Tolbert1990, Reference Oland, Gibson and Tolbert2010). Approximately 75–100 ensheathing glial cells and 1–10 complex glia are associated with each glomerulus; under culture conditions, the vast majority of glia in the dish are simple glia. Larger glial cells are seen only very rarely.
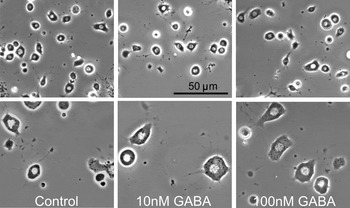
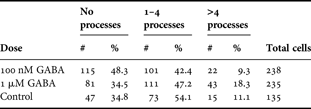
Simple neuropil glial cells in the developing AL normally extend processes laterally within the glial border during stages 4–5 (Oland et al., Reference Oland, Marrero and Burger1999), at the time that GABA-positive processes are adjacent to and penetrating into the border (Fig. 1). The few complex glial cells present at this stage are extending branches into the neuropil. We asked whether GABA might have a direct effect on glial process extension by exposing neuropil glial cells in culture to GABA (Fig. 5) and counting the number of processes extended by 2 days in vitro. No significant differences were found (Table 1, n = 608) in process number and visual inspection showed no qualitative differences in process shape.
Neuropil glial cells exposed to GABAin vitro. At 2 days in vitro, neither cell-body size nor number of processes extending from the cell body changed in response to GABA.

Direct effect of GABA on glial morphology.
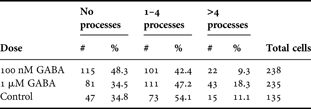
No significant difference in process number was found among glial cells exposed to standard media or to either of two doses of GABA that elicited changes in neuronal morphology.
Do neuropil glial cells show an electrophysiological response to GABA?
These experiments were completed in culture to avoid both the strong coupling among glial cells present at these stages in vivo (Oland et al., Reference Oland, Marrero and Burger1999) and any indirect effects on glial cells that might arise due to neuronal responses to GABA. Neuropil glial cells typically have a shorter life span in culture than do AL neurons, ~3 days compared to ~3 weeks. We recorded from cultured neuropil glial cells after 1 day in vitro (Fig. 6A). During this time frame, they present with morphologically well-defined membranes and nuclei and in time-lapse recordings show continuous fine filipodial activity (not shown). Because these glial cells do couple in culture as shown by Lucifer yellow injection (Oland, not shown), we specifically chose well isolated glial cells for recording.
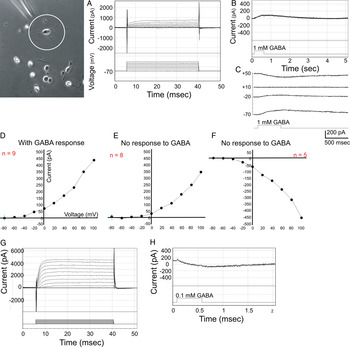
Currents induced by 1 mM GABA. Image shows morphology of neuropil glial cells after several hours in culture; patch electrode approaching from top left. (A) Typical outward whole-cell currents in response to a family of 10 mV voltage steps. (B) Only about half of 17 glial cells responded to GABA, showing an outward current that reversed (C) at about 10 mV. In glial cells that responded to GABA, the current evoked by a family of voltage steps activated at about −40 mV (D) while the current in those that did not respond activated at about −20 mV (E). Five glial cells had an inward current profile (F); only one of these responded to GABA. Of five additional cells for which no I/V relationship was obtained, three showed an outward response to GABA and two showed no responses. Rare neurons appear in these cultures, easily identified by their size and shape, but at one1 div, neurons generally have no inward currents (G); these develop as they grow significant processes. They responded more robustly to less GABA (0.1 mM) with an inward current (H).

From a holding potential of −70 mV in whole-cell mode in AIS recording saline, 17 of 40 neuropil glial cells responded to application of GABA with an outward-going current that reached a plateau maintained for the duration of the step (Fig. 6A). Nine of these cells (Fig. 6B,D) responded to pulses of 100 µM–10 mM GABA with an outward current that reversed at 10 mV (Fig. 6C), above the reversal potential predicted from the equimolar transmembrane chloride concentration established for these experiments; the others (Fig. 6E) showed no response. Five other neuropil glial cells had inward currents (Fig. 6F); only one of these responded to GABA, with an outward current indistinguishable from that seen in cells with an outward whole-cell current (not shown).
The rare neuron that eluded our neuron-exclusion protocol was easily recognized by its obviously larger soma size and had branched arbors, consistent with their usual morphology in vivo. These cells had an initial resting potential of −45 mV and showed a neuronal current profile typical for AL neurons after 1 day in culture, that is there was no fast inward current; this current was shown previously to develop only after several days in culture (Hayashi and Hildebrand, Reference Hayashi and Hildebrand1990).
Do neuropil glial cells show a change in calcium in response to GABA?
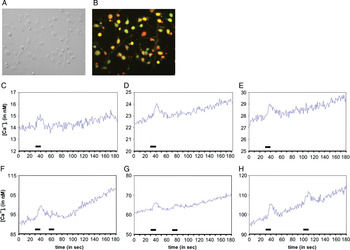
Mirroring the pattern seen in whole-cell recordings, only a small subset of glial cells responded to GABA with a change in calcium as revealed by imaging with fura 2 (Fig. 7A,B). Glia were accepted for recording if they responded to 25 mM KCl challenges. Previous developmental experiments had shown neuropil glial cells to be capable of responding to a KCl challenge by late stage 5/stage 6 (Lohr et al., Reference Lohr, Heil and Deitmer2005). In three experiments using neuropil glia isolated 2–5 h earlier from stage-5/6 ALs, small (5–15 nM), slow (rising to a peak over 10–15 s) increases in internal calcium were elicited in response to 10-s pulses of 1 µM GABA, muscimol or baclofen (Fig. 7C–E), but only in a subset of the glial cells (16 of 48 cells). Paired pulses of 1 µM muscimol showed reduction in amplitude of the second pulse if the interval between pulses was less than about a minute (Fig. 7F–H). 37% of the glia tested also responded to baclofen (1 µM) with a similarly small-amplitude slow response. Saline-only trials elicited no responses (not shown).
Calcium responses in dissociated central glial cells. Bright field (A) and fluorescence (B) images of cultured glial cells. Glial-cell responses to GABA and GABA agonists (C–E) as measured in acutely isolated cells using fura-2. Some, but not all, developing neuropil glial cells respond to 1 µM GABA and both GABA-A and -B agonists (1 µM) with small calcium transients. With paired pulses (F–H), recovery of the response to muscimol requires a minute or more.

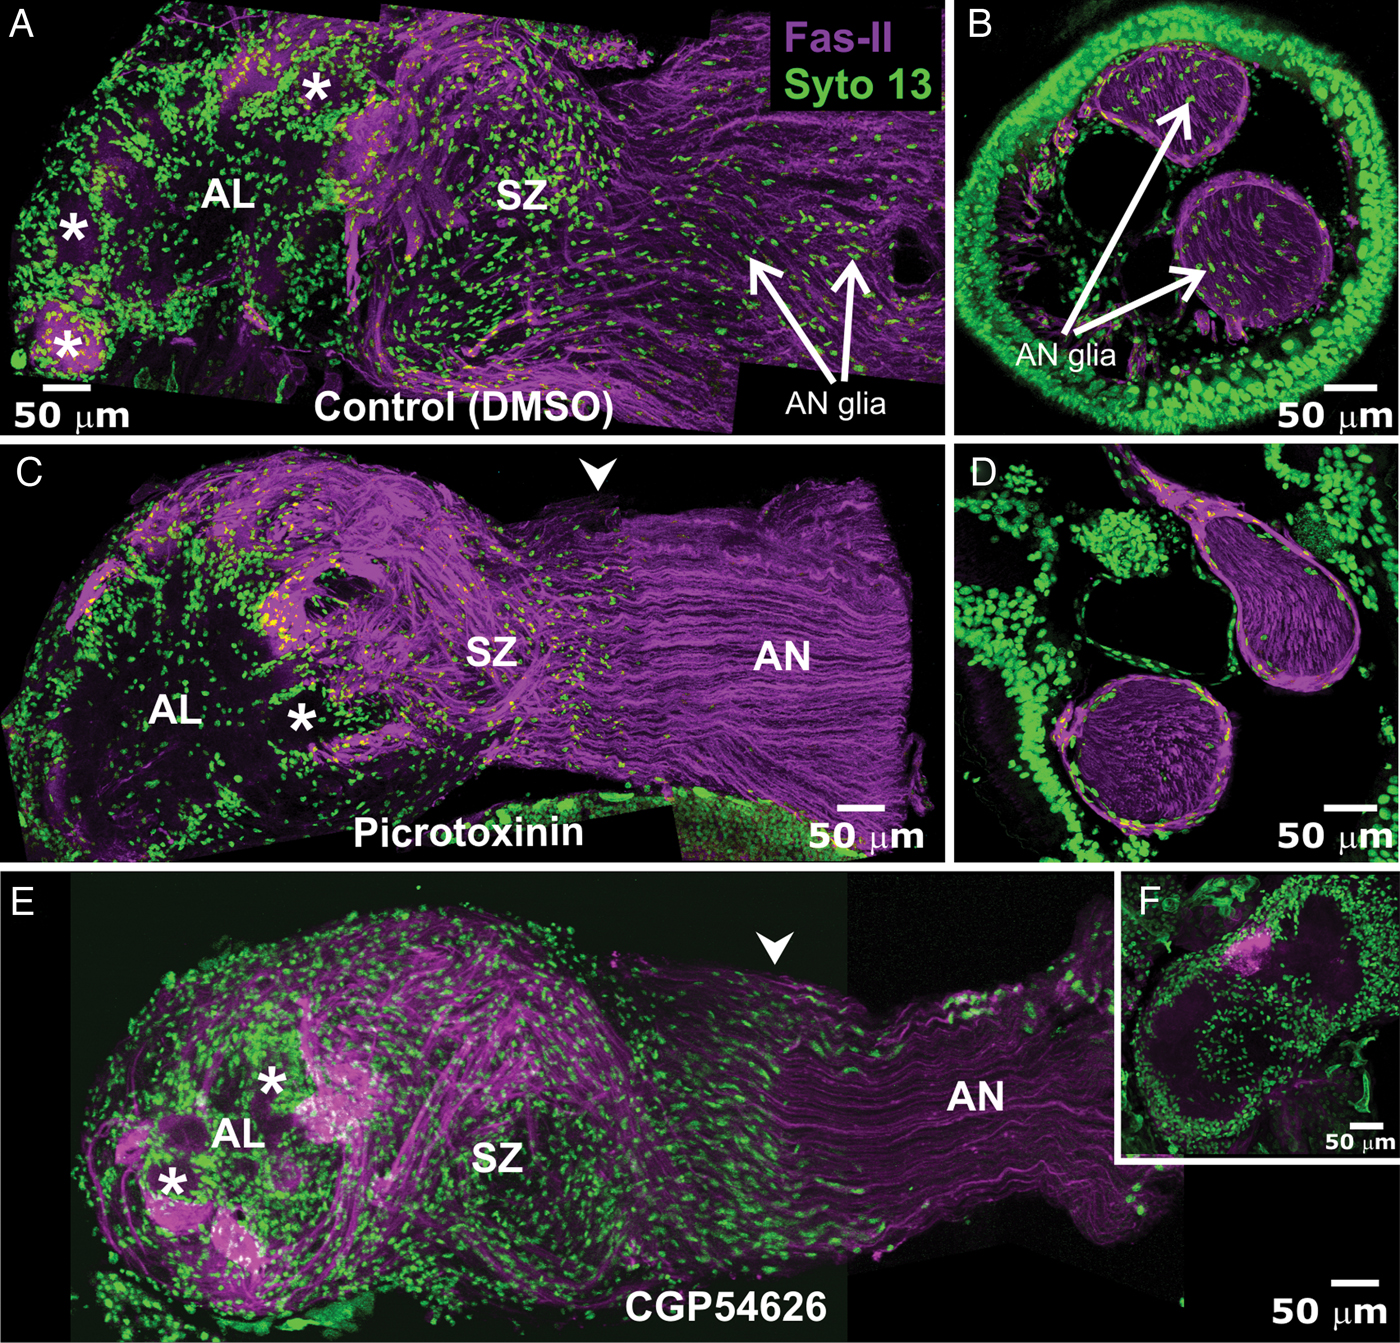
An obvious question is whether there is a developmental effect of blocking GABAA and GABAB receptors in vivo. Single injections of the GABAA receptor antagonist picrotoxinin (10–600 µM final, n = 9) were made late in stage 3. At this stage, antennal nerve glial cells are beginning to migrate into the nerve, the first ORN axons reach the AL, protoglomeruli have not yet begun to form in the lobe and the neuropil glial cells have not yet begun to migrate into the neuropil. The timeline of subsequent development was delayed in the animals treated with higher doses by several to many days, and at the highest doses of picrotoxinin tried, the pupal cuticle developed multiple breaks. After a single dose, there were no visually obvious effects on the glial or axonal organization of the nerve or on the architecture of the AL. However, in ALs taken from stage-10 animals (ORN axon ingrowth complete) that had been treated with 7 daily injections of 50 mM picrotoxinin (175 µM final assuming 2-ml hemolymph volume) beginning at stage 3 (n = 4), the thickness of the glial borders around each glomerulus was reduced, the density of glial cells in the sorting zone was reduced (Fig. 8C) and peripheral glial cells were essentially absent from the antennal nerve branches in the antenna (Fig. 8D) and from the intracranial portion of the antennal nerve (Fig. 8C).
Blocking GABA receptors reduced glial migration in the antennal nerve (AN). In all images, the subset of ORN axons that are Fasciclin-II positive (magenta) is used to show the pattern of axons in the AN, SZ and AL. Approximately one-fourth of the glomeruli normally receive FAS-II-positive axons. (A,B) Stage 10: AN glia migrated normally in all regions of the primary olfactory pathway, including in the nerve branches in the antenna (B), in control animals (vehicle only). By stage 10, AN glia have migrated along the entire AN, with the most proximal stopping just distal to the sorting zone (arrows in A). Neuropil glial cells have migrated around the glomeruli (*). (C,D) Stage 10: After chronic treatment (7 × 175 µM final) with picrotoxinin to block GABAA-like receptors, there were fewer glia in the SZ and AL but those present migrated to normal positions. Peripheral glia were absent from the AN (C) and from nerve branches in the antenna (D). (E) Stage 10: After chronic treatment (9 × 280 nM final shown) with CGP54626 to block GABAB-like receptors, migration of peripheral glia into the AN was again absent. SZ glia migrated beyond their normal range – compare position of arrowheads in C and E and NP glial migration appears normal. In this section, the portion of the AL visible is the most anterior surface, the stack of optical sections including both the nerve layer and the most apical parts of the anterior glomeruli. (F) Deeper in the same AL, most NP glia were found to have failed to migrate to surround glomeruli. Some glial cells did migrate to partially populate the coarse neuropil. (A,C,E) 30-μm stacks. (B,D,F) 20-μm stacks.
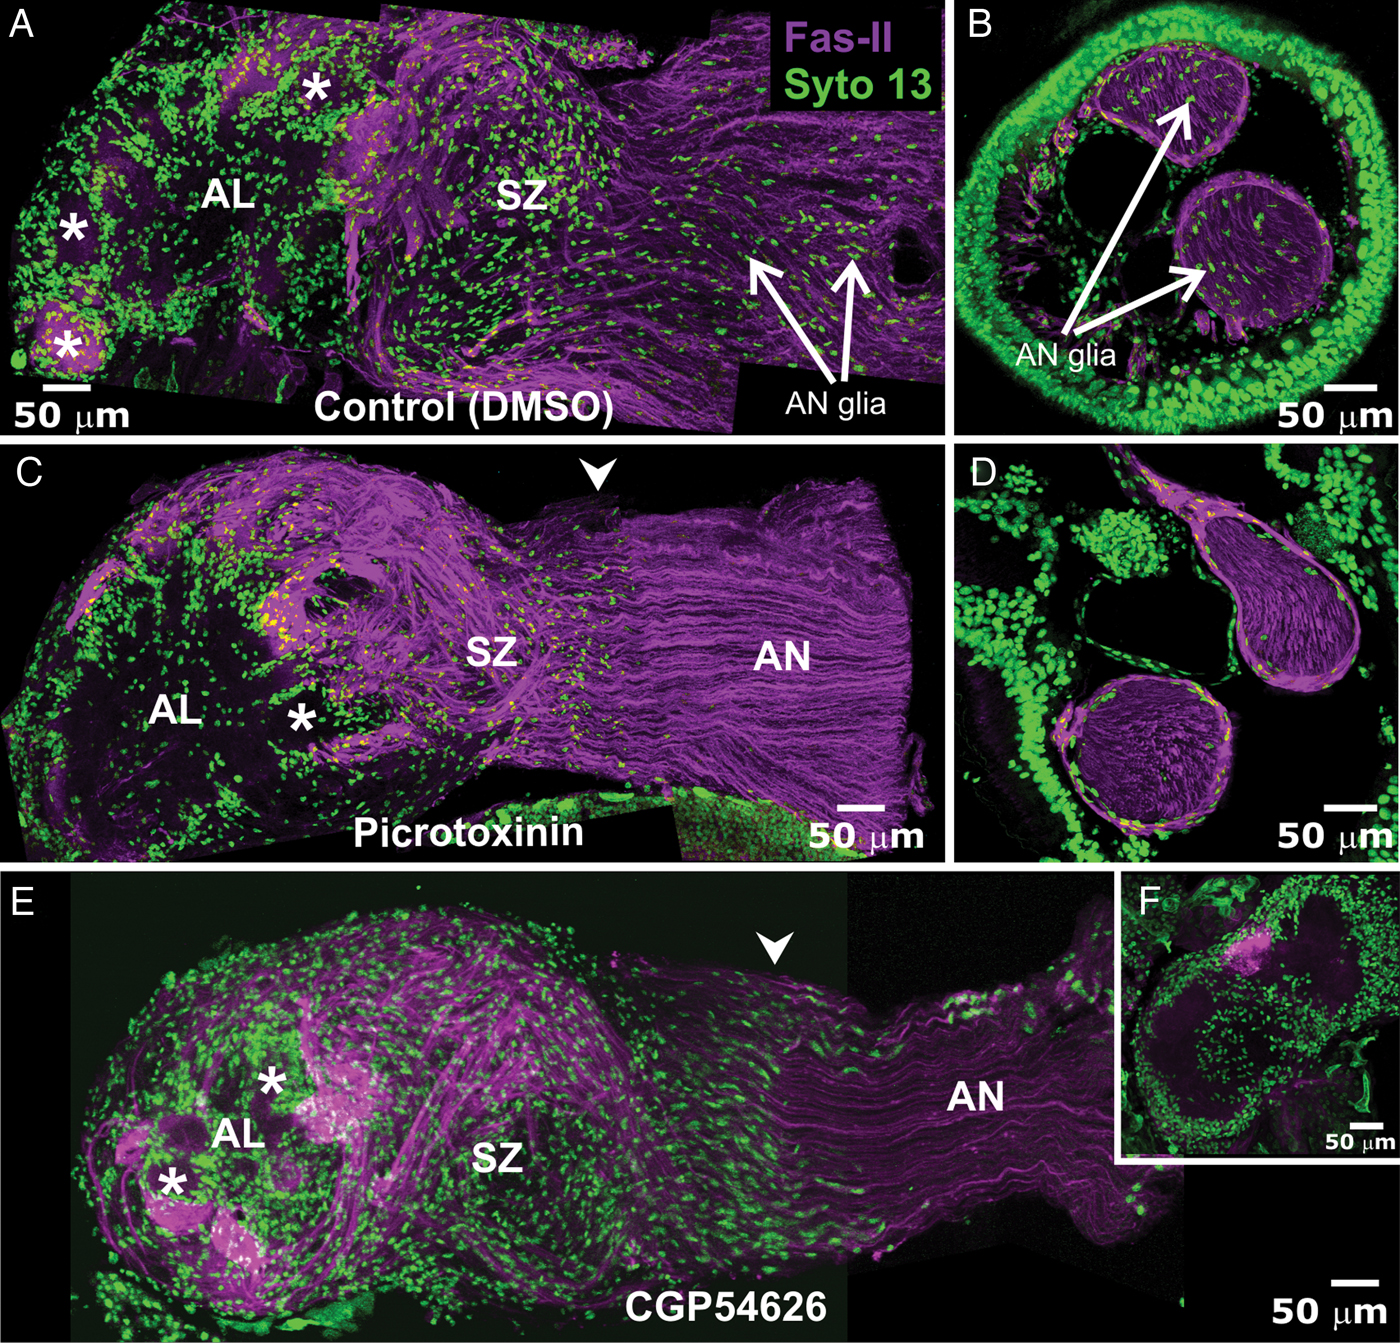
When animals were chronically treated for 8–9 days with daily injections of the GABAB-like receptor blocker CGP 54626 HCl that yielded final concentrations of 28, 56, 140 and 280 nM/injection (n = 4 each), AN glia were absent from the intracranial portion of the antennal nerve (Fig. 8E) and severely reduced more distally (not shown). The density of glial cells in the sorting zone appeared to be normal, but many glial cells had migrated further into the nerve than normal. Axons traversing the sorting zone followed a normal pattern of fasciculation. Across and even within the preparations, the extent of formation of glomerular borders by glial cells varied from robust glial borders (Fig. 8E) to little and/or aberrant migration (Fig. 8F). The animals progressed developmentally at a normal rate.
Summary of results
We determined the following:
1. GABA is present in some of the axons in the antennal nerve and in the dendrites of a subset of AL neurons during the time that ORN axons are growing into the AL.
2. Neuropil glial cells can express GABAA- and GABAB-like receptors, predominantly the latter.
3. Close to half of cultured glial cells respond to GABA with a small outward current and about a third respond to GABA with small increases in intracellular calcium.
4. Cultured AL local interneurons respond to the presence of GABA with an increase in dendritic arbor size and complexity. Glial cells show no morphological response to GABA.
5. The presence of GABA-exposed glial cells in cultures of AL neurons eliminates the enhanced dendritic growth of the neurons that was induced directly by GABA.
6. Chronic pharmacologic blockade of GABAA-like receptors in vivo reduces the presence of glial cells around the developing glomeruli, in the SZ, and eliminates or substantially reduces the number of peripherally derived antennal nerve glial cells from the nerve. Blockade of GABAB-like receptors also eliminates migration of peripheral glial cells into the antennal nerve and leads to overextended migration of SZ glia, but has a variable effect on migration of neuropil glia.
DISCUSSION
Sources of GABA in the developing AL
The current study extends the initial report of Homberg and Hildebrand (Reference Homberg and Hildebrand1994) that showed GABAergic processes to be present in the AL neuropil at the time of initial ORN axon ingrowth. The fact that the dendrites of GABAergic neurons extend up to the glial layer around the neuropil at early stages sets up the possibility that GABA could be released from these dendrites into the direct vicinity of glial cells.
At stage 4, almost no synapses are present in the AL neuropil, and even stage 7 is early in the phase of synaptogenesis within the glomerular neuropil (Tolbert et al., Reference Tolbert, Matsumoto and Hildebrand1983; Oland et al., Reference Oland, Orr and Tolbert1990), so synaptic release of GABA would not be expected before stage 7. In Manduca, spontaneous action potentials can be recorded in AL neurons as early as stage 4 of the 18 metamorphic stages and in olfactory receptor axons beginning at stage 7, but first can be induced in the AL neurons by nerve stimulation only at stage 9 (Matsumoto and Hildebrand, Reference Matsumoto and Hildebrand1981). Chronic treatment with TTX to block spontaneous action potentials during early metamorphic stages elicited no change in the gross morphology of glomeruli, in either migration or process extension by neuropil glial cells, or in the characteristic dendritic arbor of the 5-HT neuron, a uniquely identifiable neuron with a developmental pattern that mirrors that of the local interneurons in the AL (Oland et al., Reference Oland, Pott, Bukhman, Sun and Tolbert1996). Nor, in all of our various EM studies of the developing glial border, have we ever detected neuron–glial synapses such as those found between vertebrate NG2 cells and axons (Bergles et al., Reference Bergles, Jabs and Steinhauser2010). Thus the effects we report are unlikely to be arise from GABA released at synapses.
In the current study, GABA-positive processes also were found in the nerve layer of the lobe, in the antennal nerve and in the axonal sorting region of the nerve that lies just outside the AL (Figs 1 and 3 of Oland et al., Reference Oland, Gibson and Tolbert2010). We expect that most of the axons in the sorting zone and in the nerve likely originate from cell bodies in the AMMC in the subesophageal ganglion. Although we could not definitively trace them to their cell bodies, many axons clearly coursed in the AL mechanosensory tract, and we could find GABA-positive axons in the base of the antenna where the muscles mediating antennal orientation attach (Kloppenburg et al., Reference Kloppenburg, Camazine, Sun, Randolph and Hildebrand1997) but not in the nerve branches in the antennal flagellum. Taken together, we suggest that the axons in the antennal nerve and the sorting zone belong to GABAergic motor neurons with cell bodies in the AMMC. On the other hand, GABA-positive processes in the nerve layer of the AL and in the most proximal part of the axonal sorting zone at stages 4–12 are likely to be dendrites of AL neurons that early in development extend short distances beyond their normal glomerular territory. We did not see these processes in animals examined at stage 18 (not shown), suggesting that they were eventually pruned back.
The consequence in any case is that during their navigation along the nerve, through the sorting zone and into the nerve layer, the ORN axons and glial cells in each of these regions would be in proximity to GABA-positive processes that could serve as a source of GABA. The rather loose packing of axons and dendritic processes in the nerve and neuropil at the earliest stages of axon ingrowth would allow GABA to diffuse readily from any site of release (Oland and Tolbert, Reference Oland and Tolbert1987). The GABA transporter is expressed strongly by a subset of glial cells, in the sorting zone and in the AL, with short processes arrayed in the sorting zone and also extending into the neuropil just under the glial layer. Thus they are physically located in regions of axon ingrowth and are capable of GABA uptake at early stages, but their actual contribution to GABA uptake at the earliest stages is not known (Oland et al., Reference Oland, Gibson and Tolbert2010). Peripheral glia do not express the GABA transporter (Oland et al., Reference Oland, Gibson and Tolbert2010).
Taken together, the evidence would suggest that non-synaptic release from dendrites, or from axons in the nerve, is the probable main source of GABA in the developing olfactory pathway during early developmental stages.
GABA receptor expression in the AL
It is no surprise to find GABA receptors in the brain of a moth. GABA is a key inhibitory transmitter in both vertebrates and invertebrates, and in the moth AL in particular, GABA is the transmitter for most, if not all, of the local interneurons and for some of the multi-glomerular projection neurons (Homberg and Hildebrand, Reference Homberg and Hildebrand1994).
The structure of GABA receptors from a wide variety of animals has been well described. Among the invertebrates, the completely sequenced genomes of Drosophila melanogaster, Apis mellifera and Tribolium castaneum have been annotated (Buckingham et al., Reference Buckingham, Biggni, Sattelle, Brown and Sattelle2005; Jones and Sattelle, Reference Jones and Sattelle2006, Reference Jones and Sattelle2007; Jones et al., Reference Jones, Raymond-Delpech, Thany, Gauthier and Sattelle2006). They reveal three members of the GABAA receptor gene family: RDL (resistant to dieldrin), LCCH3 and GRD (GABA and glycine-like receptor of Drosophila). The silkworm Bombyx mori recently was determined to have the largest insect GABAA receptor gene family characterized to date, with three RDL, one LCCH3 and one GRD subunit and with alternative splicing sites on two of the three RDL subunits, yielding eight splice variants (Yu et al., Reference Yu, Cui, Land, Zhang and Zhang2010). Based on the very high sequence similarity between multiple known genes in Bombyx and Manduca, we expect a similar finding to emerge for the Manduca GABA receptors. Indeed, our preliminary review of the sequences for GABA receptors constructed from Manduca scaffolds and CUFFLINK assemblies (Richard Gibbs, Principal Investigator, Baylor College of Medicine-Human Genome Sequencing Center, Manduca sexta Sequencing Project, personal communication; http://agripestbase.org/manduca/?q=blast) do show near complete identity with Bombyx sequences for all five GABAA receptors.
Three types of GABAB receptors have been detected in Drosophila, GABABR1–3. R1 and R2 form functional heterodimers and mediate G-protein activation (Mezler et al., Reference Mezler, Muller and Raming2001). The R3 form seems to be insect specific. Immunolocalization showed R2 to be widely distributed in the various neuropils of the brain of both larval and adult animals (Enell et al., Reference Enell, Hamasaka, Kolodziejczyk and Nässel2007) and electrophysiological studies have indicated that neurons respond in ways consistent with activation of GABAB receptors.
Although GABA clearly is functionally important in the insect, the pharmacologies of the known insect GABA receptors do not fit readily into the vertebrate GABAA, GABAB or GABAC category. Overall, the pharmacology of GABA receptor subtypes expressed in insect neurons remains poorly characterized and the existing data indicate heterogeneity among cell types, across developmental time, and across species suggesting that additional variants remain to be discovered (Waldrop et al., Reference Waldrop, Christensen and Hildebrand1987; Waldrop, Reference Waldrop1994; Hosie et al., Reference Hosie, Aronstein, Sattelle and ffrench-Constant1997; Cayre et al., Reference Cayre, Buckingham, Yagodin and Sattelle1999; Blein et al., Reference Blein, Hawrot and Barlow2000; Mezler et al., Reference Mezler, Muller and Raming2001; Sattelle et al., Reference Sattelle, Bai, Chen, Skeer, Buckingham and Rauh2003; Dzitoyeva et al., Reference Dzitoyeva, Gutnov, Imbesi, Dimitrijevic and Manev2005; Manev and Dzitoyeva, Reference Manev and Dzitoyeva2010).
GABA receptors and transporter in glial cells
To our knowledge, there are no studies in which distribution of GABA receptors in glial cells in the brain of the metamorphosing adult Drosophila or any other insect species was examined by immunocytochemistry. GABA receptors are known to be present in Drosophila neuroblasts and in cell bodies of the embryonic Drosophila CNS (Aronstein and ffrench-Constant, Reference Aronstein and ffrench-Constant1995; Aronstein et al., Reference Aronstein, Auld and ffrench-Constant1996) as well as in larval and adult neurons (Dzitoyeva et al., Reference Dzitoyeva, Gutnov, Imbesi, Dimitrijevic and Manev2005). However, expression of a variety of transmitter receptors, including GABA receptors, has been documented in vertebrate glial cells (Verkhratsky and Steinhauser, Reference Verkhratsky and Steinhauser2000). Astrocytes express both GABAA and GABAB receptors (Kaila, Reference Kaila1994; Möhler et al., Reference Möhler, Benke and Fritschy2001; Charles et al., Reference Charles, Deuchars, Davies and Pangalos2003; Bettler et al., Reference Bettler, Kaupmann, Mosbacher and Gassmann2004; Young et al., Reference Young, Platel, Nielsen, Jensen and Bordey2010). Activation of astrocyte GABAA receptors elicits a depolarizing response due to chloride efflux (Kettenmann et al., Reference Kettenmann, Backus and Schachner1984, Reference Kettenmann, Backus and Schachner1987; MacVicar et al., Reference MacVicar, Tse, Crichton and Kettenmann1989; Steinhauser et al., Reference Steinhauser, Jabs and Kettenmann1994) and these receptor-mediated depolarizing responses in turn elicit intracellular calcium transients (Bernstein et al., Reference Bernstein, Lyons, Möller and Kettenmann1996; Leinekugel et al., Reference Leinekugel, Medina, Khalilov, Ben-Ari and Khazipov1997). Activation of GABAB receptors also causes an excitatory response in astrocytes, in contrast to the inhibitory response evoked in neurons, and also induces calcium transients (Nilsson et al., Reference Nilsson, Eriksson, Rönnbäck and Hansson1993; Kang et al., Reference Kang, Jiang, Goldman and Nedergaard1998; Serrano et al., Reference Serrano, Haddjeri, Lacaille and Robitaille2006). Meier et al. (Reference Meier, Kafitz and Rose2008) showed that GABAB -mediated calcium signals in hippocampal astrocytes are developmentally regulated, the percentage of glial cells from which calcium transients could be recorded increasing dramatically during the first few post-natal weeks.
Previous work in the moth (Oland et al., Reference Oland, Gibson and Tolbert2010) revealed strong expression of a functional Manduca GABA transporter (MasGAT) (Umesh and Gill, Reference Umesh and Gill2002) in complex neuropil glial cells (Oland et al., Reference Oland, Gibson and Tolbert2010). The processes of these glial cells extend largely through the synaptic neuropil of each glomerulus, then branch extensively in the base of each glomerulus where the large dendrites of AL neurons enter. They achieve a roughly mature distribution of processes within the neuropil by stage 9, but this is well after the basic architecture of the glomeruli has been established. They continue to express the transporter in adulthood, and thus are likely to have a role in managing GABA levels within the glomerular neuropil of the functional adult AL (Fig. 9) (in this respect, potentially similar to olfactory bulb astrocytes in which GABA uptake evokes calcium transients; Doengi et al., Reference Doengi, Himet, Coulon, Pape, Deitmer and Lohr2009).
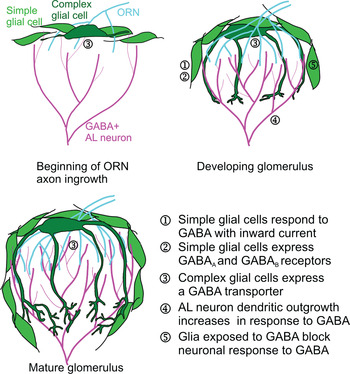
Schematic diagram of GABA-based interactions between neurons and neuropil glial cells during development and in the adult.

Few data exist for transmitter receptors expressed by insect glial cells. Heil et al. (Reference Heil, Oland and Lohr2007) showed neuropil glial cells from both metamorphic and adult Manduca ALs to be responsive to ACh via cholinergic receptors, and blocking receptor activation reduced migration of these glial cells to form glomerular boundaries. In the current study, RT-PCR of central glial cells showed the presence of both a GABAA-like (LCCH3) and a GABAB-like receptor, with the GABAB receptor predominating. Whole-cell recordings from cultured neuropil glial cells showed that about half of the population responded to GABA with a small outward current and about a third responded to GABA and to both GABAA and GABAB agonists with an increase in intracellular calcium. In this latter respect, the response in moth neuropil glial cells to GABA resembles activation of GABAB receptors seen in astrocytes (Kaila, Reference Kaila1994; Bernstein et al., Reference Bernstein, Lyons, Möller and Kettenmann1996, Leinekugel et al., Reference Leinekugel, Medina, Khalilov, Ben-Ari and Khazipov1997; Möhler et al., Reference Möhler, Benke and Fritschy2001; Bettler et al., Reference Bettler, Kaupmann, Mosbacher and Gassmann2004). The fact that only a subset of glial cells responded suggests greater population heterogeneity among the glial cells than previously detected.
Effect of blocking GABA receptors in vivo
Neuronal activity can affect glial morphology (Matsutani and Leon, Reference Matsutani and Leon1993; Jones and Greenough, Reference Jones and Greenough1996), proliferation and maturation (Stevens and Fields, Reference Stevens and Fields2000), and glial calcium signaling (Fellin and Carmignoto, Reference Fellin and Carmignoto2004; Hartl et al., Reference Hartl, Heil, Hirsekorn and Lohr2007; Heil et al., Reference Heil, Oland and Lohr2007; Rieger et al., Reference Rieger, Deitmer and Lohr2007; Agulhon et al., Reference Agulhon, Petravicz, McMullen, Sweger, Minton and Taves2008; Bernardinelli et al., Reference Bernardinelli, Salmon, Jones, Farmer, Stellwagen and Murai2011). In Manduca, there is strong evidence that ACh is released by ORN axons (Sanes and Hildebrand, Reference Sanes and Hildebrand1976; Sanes et al., Reference Sanes, Prescott and Hildebrand1977) and that the neuropil glial cells express ACh receptors. Using δ-tubocurarine, Heil et al. (Reference Heil, Oland and Lohr2007) blocked acetylcholine receptors in the developing moth AL and showed reduction in migration of neuropil glial cells. Migration of neuropil glial cells is known to be dependent on voltage-gated calcium channels (Lohr et al., Reference Lohr, Heil and Deitmer2005) and neuropil glial cells in situ and in vitro were shown to respond to carbachol with increased calcium, beginning at stage 6 (Heil et al., Reference Heil, Oland and Lohr2007). It is not known, however, whether the ACh-mediated effect on migration is an effect directly on glial cells, or one mediated indirectly via activation of receptors on ORN axon terminal branches that could modulate a signal from the ORN axons to the glial cells.
The results presented here, that GABA, too, can cause a rise in glial-cell calcium in some glial cells, predict that GABA could also affect glial migration or glial morphology as has been reported elsewhere (Matsutani and Yamamoto, Reference Matsutani and Yamamoto1997, Reference Matsutani and Yamamoto1998; Runquist and Alonso, Reference Runquist and Alonso2003). In the current experiments, picrotoxinin, a GABAA-type receptor antagonist, eliminated antennal nerve glial cell migration as well (Fig. 8C,D). Although picrotoxinin did not prevent migration of neuropil glial cells to surround glomeruli, the lower density of neuropil and SZ glial cells seen compared to controls (Fig. 8A,C) may indicate that fewer cells migrated. Whether this finding represents a confirmation of our in vitro results showing that only a subset of glial cells responded to GABA and GABA receptor agonists (Fig. 7C–E) or, alternatively that GABA normally modulates glial cell proliferation remains to be examined. We also noted that SZ glia migrated further distally compared to controls or picrotoxinin-treated animals. The fact that ORN axons began to sort at their normal proximity to the AL may indicate that the SZ glia originally migrated distally a normal distance, but resumed migration at a later time, possibly due to the absence of AN glia.
The GABAB-type receptor antagonist, CGP54626, caused near complete absence of antennal nerve glial-cell migration, as well as partial disruption of neuropil glial-cell migration to surround glomeruli (Fig. 8E,F), the latter confirming our conclusion that GABAB-type receptors predominate in neuropil glia (Fig. 2). Although the mechanisms of calcium increase associated with activation of the GABAA or GABAB-type receptors in neuropil glial cells (Fig. 7C–E) are not yet known, blocking glial calcium increases through voltage-gated channels is known to block neuropil glial migration in Manduca (Lohr et al., Reference Lohr, Heil and Deitmer2005; Heil et al., Reference Heil, Oland and Lohr2007), so blocking the activation of GABA receptors in the glial cells would be expected to have caused the effects we see.
Direct and glia-mediated effects of GABA on the morphology of AL neurons
GABA has been shown in other developing systems, vertebrate and invertebrate alike, to have many effects on neural development (Wang and Kriegstein, Reference Wang and Kriegstein2009), including the regulation of neurogenesis (Liu et al., Reference Liu, Wang, Haydar and Bordey2005; Platel et al., Reference Platel, Lacar and Bordey2007); induction and stabilization of neurite/dendritic outgrowth, growth cone dynamics and synaptogenesis (Matsutani and Yamamoto, Reference Matsutani and Yamamoto1998; Gascon et al., Reference Gascon, Dayer, Sauvain, Potter, Jenny and De Roo2006); and fine tuning of maturing neuronal circuits (Akerman and Cline, Reference Akerman and Cline2007). In general, these effects are mediated by GABAA receptors responding to non-synaptic, diffuse release of GABA (Liu et al., Reference Liu, Wang, Haydar and Bordey2005), including release at low levels from the axonal growth cones of developing mouse hypothalamic neurons (Gao and van den Pol, Reference Gao and van den Pol2000). During development, receptor activation in neurons typically leads to depolarization because the ratio of the two chloride transporters expressed in immature neurons favors the NKCC1 transporter, which leads to accumulation of Cl− intracellularly and thus a reversal potential for Cl− that is positive to the resting potential (Ben-Ari, Reference Ben-Ari2002; Owens and Kriegstein, Reference Owens and Kriegstein2002). The resulting depolarization mediates Ca2+ influx, at least locally, setting the stage for a variety of downstream effects (Ben-Ari et al., Reference Ben-Ari, Gaiarsa, Tyzio and Khazipov2007). The specific effect of GABA on developing neurons can be cell type and pathway specific (Wang and Kriegstein, Reference Wang and Kriegstein2009). Ca2+ influx through voltage-gated calcium channels has been shown in cerebellar granule cells, for example, to increase the complexity of neuronal arbors in vitro via the CaMKII and erk1/2 pathways (Borodinsky et al., Reference Borodinsky, O'Leary, Neale, Vicini, Coso and Fiszman2003) and to increase proliferation of cerebellar granule cell precursors (Dave and Bordey, Reference Dave and Bordey2009).
In the current study, we approached the question whether there are direct and indirect glia-mediated effects of GABA on neuronal outgrowth by moving to an in vitro assay. Although we found that the AL neuronal types that are GABAergic in vivo also are GABAergic in vitro, we do not know whether GABA is actually released from the GABA-positive AL neurons during the time they are in culture, or, if they do release it, at what point they might begin to do so and thus be an endogenous source of GABA in our experiments. In vitro, action potentials are absent during the first few days in culture, appearing sometime within the first week in culture (Hayashi and Hildebrand, Reference Hayashi and Hildebrand1990). Thus if endogenous, activity-dependent GABA release does occur, it likely would occur only late in the experimental period, and in any case, with similar cell density in all cultures, spontaneous release, whether from growth cones or from other non-synaptic release mechanisms (Koch and Magnusson, Reference Koch and Magnusson2009), is likely to constitute a roughly uniform background level of exposure under all conditions.
We found that outgrowth of AL local interneurons was directly affected by the presence of GABA at nanomolar concentrations. GABA induced an increase in branch length, number of branches and total arbor length. Glia alone had no effect. Although it is possible that the presence of a greater number of glial cells might have revealed an effect, the density of glial cells in these cultures was the highest we could achieve experimentally. The interesting effect in this series, however, is the antagonistic effect of GABA-exposed glial cells on the outgrowth of AL neurons. GABA-exposed glial cells reversed the direct effect of GABA on AL neuronal morphology to control levels. This is in contrast to the effect reported for neonatal rat olfactory bulb neurons in which astrocytes treated with muscimol supported an increase in dendritic branching (Matsutani and Yamamoto, Reference Matsutani and Yamamoto1998). The fact that we saw an effect of glia only when GABA was added is not likely to be simply an artifact of adding GABA exogenously. That an effect was detected at concentrations of GABA that are in a range (nM) expected if released from growing dendrites suggests that GABA could be affecting glial cells in vivo, and that the GABA-stimulated glial cells might then release a signal that affects neuronal morphology.
One possible mechanism for the GABA-plus-glia-mediated effect could be GABA uptake by the neuropil glial cells (Oland et al., Reference Oland, Gibson and Tolbert2010). We think this is unlikely. Immunocytochemistry results showed that only the complex glial cells strongly express the GABA transporter while the simple glial cells, which overwhelmingly dominate our cultures, express it at levels undetectable by this method. Although the simple glial cells were shown to take up GABA in vivo, they did so only when the GABA concentration was high (50 µM), not the nanomolar levels that were used in the current experiments and that are within the range of GABA concentrations found in the extracellular space (Saxena and Macdonald, Reference Saxena and Macdonald1994; Wallner et al., Reference Wallner, Hanchar and Olsen2003). The effect is more likely to be mediated by activation of the glial GABAA or GABAB receptors, probably the GABAB receptors. Clearly the next experiments in this series will be to test directly whether activation of the GABAA and/or GABAB receptors, or the GABA transporter, underlies the effect of GABA on neurons in the presence of glial cells.
Proposed model
We propose the following developmental scenario (Fig. 9). In vivo, GABA is released from the dendritic tips of growing AL neurons at early stages when the dendrites of local interneurons fill the neuropil to the surrounding glial border. In the very open neuropil present at early stages and in the absence of a significant GABA transporter presence among the glial cells (outgrowth of the processes of complex glial cells is still minimal), GABA would diffuse readily and could activate both glial and neuronal GABA receptors. Activation of neuronal GABA receptors would lead to increased neuronal outgrowth while activation of glial receptors would lead to release of a diffusible signal that locally antagonizes the direct effect of GABA on neurons. The net result would be to constrain dendritic outgrowth at the edges of the developing glomeruli, helping to sculpt the arbors into their characteristic densely branched tufted morphology. Limitation of neuronal outgrowth at the glial border is evident even in the chronically deafferented AL neuropil. In this condition, simple glial cells do not migrate or extend processes into the neuropil and the dendrites of AL neurons fail to form tufted arbors. They do, however, form highly branched arbors that extend to, but not into, the glial border that surrounds the neuropil (Oland and Tolbert, Reference Oland and Tolbert1987; Oland et al., Reference Oland, Orr and Tolbert1990), possibly limited by the same mechanism.
CONCLUSIONS
We conclude that GABA may provide signals in the developing AL of Manduca that regulate arborization of AL neuron dendrites and migration of neuropil, sorting zone and antennal nerve glial cells, in part underlying the cellular interactions that we have reported in our previous work. Our results demonstrate that GABA, previously studied for its role in processing olfactory information in the AL, also may have a role in shaping development of the olfactory pathway, via both direct effects on AL neurons and indirectly via effects on glial cells that in turn signal to the AL neurons. These results suggest that GABA signaling in this system is worthy of further investigation to determine specific cellular players and signaling pathways.
ACKNOWLEDGEMENTS
The authors wish to thank Pakika DeMenezes Ferrera, Carol Turner, Nicole Ingraham and Anna Burns, who each have served as manager of the Department Tissue Culture Facility during some part of this study, for their work in preparing dishes and solutions, in training technicians in culture techniques and in maintaining a high-quality culture facility. We also are very grateful to Patricia Jansma, manager of the Department Imaging Facility, for her advice and guidance on our imaging experiments, and to Mark Higgins and Wendy Pott who helped with the initial immunocytochemistry experiments to examine the pattern of GABA labeling in culture. We thank the Manduca sexta Genome Sequencing Consortium for making their data publicly available, and the BCM-HGSC for providing Manduca genome scaffold and CUFFLINK assembly data. We also thank Dr. Aaron Howard of Georgetown University for providing advice on our statistical analysis. Finally, our thanks to Debbie Sakiestewa, Osman Abdelwahab, Suzanne Mackzum and Margaret Marez, for supplying us with robust animals for our studies. This work was supported by NIH NINDS NS28495 (project 2 to LAO) and NIDCD DC008597 to LAO and AJN. All work on this manuscript was completed while authors were members of the UA Department of Neuroscience.
Statement of interest
None.