Introduction
Critical care transport (CCT) teams are highly trained Emergency Medical Services (EMS) professionals who provide invasive monitoring, advanced ventilator support, airway management, and other intensive care procedures as they transport patients by air or ground. Even with highly-trained teams, transporting patients, both intra- and inter-hospital, has been shown to be associated with increased risk of adverse events.Reference Wilcox, Saia, Waden, McGahn, Frakes, Wedel and Richards 1 - Reference Flabouris, Runciman and Levings 5 Critically ill patients especially are prone to adverse events in transport, including desaturation and hypotension,Reference Flabouris, Runciman and Levings 5 - Reference Waydhas, Schneck and Duswald 7 and even the most well-equipped transport vehicles do not offer the same resources as a small hospital, given lack of space, lack of support personnel, and lack of other resources. Therefore, unless a patient is suffering a time-critical diagnosis, such as a ST segment elevation myocardial infarction, or needs acute trauma care, taking the time to optimize a patient prior to transport may be an appropriate approach. The goal of the CCT team on arrival to the sending facility is to stabilize the patient for transport to reduce the risks of an untoward event en route. This usually requires obtaining a focused history, performing an exam, augmenting hemodynamics with fluids and vasoactive medications as indicated, and optimizing oxygenation and ventilation. The CCT team may spend a considerable amount of time at the sending institution preparing the patient for transport.Reference Marx, Vangerow and Hecker 8 - Reference Youngquist, McIntosh, Swanson and Barton 10
While there is substantial literature for on-scene times (OSTs) for scene calls, few studies have addressed the OSTs for inter-facility transfers. Given the constraints and limitations of transport by rotor and fixed wing, CCT teams have additional considerations when preparing to transport patients by air. Appreciating the time required to package a patient and depart on a CCT is valuable for the sending and the receiving hospitals, as well as for transport services, to allocate resources appropriately.
The authors previously developed a database of patients transported by this CCT service with hypoxemic respiratory failure and demonstrated that oxygenation improved after transport.Reference Corfield, Adams, Nicholls and Hearns 11 This is a secondary analysis of that database to compare the total OSTs among patients with hypoxemic respiratory failure who underwent inter-facility transfer by ground, rotor wing, and fixed wing. Additionally, the correlation between OST for patients transferred from the emergency department (ED) and the intensive care units (ICU) at the sending facilities was examined.
Methods
Study Design
This CCT service, operated through a consortium of six academic medical centers, performs approximately 3,000 transports annually, throughout the New England area, including both rural areas of Northern Maine (USA), Vermont (USA), and New Hampshire (USA), as well as the urban Boston (Massachusetts USA) metropolitan area. The fleet is comprised of five critical-care ground transport vehicles, three rotor-wing aircraft, and one twin-engine fixed wing vehicle, and approximately 56% of transports are via rotor-wing, 40% via ground, and four percent via fixed wing. Transport teams are comprised of a critical care nurse and paramedic, as well as an emergency medical technician (EMT) for ground transports or a pilot for air transports. All nurses on transports are also EMTs, and both nurses and paramedics must have at least five years of prior experience.
To identify patients for this database, the CCT service electronic medical record system was searched to identify intubated, adult patients with a primary clinical classification, as indicated by the original transport team, of “medical” or “respiratory,” excluding transports with a primary clinical classification of neurological, trauma, burn, surgical, or cardiac. From that initial screening, 2,251 records were filtered by the primary and secondary ICD-9 codes to identify patients with pulmonary or septic diagnoses. Transport records were searched electronically by three of the co-authors for the terms “ARDS,” “hypoxia,” or “hypoxemia,” and the charts of patients receiving at least a fraction of inspired oxygen of 50% were selected for inclusion. The transport records were reviewed for demographic data, pertinent comorbidities, and transport data.
On-scene time was defined as the time from arrival at the patient’s bedside to the departure from the bedside with the patient. Given the established risks of deterioration with movement and intra-hospital transport,Reference Wilcox, Saia and Waden 12 all time after leaving the bedside was considered “transport.” “Total transport time” was defined as time from the leaving bedside to arrival at the receiving facility, and the “en route time” was defined as the time within the transport vehicle. For air transports, that included ground legs; the en route time only included the time in the aircraft. Google Maps (Google Inc.; Mountain View, California USA) was used to calculate the miles for the transport, as well as the shortest estimated driving time without traffic. For trips from surrounding island communities, driving times were not calculated.
This study was approved by the Institutional Review Boards of the three receiving institutions.
Statistical Analyses
Study data were exported into a Microsoft Excel (Microsoft Corp.; Redmond, Washington USA) and then transferred into JMP Pro version 11.0 (SAS Institute Inc.; Cary, North Carolina USA). Means and standard deviations for transport times were calculated and distributions for the transport times were inspected visually using histograms. Subsequently, OST, total transport time, and time en route were compared based on the modality of transport (ground, fixed wing, or rotor wing) and the origin of transport (ICU versus ED) using two-tailed student’s T tests with unequal variances. Patients for whom transport times or OSTs were not recorded were excluded from analysis. Correlations between OST, total transport time, and time en route and travel distance were assessed via Pearson’s correlation for the entire cohort and for sub-groups based on mode of transport. A P value of less than .05 was considered statistically significant.
Results
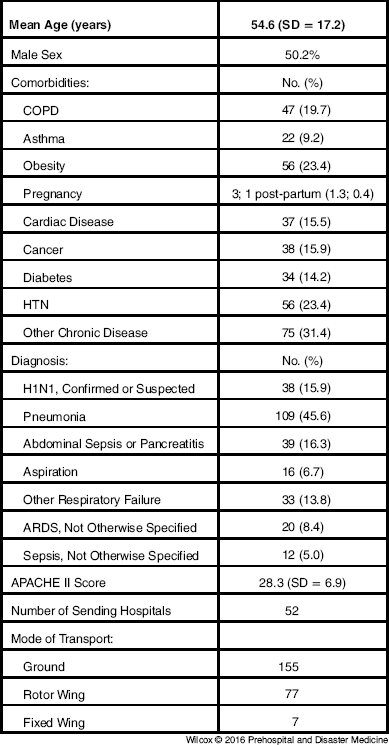
Two hundred and thirty-nine charts were identified for review. Patients were transferred from 52 sending hospitals to three tertiary care centers. Patients were 50.2% male, and the median age was 55 years. The patients were a high acuity cohort with a mean APACHE II score of 28.3 (SD=6.9). Patient demographics are outlined in Table 1.
Demographics

Abbreviations: ARDS, acute respiratory distress syndrome; COPD, chronic obstructive pulmonary disease; HTN, hypertension.
A total of 77 patients were transported by rotor wing, 155 by ground, and seven by fixed wing. Not all patients had all transport times recorded. While seven patients were transported by fixed wing, OST and total transport time was only recorded for six patients. For patients transported by ground, two did not have OST recorded and three did not have total transport time recorded. All 77 patients transported by rotor wing had OST recorded, but one did not have total transport time recorded. One patient from the ED and one patient from the ICU did not have OST documented.
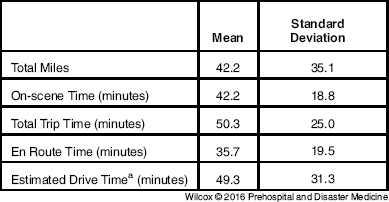
The mean OST was 42.2 minutes, with a standard deviation of 18.8 minutes (Table 2). The shortest time at the sending facility was eight minutes, while the longest was 98 minutes, and 31 patients (13%) had OST of over an hour. The mean transport time was 35.7 (SD=19.5) minutes. The OST was greater than the en route time for 147 patients, and greater than the total trip time for 91. The mean miles for transport were 42.2 (SD=35.1) with a range of 3.4 miles to 363 miles.
Mean On-scene Times, Total Transport Times, and En Route Times

a Excludes trips from island hospitals.
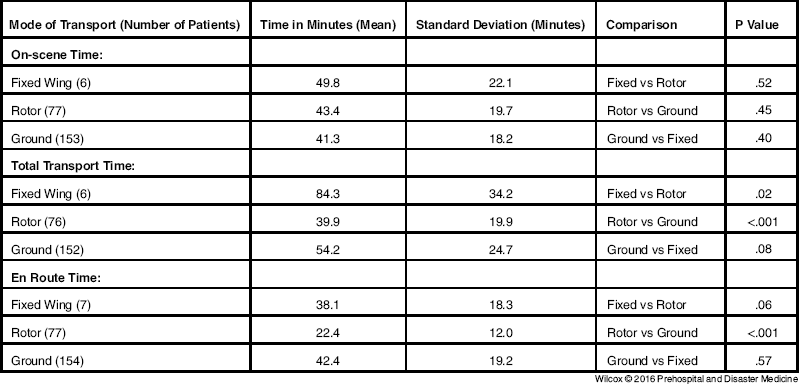
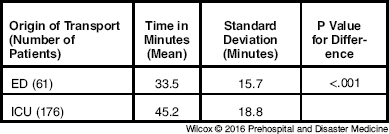
When stratified by the mode of transport, there were no differences in the OST (Table 3). However, the total transport time was significantly shorter for rotor versus ground (39.9 [SD=19.9] minutes vs 54.2 [SD=24.7] minutes; P <.001) as well as for rotor versus fixed wing (84.3 [SD=34.2] minutes; P =.02). The time en route was also significantly shorter for rotor wing versus ground (22.4 [SD=12.0] minutes; P=<.001). The OST for patients in the ED was significantly shorter than those transported out of an ICU, at 33.5 (SD=15.7) minutes vs 45.2 (SD=18.8) minutes; P <.001 (Table 4).
On-scene Time, Total Transport Time, En Route Time, Stratified by Mode of Transportation

Comparison On-scene Times from Patients Transported from an ED versus an ICU

Abbreviations: ED, emergency department; ICU, intensive care unit.
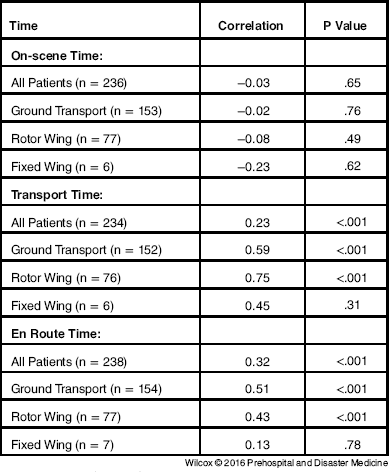
For all patients, regardless of mode of transportation, there was no correlation between the OST and the total miles travelled in transport; although, there was a significant correlation between the time en route and distance, as well as the total trip time and distance. These significant correlations remained for the subgroups of patients transported by ground and by rotor wing, but not for patients transported by fixed wing (Table 5).
Correlations between Travel Times and Travel Distances

Discussion
In this cohort of critically ill patients with respiratory failure undergoing inter-facility transport, the OST was considerable, with a mean of over 40 minutes, and with many patients requiring an OST of over an hour. The OST was often greater than both the time en route as well as the total trip time. In contrast to scene trauma, ST elevation myocardial infarctions, or stroke calls, where rapid transit has been shown to reduce morbidity and mortality, preparing a patient for medical CCT, especially with hypoxemic ventilated patients, is likely beneficial as critically ill patients tend to become unstable during transport.Reference Beckmann, Gillies, Berenholtz, Wu and Pronovost 13 Appreciation of mean total trip time is valuable as this represents a vulnerable time for the critically ill patient as this is time away from inpatient resources. However, the time en route is an even more perilous period as care during this time largely is dependent only on the limited number of crew members and materials available in the vehicle, especially with air transport.Reference Singh, MacDonald, Bronskill and Schull 14 , Reference Whiteley, Macartney, Mark, Barratt and Binks 15
The OSTs in this report are similar to those reported in the few prior studies of OSTs for inter-facility transport.Reference Youngquist, McIntosh, Swanson and Barton 10 , Reference Wallace and Ridley 16 , Reference Ringburg, Spanjersberg, Frankema, Steyerberg, Patka and Schipper 17 In a study from South Africa, van Hoving et al found the median OST was 60 minutes (IQR=40 to 90 minutes), and similar to these findings, the median time for transport was lower than the OST at only 49 minutes.Reference Ringburg, Spanjersberg, Frankema, Steyerberg, Patka and Schipper 17 However, in prior studies, the OST correlated with the mode of transport. In van Hoving’s study, there was a significant difference in mean OST for inter-facility transfers between patients transported by an air transport group with a mean of 58.7 minutes (95% CI, 56.4-61.1) compared to 31.9 minutes (95% CI, 31.2-32.6) for the ground group. Another study found that the inter-facility mean OST was 24.6 minutes for the EMS group and 35.4 minutes for the EMS/helicopter EMS (HEMS) group (P <.001) After adjusting for confounding variables in that study, HEMS assistance was still associated with a 9.3-minutes longer OST.Reference Wallace and Ridley 16 The findings in this study differ as there was no correlation between OST and the mode of transport.
In this cohort, there was similarly no correlation between the length of the transport in miles and the OST. There was a correlation between being transferred out of an ED and a shorter OST, as compared to transports from the ICU. On-scene times may have been shorter in the ED than in the ICU due to patient complexity as ICU patients may be receiving more complicated interventions and support than patients in the ED.
In aggregate, these findings suggest that the key factors in determining the OST for inter-facility transport may be related to patient complexity and health care system factors rather than the mode of transport or the distance to be traveled. A study of inter-facility transport published in 2011 found a correlation between the critical care interventions delivered to a patient and the OST.Reference Youngquist, McIntosh, Swanson and Barton 10 The CCT team may require more time at the scene of the sending institution preparing the patient for transport than a ground EMS team.Reference Marx, Vangerow and Hecker 8 - Reference Youngquist, McIntosh, Swanson and Barton 10
Many of the rotor wing and fixed wing transports required long ground legs as the aircraft must land at an airport or helipad remote from both the sending and receiving facilities.Reference Whiteley, Macartney, Mark, Barratt and Binks 15 , Reference Van Hoving, Smith and Wallis 18 As seen in other studies, in this study, despite the potentially increased total time until arrival at the receiving facility, the helicopter offers the advantage of decreasing the time the patient spends in transit.Reference Karanicolas, Bhatia and Williamson 19 This may be of particular benefit for unstable patients, for whom the time in the out-of-hospital setting should be minimized.
Based on these data, both the sending and receiving facilities should be aware that the time to stabilize the patient prior to departure may be substantial, and the CCT team may require more time at the bedside of the sending facility than for transit. Additionally, appreciating the time intervals required for complex transports can assist in improving efficiency in staffing and resource allocation for CCT services.
Limitations
This study had several limitations, many related to the nature of a retrospective review. Although most data points for transport times were available, the durations of portions of transports were missing for a few patients. The patients included in this cohort were patients transported with hypoxemic respiratory failure, and therefore do not represent the whole patient population for CCT. Additionally, the transport times were from an urban area in the Northeastern United States, and these may not represent transports in other locales.
Conclusion
In this cohort of critically ill patients with hypoxemic respiratory failure, the OST was over 40 minutes and was often longer than the total trip time. The OST did not correlate with the mode of transport or the distance traveled. Although the total trip time was often longer for rotor wing transports, the time en route was significantly shorter. These data can assist in planning inter-facility transports for both the sending and receiving hospitals, as well as CCT services.