I. Introduction
Cooperatives have existed since the 18th century and have considerable economic importance to date (Alessandrini and Messori, Reference Alessandrini and Messori2016). However, compared to other organizational forms (such as owner-managed firms and firms run by “managing directors”), they are considered less efficient in terms of product quality and reputation (e.g., Frick Reference Frick2004; Schamel, Reference Schamel2015; Cadot, Reference Cadot2015). Irrespective of their economic importance, very little is known about the characteristics distinguishing successful from poorly performing cooperatives. Therefore, the purpose of this study is to identify the determinants of cooperatives’ organizational reputation and successful performance in a competitive market.
In addition to the problems resulting from poorly specified and diluted property rights, two behavioral traits of utility-maximizing individuals have been identified as the major source of the low efficiency of cooperatives: adverse selection and moral hazard. The former is the result of ex ante information asymmetries (Holmstrøm and Tirole, Reference Holmstrøm, Tirole, Schmalensee and Willig1989), which suggests that producers of low-quality grapes are more likely to join a cooperative as they expect higher returns from their membership. Moral hazard, in turn, implies post-contractual opportunism, which is to be expected if the agents’ actions cannot be observed by the principal at zero cost (Milgrom and Roberts, Reference Milgrom and Roberts1992). Especially in large cooperatives (i.e., those with many members), agents have incentives to perform at suboptimal levels since it is difficult to monitor the behavior of each individual. Therefore, utility-maximizing members of a cooperative will be tempted to deliver poor-quality grapes. Both pre- and post-contractual opportunism can considerably harm the performance of a cooperative.
Despite these organizational problems, cooperatives have secured large market shares, especially in agriculture (Schamel, Reference Schamel2014). In this article, we focus on the wine sector, which, on the one hand, is subject to particularly fierce competition (Couderc and Marchini, Reference Couderc and Marchini2011) and where, on the other hand, the market share of cooperatives varies considerably among countries. In Germany, where the first wine cooperative was founded in the Ahr region in 1868, the number of cooperative wineries and the number of members decreased for decades (DRV, 2016). Nevertheless, cooperatives represent 30% of total wine production. That percentage is particularly high at 75% in Baden, Württemberg, and Franconia (Hanf and Schweickert, Reference Hanf and Schweickert2014). Although the overall figures are decreasing, the number of cooperatives is increasing in some regions where they failed to play an important role in the past (this development has been attributed to the bargaining power of cooperatives, e.g., Hanf and Schweickert, Reference Hanf and Schweickert2007). In Austria and Italy, the situation is completely different. In the former country, cooperatives have a market share of only 15% while in the latter they account for 70% of total wine production (many Italian wine producers cultivate rather small vineyards; Couderc and Marchini, Reference Couderc and Marchini2011).
To generate high levels of organizational reputation and to successfully compete in the wine market, cooperatives must look for a competitive advantage. Gentzoglanis (Reference Gentzoglanis, Nilsson and van Dijk1997), for example, argues that strategic alliances and downsizing may be (potentially) useful strategies in this respect. Yet, from an empirical point of view, it is still not clear what organizational characteristics are successful in a cooperative. Although many studies investigate the success of cooperatives and non-cooperatives comparatively (y = f (COOP, X)), they ignore substantial heterogeneity among cooperatives. To the best of our knowledge, no study has, so far, provided empirical evidence on the differences in performance among cooperatives or identified the factors contributing to their economic success (e.g., acreage, membership). This study contributes to the debate on how wine cooperatives can mitigate the obvious problems (i.e., moral hazard and adverse selection) associated with their specific organizational form by comparing their performance in three different, but culturally very similar countries.
The main measure of performance is whether a cooperative is listed in the most recent editions, 2016–2017, of at least one of two leading wine guides (Gault Millau and Falstaff). Our dataset includes 136 cooperatives in Austria, Germany, and northern Italy. For each cooperative, we have information on the size of its membership, the acreage, and the founding year. These characteristics are merged with the respective organization's appraisal in either Gault Millau and/or Falstaff. In the estimation, the impact of the different attributes on the probability of a winery being listed in these guides is analyzed using a logistic regression approach.
The remainder of this paper is structured as follows. Section II reviews the literature on the performance of cooperatives as well as their advantages and drawbacks. In Section III, we derive a series of hypotheses based on the current state of research. Section IV explains the data, some descriptive results, and the methodology. Section V presents the empirical findings. Section VI discusses the results, followed by concluding remarks in Section VII.
II. The Economic Performance of Cooperatives: Theoretical Considerations and Previous Empirical Evidence
In two seminal publications, Hansmann (Reference Hansmann1988, Reference Hansmann1996) distinguishes five different organizational structures: investor-owned firms, customer-owned firms, worker-owned firms, cooperatives as well as mutual, and nonprofit enterprises. In market economies, profit-maximizing firms, owned by investors (“capitalist”) are clearly the dominant form (Novkovic, Reference Novkovic2008). The main difference between these five types emerges from the allocation of ownership rights. In capitalist firms, the owner has the right to control the firm, and at the same time, is the residual claimant, while the control rights are jointly exercised in the firms owned by the customers and workers. Moreover, in cooperatives as well as nonprofit organizations, no residual claimant exists (Ben-Ner, Reference Ben-Ner, Steinberg and Powell1987).
Cooperatives are hybrid institutions that are both centralized (production machines, marketing, etc.) and decentralized (members remain independent entrepreneurs trying to maximize their income; Bonus, Reference Bonus1986; Ménard, Reference Ménard2004). They typically consist of rather heterogeneous members who come together to form an organization for a business purpose by pooling their resources (Karantininis and Zago, Reference Karantininis and Zago2001; Cazzuffi and Moradi, Reference Cazzuffi and Moradi2012). Apart from that, however, cooperatives are democratic in the sense that they use the one-person, one-vote principle because their members share similar economic interests (Hart Reference Hart1996; Schenk Reference Schenk2007).
There are five types of cooperatives that primarily differ in the way in which the exchange relationships are built and maintained: consumer, worker, purchasing, producer, and hybrid cooperatives. Consumer cooperatives are operated by customers, such as retail stores and electricity companies (Mikami, Reference Mikami2003). They often emerge in remote areas where citizens jointly develop such enterprises to offer basic infrastructure services. Although all its members own such a cooperative, they are not obliged to work for that organization. The members of a worker-owned cooperative contribute significantly to the development and success of their organization (Maietta and Sena, Reference Maietta and Sena2008). Hence, resources and revenues are shared equally among employees (Burdín, Reference Burdín2014), which is why worker cooperatives are so rare (e.g., due to a lack of incentives; Kremer, Reference Kremer1997). In a purchasing cooperative, several organizations join forces to exercise market power in procurement and to share resources and information (Schotanus and Telgen, Reference Schotanus and Telgen2007). The fourth type, a producer cooperative, is owned by producers providing all the relevant production factors to the organization, be it raw materials, intermediate products, or human capital (Hansmann, Reference Hansmann1999). The cooperative buys each commodity from its members at a predefined—usually rather low—price in order to maximize profits, which are then equally shared among all members. Moreover, producer cooperatives hire workers like conventional organizations (Maietta and Sena, Reference Maietta and Sena2008). Special cases of producer cooperatives are agricultural cooperatives, like cooperative wineries, in which farmers pool their resources and often share assets like a harvester or a grape press (Agbo, Rousselière, and Salanie, Reference Agbo, Rousselière and Salanié2015). The last form, the hybrid cooperative, is a combination of more than one of the cooperative types mentioned previously.
Cooperatives are not only widespread but also economically relevant actors in many industries (Monteiro and Stewart, Reference Monteiro and Stewart2015). Currently, there are more than 2.6 million cooperatives worldwide, generating an annual turnover of 2.2 trillion USD and employing about 12% of the world's total working population (The International Co-operative Alliance, 2017). In a recent survey of 2,370 cooperatives in 63 countries, the International Co-operative Alliance (2016) found that 26% of all cooperatives operate in agriculture, 22% in the insurance industry, 16% in the banking and financial sector, and 14% in wholesale and retail trade.
A. Advantages and Disadvantages of Cooperatives
Due to its structure and democratic form of governance, a cooperative can—under certain conditions—be a superior form of organization (Nilsson, Reference Nilsson2001). The first and most important advantage is that, due to its size, a cooperative can realize economies of scale (Cazzuffi and Moradi, Reference Cazzuffi and Moradi2012). Since the beginning of the industrial age, capital-intensive technology became more and more important in manufacturing, as well as in agriculture (services did not play an important role by then). The majority of farmers were not able to afford any expensive technical equipment. With the emergence of the cooperative movement, the situation of many small farmers and small enterprises changed drastically (Parliament, Lerman, and Fulton, Reference Parliament, Lerman and Fulton1990). The members of the cooperatives can pool their resources, which allows the cooperative to offer access to otherwise unavailable technology, as well as information and consulting services (Cazzuffi and Moradi, Reference Cazzuffi and Moradi2012). The shared resources can be of any kind, such as technical equipment or buildings, reputation, or bargaining power. Furthermore, the services offered by the cooperative are typically cheaper than the those offered by profit-maximizing firms (e.g., regular maintenance of machines that are only used during harvest time). Particularly important types of resources are marketing activities and the ensuing increase in the organization's reputation surplus (Gentzoglanis, Reference Gentzoglanis, Nilsson and van Dijk1997). Small independent farmers would neither be willing nor able to invest in reputation. Especially in the wine sector, cooperatives often invest heavily in marketing activities that increase their reputation and, consequently, their revenues. Therefore, a cooperative can significantly reduce the average costs of small farmers and wine growers who would otherwise be incapable of realizing any economies of scale (Valentinow, Reference Valentinow2007).
The second advantage of cooperatives is that they can significantly reduce their individual members’ transaction costs (Bonus, Reference Bonus1986; Staatz, Reference Staatz1987), allowing more efficient bargaining when purchasing and selling commodities or services (Bonin, Jones, and Putterman, Reference Bonin, Jones and Putterman1993; Karantininis and Zago, Reference Karantininis and Zago2001). Since cooperatives often purchase large quantities of raw materials or intermediate products, they are in a better bargaining position than individuals and, in turn, can often negotiate considerable quantity discounts. Especially the purchasing cooperatives benefit from this circumstance, since they bundle resources. As a result, retailers' cooperatives, like EDEKA or REWE Group in Germany, can increase profit margins or lower sales prices. In either case, the result is a superior economic performance. Gentzoglanis (Reference Gentzoglanis, Nilsson and van Dijk1997), for example, finds that cooperatives can sell their products at higher prices, yielding higher margins because cooperatives face lower transaction costs. Moreover, Cakir and Balagtas (Reference Cakir and Balagtas2012) show for agricultural cooperatives that they are typically able to increase the price of milk above marginal cost.
The third major advantage is that membership in a cooperative helps the vineyard owners to avoid hold-up situations that arise when downstream firms—here profit-maximizing wineries buying the grapes—exercise market power (Albanese, Navarra, and Tortia, Reference Albanese, Navarra and Tortia2015). As members of a cooperative, individual grape growers can be assured that they will be paid the ex ante agreed price.
However, from an economic point of view, cooperatives are likely to suffer from specific disadvantages of their idiosyncratic, organizational form that are mainly due to voluntary membership and decentralized decision making. The likely consequences of these idiosyncrasies have extensively been discussed in a property rights as well as an agency framework (e.g., Alchian and Demsetz, Reference Alchian and Demsetz1972; Jensen and Meckling, Reference Jensen and Meckling1979; Vitaliano, Reference Vitaliano1983; Porter and Scully, Reference Porter and Scully1987; Fulton, Reference Fulton1995; Nilsson, Reference Nilsson2001; Borgen, Reference Borgen2004). Cook (Reference Cook1995) distinguishes five different problems: free riding, horizon, portfolio, control, and problems of influence costs. The free rider problem, the horizon problem, and the portfolio problem are typically discussed from a property rights perspective, while the control as well as the influence cost problem are usually considered from an agency perspective.
The first problem, the common property or free riding problem, arises because property rights are not specified and cannot be traded (Cook, Reference Cook1995). Especially new members often behave opportunistically and free ride on the investments made by senior members who have collectively acquired expensive technology (Bogetoft, Reference Bogetoft2005). Generally, the greater the number of members of the cooperative, the more free riding is to be expected (Winfree and McCluskey, Reference Winfree and McCluskey2005). Quality problems may be related to the control of quantity, implying that free riding on quantity reduces free riding on quality (Pennerstorfer and Weiss, Reference Pennerstorfer and Weiss2012).
This problem of free rider coincides with the time horizon problem. If a member invests in the assets of a cooperative, these might be available for a period exceeding that individual's membership (Porter and Scully, Reference Porter and Scully1987). As a result, new members benefit from these assets without having contributed to their acquisition (Furubotn, Reference Furubotn1976). Consequently, individual producers can easily exploit the organization by investing too little and not generating any surplus (Hart, Reference Hart1996). Given that the individuals’ time horizons very often differ considerably, members have different risk/reward profiles and, therefore, favor different strategies. Although members typically prefer low-risk decisions, their discount rates are likely to be different, leading to the emergence of a portfolio problem.
The problems of property rights discussed so far are further aggravated by two different, but closely related, agency problems. One is the control problem, which, according to Cook (Reference Cook1995), includes the monitoring and the follow-up problem. Like any other corporation, the interests of managers and owners do not match. This standard principal-agent problem is, however, of a particular form in a cooperative. On the one hand, it is not clear who is the agent and who is the principal, because both the managers of the cooperative and the individual members can be principals and agents (Hanf and Schweickert, Reference Hanf and Schweickert2007). On the other hand, the individual members’ shares cannot be traded at a stock exchange (Porter and Scully, Reference Porter and Scully1987), which would yield an external evaluation of management practices through a change in the share price. Moreover, the follow-up problem arises because individual members decide independently on quality and quantity and rely on the performance of others, while at the same time they are restricted in their ability to influence collective decision making (Phillips, Reference Phillips1953; Nilsson, Reference Nilsson2001). As an example, low-quality producers can deliver poor quality products without being sanctioned. This type of moral hazard plagues many cooperatives and is the consequence of missing monetary incentives on the one hand and monitoring problems on the other. Hence, a number of studies convincingly demonstrate that cooperatives struggle with quality problems and suffer from a low reputation (Pennerstorfer and Weiss, Reference Pennerstorfer and Weiss2012; Hanf and Schweickert, Reference Hanf and Schweickert2014; Schamel, Reference Schamel2014). Furthermore, due to the horizon problem discussed earlier, conflicts of interest are likely to occur, and high-quality producers have an incentive either to leave or not to join. This, in turn, leads to self-selection of poor-quality producers to join cooperatives and may result in a vicious circle that is particularly harmful in large and complex cooperatives (Staatz, Reference Staatz1987). The last problem, the influence cost problem, is closely linked to the follow-up and the decision problem. Since cooperatives are rather heterogeneous in their members acting as individual profit-maximizers (Fulton and Giannakas, Reference Fulton and Giannakas2001), management has typically a hard time deciding how to weight the individual members’ opinions adequately (Richards, Klein, and Walburger, Reference Richards, Klein and Walburger1998). Once again, this negatively affects the quality of the decision-making process.
To summarize, incentive problems are the result of poorly specified property rights, as well as poor management. Some members actively manipulate decisions, forcing the organization to expand its activities into new business areas (Katz and Boland, Reference Katz and Boland2002), which, in turn, is often detrimental to the core competencies of cooperatives. In addition, because high-quality producers are often not appropriately rewarded, quality deficits occur which, consequently, lead to adverse selection and moral hazard (Albæk and Schultz, Reference Albæk and Schultz1998). Therefore, cooperatives must invest in the identification and development of characteristics that promote superior performance.
B. Success Factors of Cooperatives
According to most empirical studies available, cooperatives are less efficient than their private counterparts, mainly due to the organizational idiosyncrasies and the ensuing problems discussed earlier. Porter and Scully (Reference Porter and Scully1987) used data from U.S. milk-processing firms and found that cooperatives are only three-quarters as efficient as for-profit firms. Moreover, a number of studies referring to the wine sector find that cooperatives perform worse than other organizational forms. Using a sample of some 300 German wineries during the period from 1996 to 1999, Frick (Reference Frick2004) shows that cooperatives charge 14 to 20% lower prices than observationally similar family firms. Schamel (Reference Schamel2015) estimates a hedonic price model for German private and cooperative wineries, identifying a “reputation discount” of cooperatives of 10% and argues that the results are to be attributed to the fact that most cooperatives sell their wines to discount stores and large supermarket chains. Pennerstorfer and Weiss (Reference Pennerstorfer and Weiss2012) analyze the impact of decentralized decision making on product quality. In a sample that includes 9,914 different Austrian wines, they find that cooperatives’ wines are of significantly lower quality due to the cooperatives’ unresolved coordination and free rider problems.
However, a small number of studies has shown that, under certain conditions and in specific regions, cooperatives perform significantly better than other organizational forms (Gentzoglanis, Reference Gentzoglanis, Nilsson and van Dijk1997). The findings presented here have been interpreted as evidence that property rights and principal agent theory fail to consider all relevant aspects that may have contributed to a company's performance (Nilsson Reference Nilsson2001). Several studies comparing the performance of cooperatives with that of other organizational forms in agriculture find that the former perform better (Parliament, Lerman, and Fulton, Reference Parliament, Lerman and Fulton1990), are more cost-effective (Singh, Coelli, and Fleming, Reference Singh, Coelli and Fleming2001), and improve their members’ bargaining position (Cakir and Balagtas, Reference Cakir and Balagtas2012). For worker cooperatives, Burdín (Reference Burdín2014) finds that they provide greater employment stability, are better equipped to cope with recessionary periods, and survive longer. Katz and Boland (Reference Katz and Boland2002) find that innovative cooperatives (those whose shares can be traded and which restrict the access of new members) are likely to be more successful. Schamel (Reference Schamel2014) finds that, compared to family businesses, cooperatives in northern Italy can charge significantly higher prices—a finding that he attributes to the presence of a “reputation premium.” Moreover, Barros and Santos (Reference Barros and Santos2007) find that in Portugal, wine cooperatives are more efficient than other organizational forms, and Valette, Amadieu, and Sentis (Reference Valette, Amadieu and Sentis2018) suggest that cooperatives in France have a higher survival rate. Summarizing these studies, it appears that country-specific effects seem to be important.
Few studies focus on the attributes of cooperatives that can contribute to their performance. Karami and Rezaei-Moghaddam (Reference Karami and Rezaei-Moghaddam2005) use data on the self-assessed performance of agricultural cooperatives in Iran and develop a subjective “total performance index” that they use as the dependent variable in their estimations. Using survey data from 52 managers and 260 members of 52 cooperatives, they find that the performance of a cooperative decreases as the number of paid employees relative to the number of members increases, with more office space, the amount of loan provided to the cooperative, the value of the machinery, and the initial capital available to the cooperative. Interestingly, the amount of land cultivated (acreage), the number of members, and the age of the cooperative were all found to have no statistically significant effect. Other studies, however, reveal that these latter characteristics do have a statistically significant effect on the performance of cooperatives. Cazzuffi and Moradi (Reference Cazzuffi and Moradi2012) show that membership has a significantly positive influence on cooperative survival in the cocoa business in Ghana, while Monteiro and Stewart (Reference Monteiro and Stewart2015) find that larger (in terms of number of members) and older cooperatives survive longer than investor-owned firms in the Portuguese wine industry. Nevertheless, to the best of our knowledge, no study analyzes the effects of cooperative wineries’ attributes on product quality, profitability, and/or wine guide recognition. For wineries—whether family owned, managed by experts or cooperatives—wine guide ratings are considered a valid performance measure as they can easily be compared across firms and over time.
III. Hypotheses
This study contributes to the body of literature on the (potential) impact of the attributes of cooperatives on their performance in the wine industry. Based on the previous literature, as well as our understanding of property rights and principal agent theory, three attributes are supposed to influence a cooperative's performance: the size of an organization's membership, the acreage of the cultivated vineyards, and the age of the organization.
Both Cazzuffi and Moradi (Reference Cazzuffi and Moradi2012) and Monteiro and Stewart (Reference Monteiro and Stewart2015) demonstrate that the number of members is positively associated with the probability of survival of a cooperative. On the contrary, Karami and Rezaei-Moghaddam (Reference Karami and Rezaei-Moghaddam2005) find a negative, yet, statistically insignificant effect of the number of members in the survival of the cooperatives. These two results are not necessarily incompatible because the latter study not only controls for membership size, but also for the amount of capital available to a cooperative. Since membership and budget are positively correlated, the coefficient estimated for membership is likely to be downward biased. From a theoretical point of view, organizational problems are expected to increase (and negatively affect the performance of an organization) as organizations grow in size. Especially, free riding and control problems become more important in large cooperatives: the costs of monitoring activity of each member, free riding of individual members due to moral hazard, and the probability of adverse selection increase. For instance, individual grape growers can increase their profits by selling lower quality grapes to the cooperative, while selling better quality grapes to privately owned enterprises that are willing to pay a higher price than the one offered by the cooperative. Such behavior is more likely to occur in large organizations whose members assume not to be monitored by their peers and where they expect not to be sanctioned in case their deviant behavior is detected. In smaller cooperatives, on the other hand, personal relations between the individual members are likely to be stronger and, hence, members are less likely to shirk. Moreover, larger cooperatives are less likely to carefully screen the applications of growers wishing to join the organization and to monitor the performance of new members. Therefore, adverse selection is a more severe problem in larger cooperatives. This leads to the first hypothesis:
Hypothesis 1
The larger a cooperative's membership, the poorer its performance.
So far, no study has identified a statistically significant influence on the size of the cultivated land, that is, a cooperative's acreage, on its performance. Karami and Rezaei-Moghaddam (Reference Karami and Rezaei-Moghaddam2005) find a positive, yet statistically insignificant effect. We assume that larger cooperatives (in terms of acreage) are likely to adopt more advanced management methods and instruments as they expect increasing returns to scale from the respective investments. Recent literature on the impact of firm characteristics on the adoption of management techniques convincingly shows that the probability of adopting performance-enhancing practices increases with the size of an organization (Bloom and Van Reenen, Reference Bloom and Van Reenen2007, Reference Bloom and Van Reenen2010; Bloom et al., Reference Bloom, Genakos, Sadun and Van Reenen2012; Bloom, Sadun, and Van Reenen, Reference Bloom, Sadun and Van Reenen2012; Bloom et al., Reference Bloom, Eifert, Mahajan, McKenzie and Roberts2013; Bloom et al., Reference Bloom, Lemos, Van Reenen, Sadun and Scur2014). Most of these management practices are designed to reduce problems resulting from moral hazard of an organization's members and adverse selection among those wishing to join an organization. Accordingly, the following testable hypothesis can be derived:
Hypothesis 2
The larger a cooperative's acreage, the better its performance.
Finally, cooperatives that have survived for long periods in a highly competitive environment such as the wine industry must have successfully addressed the typical problems of cooperatives. A cooperative that has been able to successfully tackle difficult issues such as moral hazard and adverse selection is also likely to achieve better product quality. Moreover, the longer a cooperative survives, the stronger the ties among its members, creating trust in the organization. Finally, the social relationships among members of a cooperative improve over time, members are more likely to accept or even actively support the implementation of superior management practices. If, for example, new methods of fertilization become available, resistance against change—a characteristic of old and established organizations—will be lower if members trust each other and their management. Consequently, cooperatives perform better as they age and the social ties and connections among their members improve. Thus, the third hypothesis is as follows:
Hypothesis 3
The older a cooperative, the better its performance.
IV. Data, Method, and Descriptive Statistics
A. Sample
To empirically test the hypotheses derived previously, we compiled a dataset using different publicly available sources. In total, we were able to identify 208 cooperatives in Austria, Germany, and northern Italy. The majority of them (n = 165) come from Germany, 29 are located in Austria, and 14 in northern Italy. For each of these cooperatives we collected information on the three attributes that we are particularly interested in: the organization's number of members, its size (in terms of acreage), and its founding year. The data were compiled either from public sources (e.g., the respective cooperative's website) or by direct contact with the cooperatives or the country-specific umbrella organization. The final dataset comprises 111 German, 11 Austrian, and 14 northern Italian organizations, yielding a total of 136 cooperatives. In a second step, we merged that data with information from two highly respected and widely sold wine guides, the Gault Millau and the Falstaff. While Gault Millau is only available for Germany and Austria, Falstaff is available for all three countries. Our dependent variable is whether each of these 136 cooperatives is listed in at least one of the two wine guides in their most recent editions, 2016–2017, or not.
Since 1993, the Gault Millau wine guide evaluates the quality of wines produced by the elite of German wine producers, currently more than 12,000 per year. Each winery submits what it considers a representative portfolio of wines to taste. The wines are reviewed by a jury and are then scored on the widely used 100-point scale. A score in the range of 90–94 indicates an outstanding wine of superior quality. On average, six to eight wine portfolios are tasted in a few rounds each day. Generally, the wines are not tasted blindly, as the style of each winery must be evaluated in comparison with previous years, as well as its current strengths and weaknesses. However, in order to validate the results of the open tasting, additional blind tastings are carried out during regional and nationwide events. Following this procedure, the wineries and selected wines are listed in the guide free of charge.
Falstaff, originally a guide to wines from Austria and first published in 1980, started to offer a German version in 2013. In fact, Falstaff also uses the 100-point scale to evaluate individual wines. It differs from Gault Millau in that wineries do not apply for inclusion by sending portfolios of their wines, but are instead selected and invited to be listed. The selection is performed by a jury of 15 wine specialists, who taste the wines non-blind in a first step. This is followed by an evaluation of the jury members that decides which winery to include in the guide. After a positive evaluation, the wineries have to pay a commission of approximately €500 to be included in the guide.
B. Measures
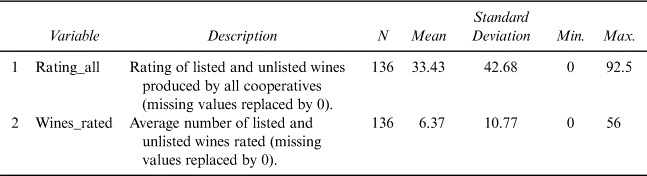
In detail, we use eight variables in the econometric model. Table 1 provides the summary statistics of the sample.
Descriptive Statistics and Correlations

Notes: Descriptive statistics refer to 136 observations; *** p < 0.01, ** p < 0.05, * p < 0.10.
Source: Authors’ compilation from the 2016–2017 editions of Gault Millau and Falstaff.
Being listed in a leading wine guide is now considered a valid proxy of a winery's product quality and reputation (Frick and Simmons, Reference Frick and Simmons2013). This measure is included as a binary variable, which takes the value of 1 if the cooperative is listed in one of the wine guides in the 2016–2017 editions. Slightly more than one-third (49 of 136) of all the cooperatives are listed in one of the two guides.
The German edition of Falstaff seems to be more selective than Gault Millau, which only lists 7.2% of the cooperatives included in our sample, while Gault Millau lists 19.8%. Both wine guides list eight cooperatives in Austria (72.7%). Six of these cooperatives are listed in both wine guides, whereas four are recorded in only one of them. All Italian cooperatives, except one, are included in Falstaff. Gault Millau does not publish a guide for northern Italy. In summary, 19 cooperatives are listed in Falstaff only, 20 in Gault Millau only, and 10 in both guides.
The main explanatory variables are the number of members, acreage (measured by hectares of vineyards), and age. The average number of members is 356 across the three countries. As shown in Table 2, cooperatives in northern Italy are particularly large (382 members) while those in Austria are rather small on average (199 members). This difference, however, is not statistically significant at any conventional level due to the skewness in the respective size distributions. In Germany, many small cooperatives coexist with a few very large ones. Ten of the German cooperatives have more than 1,000 members. In Austria, on the other hand, 10 of the cooperatives have less than 500 members. One Austrian cooperative has 980 members, skewing the average. Finally, in northern Italy, the mean is influenced by a single outlier (one cooperative has more than 2,000 members).
Cooperatives Size (Number of Members) by Country

Notes: Descriptive statistics refer to 136 observations.
Source: Authors’ compilation from the 2016–2017 editions of Gault Millau and Falstaff.
The second independent variable is acreage. It appears from Table 3 that the average size is 318 hectares and that the country averages are similar for Austria and Germany (the mean difference is statistically insignificant). The respective value for northern Italian cooperatives is heavily skewed by one particularly large cooperative with 5,200 hectares, which leads to a high standard deviation of 1,328. In order to avoid problems due to skewing, we use the natural logarithm of acreage in the estimations, the results of which will be displayed later.
Cooperative Size (in Hectares) by Country

Notes: Descriptive statistics refer to 136 observations.
Source: Authors’ compilation from the 2016–2017 editions of Gault Millau and Falstaff.
It is not surprising that the acreage and the size of membership are significantly correlated at r = +0.66. To rule out problems resulting from multicollinearity, we calculated the variance inflation factors (VIF) for each of the models, the results of which we report later. The maximum VIF was 1.58, far below the critical value of 10.
Another exogenous variable is the age of a cooperative. The youngest cooperative in the dataset is only two years, and the oldest is 159 years old. The average cooperative was founded in 1936 and, therefore, is currently 81 years old. Unlike the other independent variables, age does not seem to be skewed (see Table 4). Country means and medians are close to each other and are normally distributed. It does appear, however, that Austrian cooperatives are far younger than German (t = 4.93, p = .000) and Italian (t = 2.52, p = .009).
Cooperative Age by Country

Notes: Descriptive statistics refer to 136 observations.
Source: Authors’ compilation from the 2016–2017 editions of Gault Millau and Falstaff.
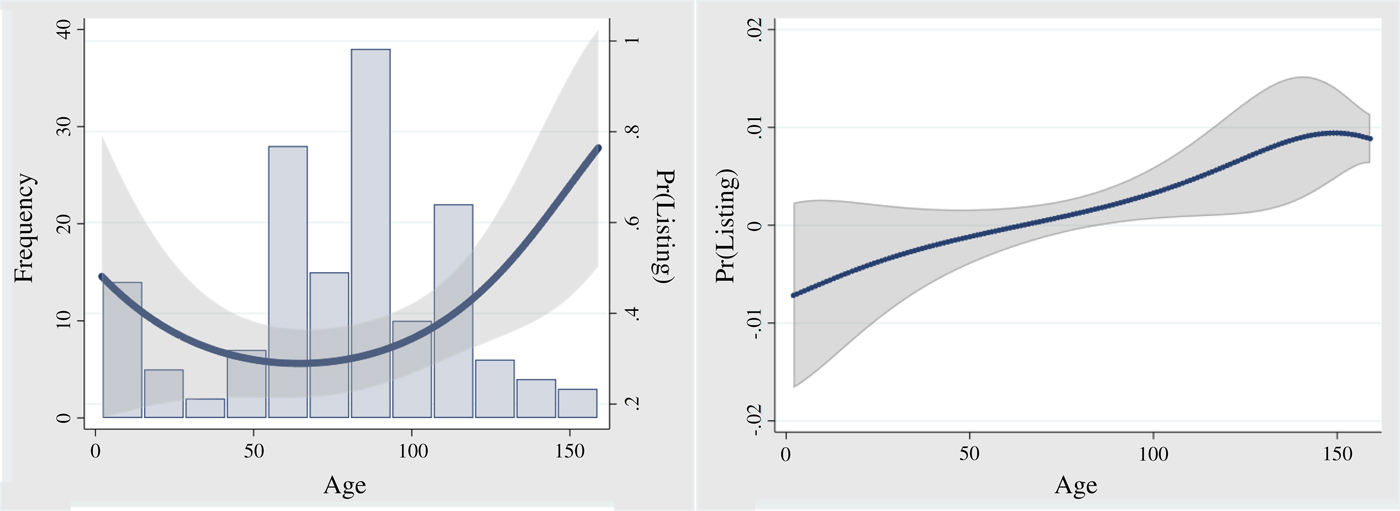
The relationship between the age of a cooperative and its probability of being listed in one of the two wine guides seems to follow a U-shaped pattern (see Figure 1). Due to this shape it needs to be tested whether only a linear or, in addition, a quadratic age term should be included in the estimation. The respective statistics test will be provided later with the results of our final model.
Probability of Being Listed by Age of Cooperative

To control for further (potential) effects caused by country of origin, we include in our estimations two dummy variables separating Austrian and Italian cooperatives from German ones. We expect the country effects to be statistically significant, as only 23.4% of all German cooperatives, but 90.9% of Austrian and 92.9% of Italian cooperatives are listed.
C. Alternative Performance Measures
Comparing the results of different specifications of an econometric model is a common way of confirming the robustness of the findings. Hence, we use two alternative measures of performance for estimation purposes (see Table 5).
Overview of Dependent Variables Used for Robustness Checks

Source: Authors’ compilation from the 2016–2017 editions of Gault Millau and Falstaff.
One possible measure is the reputation of the respective winery. However, the respective scales differ between Gault Millau Austria, Gault Millau Germany, and Falstaff. To address this problem, we converted the available information to match wine grades across the different guides. These converted ratings are then used to calculate the average wine rating per cooperative. Using grades instead of a dummy indicating whether a cooperative is listed introduces heterogeneity among the listed cooperatives, but makes a distinction from the unlisted ones more difficult. This difficulty is due to the fact that missing grades cannot be interpolated. The wines of the listed cooperatives have an average score of 87.6 points on a scale ranging from 0 to 100. Including unlisted cooperatives (assuming their scores to be zero), reduces that mean value to 33.4 points.
Our second variable of alternative outcome is the quantity of rated wines. This measure has the advantage that it again considers heterogeneity among the listed cooperatives. Furthermore, it is again possible to include wineries that are not listed. On average 6.37 wines are listed in each of the two wine guides and values range from 0 (for unlisted cooperatives) to 56. However, the mere number of rated wines is an inappropriate proxy for quality, as it is likely to depend on the size and the product portfolio of a cooperative. To conclude, we use two alternative performance measures in addition to our preferred dependent variable (whether a cooperative is listed in at least one of the two guides or not) to document the robustness of our findings. Since these latter measures have a number of disadvantages, we refrain from discussing the respective results in detail.
D. Econometric Approach
In order to identify the determinants of the probability that a winery is listed in one of the two wine guides, we can use either a logistic or a probit regression approach. Both methods differ in the assumption about the underlying distribution. The logistic model assumes a logistic distribution, whereas the probit model assumes a normal distribution. Since the results of the estimation are very similar, we restrict ourselves to the presentation of the findings obtained from a logistic regression. The model is of the following general form:
 $$Y_i = \; \beta _0 + \beta _1Members + \beta _2Ln\_Hectare + \beta _3Age + \beta _4Age2 + \beta _4Country + \varepsilon _i$$
where β 0 denotes the intercept and εi the unexplained random error term.
To rule out biased coefficients that do not adequately reflect the impact of a cooperative's age, we also estimate a semiparametric model that includes a non-parametric age effect. Following the specification test developed by Hardle and Mammen (Reference Hardle and Mammen1993), we found no evidence to support the use of the semiparametric model (p = 0.301) and hence present the findings of the logistic model described earlier (the results of the semiparametric model can be found in the Appendix).
V. Empirical Results
A. Estimation Results
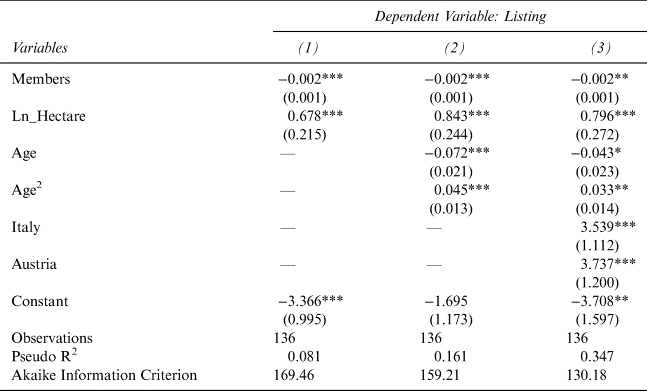
The results of the logistic regression are shown in Table 6. We present three models, which successively include more independent and control variables. The baseline model (1) includes the number of members and hectares as independent variables. The second model (2) contains all independent variables. The third model (3) includes the country controls (with Germany being the reference country). Comparing the three models, it appears that the results are quite robust and that the magnitude of the coefficients does not change dramatically.
Estimation Results of Logistic Regression

Notes: Table reports coefficients after logistic regression with “listing” as the dependent variable. Coefficient of Age2 multiplied by 100 for ease of presentation. Robust standard errors in parentheses. *** p < 0.01, ** p < 0.05, * p < 0.10.
Source: Authors’ model results.
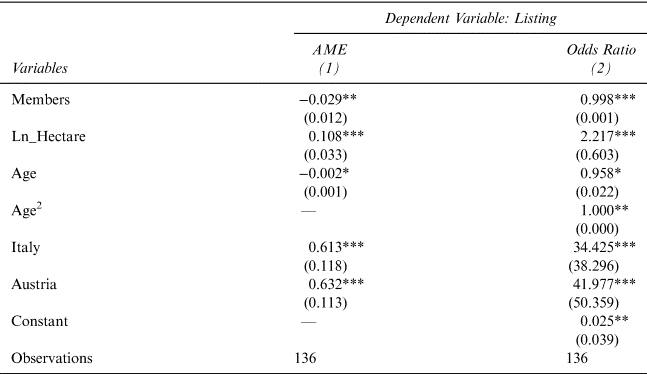
The average marginal effects (AMEs) as well as odds ratios after logistic regression, provide detailed information on how the independent variables influence the probability of being included in the list. Table 7 shows these results. The odds ratios provide information on the effect size of the variables, as well as on their direction. It appears that an increase in the number of members is associated with a significantly lower probability that a cooperative is listed in one of the two guides. More precisely, 100 additional members reduce the probability of being listed by 2.9 percentage points. Consequently, the first hypothesis suggesting that an increase in the number of members is negatively associated with the performance of the cooperative, can be confirmed. On the other hand, cooperative size with respect to acreage increases the probability of being listed in one of the wine guides across all models, supporting hypothesis 2. The odds ratios show that when acreage increases by 1%, the probability of being listed more than doubles.
AMEs and Odds Ratios of Logistic Regression

Notes: Table reports AMEs (column 1) and odds ratios (columns 2) after logistic regression with “listing” as the dependent variable. Coefficient of number of members for AME multiplied by 100 for ease of presentation. No separate marginal effect for age2 can be estimated. Standard errors in parentheses. *** p < 0.01, ** p < 0.05, * p < 0.10.
Source: Authors’ model results.
Using the test suggested by Lind and Mehlum (Reference Lind and Mehlum2010), we find a u-shaped effect of age on cooperative performance (p = 0.0363). Consequently, we include a linear and a quadratic age term in our estimations. We find a statistically significant and negative effect of age and a statistically significant and positive effect of age squared on the probability of being listed. Thus, the u-shaped effect of age on the probability of being listed as displayed in Figure 1 is confirmed. The left panel of Figure 2 illustrates the probability of being listed for the age of the organization. It appears that cooperatives that are around 133 years old have a significantly higher listing probability than those between the ages of 62 and 70 years. The oldest cooperative in our sample is 158 years old and has a significantly higher probability of being listed than all those between 25 and 113 years old. Of the seven cooperatives older than 133 years, 57.1% are listed in one of the two wine guides, while only 34.9% of the 129 cooperatives younger than that threshold are listed. The right panel of Figure 2 shows the AMEs of age. It appears that after 85 years, the probability of being listed increases significantly. Below this value, no significant changes can be observed. Therefore, hypothesis 3, stating a positive impact of age on the probability of being listed, can be partly confirmed. We conclude that only particularly old cooperatives have a higher probability to be listed and vice versa.
Predicted Probabilities/Frequencies (Left) and AMEs (Right) of Age

Finally, compared to Germany, cooperatives located in Austria and Italy have a significantly higher probability of being listed in either of the two guides. This coincides with the descriptive results stating that all except one (92.9% of 14) of the northern Italian cooperatives are listed. In Austria, the respective share is 90.9% (10 of 11), and in Germany 23.4% (26 of 111). This result demonstrates fundamental differences between the countries in addressing the problems resulting from the organizational idiosyncrasies of cooperatives, which we will turn our attention to next.
B. Robustness Checks
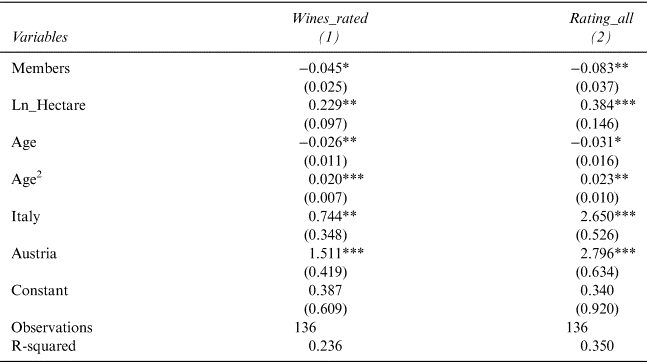
To document the robustness of our findings, we now turn to our estimations using alternative performance measures as the dependent variable, such as the logarithm of the number of rated wines and the logarithm of the average wine rating for each cooperative (as explained previously, both measures increase the heterogeneity among the listed cooperatives in terms of performance).
The estimation results presented in Table 8 document that the effects for the number of wines rated (1) and the average wine rating (2) are very similar. Although the magnitudes of the coefficients differ slightly, their signs and levels of significance remain constant. Summarizing, it appears that being listed in at least one of the two wine guides can be considered a valid and robust performance measure. Moreover, considering inclusion in either Gault Millau or Falstaff only yields very similar results that are available from the authors on request.
Estimation Results Using Alternative Performance Measures

Notes: Table reports coefficients after estimation of logarithmized alternative performance measures. Coefficient of number of members and age2 multiplied by 100 for ease of presentation. Robust standard errors in parentheses. *** p < 0.01, ** p < 0.05, * p < 0.10.
Source: Authors’ model results.
VI. Discussion
Our empirical results imply that larger cooperatives perform worse than smaller ones, suggesting that larger cooperatives suffer more from the problems associated with that particular organizational form. By attributing this to free riding and control problems, our results are consistent with previous research. Winfree and McCluskey (Reference Winfree and McCluskey2005), for example, report that free rider problems increase with the number of members. Due to moral hazard, individual members tend to exploit the cooperative for their own benefit, particularly in larger organizations. This type of (undesired) behavior is reinforced by the presence of monitoring and follow-up problems, which are also likely to increase with the size of an organization (Staatz, Reference Staatz1987). Therefore, especially growing cooperatives and those with an already established reputation, should be very careful in monitoring incumbent members and in screening applicants. The former is necessary to avoid moral hazard and the latter to avoid adverse selection.
Our second result shows that cooperative size with respect to acreage increases the probability of being listed in one of the wine guides, suggesting that there are considerable returns to implementing superior management practices. This latter finding is compatible with the previous one that larger cooperatives—those with more members—perform worse than smaller organizations—those with fewer members—as the former suffer more from moral hazard and adverse selection. Larger—in terms of acreage—cooperatives tend to implement better management practices (Bloom and Van Reenen, Reference Bloom and Van Reenen2007, Reference Bloom and Van Reenen2010; Bloom et al., Reference Bloom, Sadun and Van Reenen2012; Bloom, Sadun, and Van Reenen, Reference Bloom, Sadun and Van Reenen2012; Bloom et al., Reference Bloom, Eifert, Mahajan, McKenzie and Roberts2013; Bloom et al., Reference Bloom, Lemos, Van Reenen, Sadun and Scur2014) and are, therefore, more successful. Most likely, size in terms of acreage is not only associated with better managers, but also with more competent members who are willing to invest in hiring better managers and in implementing management practices that have been found to improve an organization's performance. Poorly performing wineries may try to learn from “best practices”, that is, from those that have been successful in avoiding or at least reducing the problems resulting from the idiosyncrasies of the organizational architecture they have in common.
Our third result suggests that age matters: Cooperatives older than 132 years old have a significantly higher probability of being listed than those aged around the turning point of 64 years. This suggests that the management of the old cooperatives can (and do) rely on the successful history of the organization, that is, its experience and tradition. Very young cooperatives, in turn, do not have a significantly higher probability of being listed, which is likely due to the small number of observations. However, our findings nevertheless indicate that the listing probability of young cooperatives is quite similar compared to that of old cooperatives, with the former being better able to implement and use particular management practices that help to avoid or reduce the problems of moral hazard and adverse selection. Thus, depending on the age of an organization, a similar outcome can be attributed either to an incentive effect (i.e., managers of young cooperatives deliberately choose from a wide range of available organizational practices) or to a selection effect (i.e., managers of surviving cooperatives understand the particular problems associated with the idiosyncrasies of their organizational architecture better). Apart from that, however, recent research has shown that even poorly managed firms can survive in a highly competitive environment (Bloom et al., Reference Bloom, Eifert, Mahajan, McKenzie and Roberts2013). From the perspective of a wine grower, this suggests that one should either join a fairly young or a fairly old cooperative or decide to remain independent. From the perspective of insiders (those who are already members), it makes sense to search for new members by emphasizing the age of the organization—and indirectly—its superior performance. Finally, the management of the old cooperatives should resist the temptation to change practices that have proven to be successful for decades and not follow management fashions that are promoted by outsiders completely unfamiliar with the internal organization and the internal processes of a particular cooperative. New cooperatives, on the other hand, should not only implement management practices that improve the performance of the firm (as described by Katz and Boland, Reference Katz and Boland2002), but should also preserve the enthusiasm of their founding members by investing in the creation of a “corporate culture.” This, in turn, helps to overcome the problems resulting from moral hazard and adverse selection.
Finally, compared to Germany, cooperatives located in Austria and Italy have a significantly higher probability of being listed in either of the two guides. This indicates that cooperatives in the latter two countries are far more successful in dealing with the problems associated with their specific organizational form. However, given the design of this study, we can only emphasize the impact of organizational characteristics on the performance of cooperatives, but are not yet able to explain the observable differences across countries that are likely to be rooted in cultural and/or political differences that need to be explored in more detail.
VII. Conclusion
This is the first study to investigate the influence of the impact of cooperative characteristics on the performance of this form of organization. Much has been said about the incentive problems inherent in cooperatives (e.g., Albæk and Schultz, Reference Albæk and Schultz1998; Borgen, Reference Borgen2004; Pennerstorfer and Weiss, Reference Pennerstorfer and Weiss2012). Using a dataset including 136 cooperative wineries in Austria, Germany, and northern Italy, we empirically address this problem.
Our evidence suggests that older and larger—in terms of acreage—cooperatives have a significantly higher probability of being listed in one of two highly respected wine guides. Moreover, it appears that German cooperatives have a significantly lower probability of being listed than observationally similar cooperatives in Austria and northern Italy. Assuming that standards for evaluating the quality of wines and wineries are the same in the two wine guides, differences in performance can best be explained by analyzing the differences in the quality of the cooperatives’ management. Cooperatives that are better able to minimize—or perhaps even completely avoid—moral hazard and adverse selection among their members perform significantly better.
The present analysis provides an almost complete picture of cooperatives in northern Italy. However, due to missing data for Austria and Germany, further studies should try to close that gap by including more observations from these countries. In addition, we suggest exploring in detail the differences in performance and their main drivers between cooperatives in Germany, Austria, and northern Italy .It is likely that cultural differences are important here. Another suggestion for future research is to use time-series data instead of cross-sectional data to better control for unobserved heterogeneity across cooperatives. Moreover, this would allow identification of causal effects. Although we assume acreage and age to have a statistically significant and positive impact on the success of cooperatives, we cannot completely rule out that particularly successful cooperatives increase their acreage. The use of time-series data allows to control whether success depends on acreage or whether acreage is a function of success. In addition, since acreage is only a proxy for superior management practices, the latter—as well as their impact on performance—should be investigated in more detail.
These shortcomings notwithstanding, we conclude by emphasizing that the key to success for cooperatives around the world is that they invest in the implementation of management practices and instruments that either completely avoid or at least significantly reduce moral hazard and adverse selection among incumbents and applicants.
Appendix
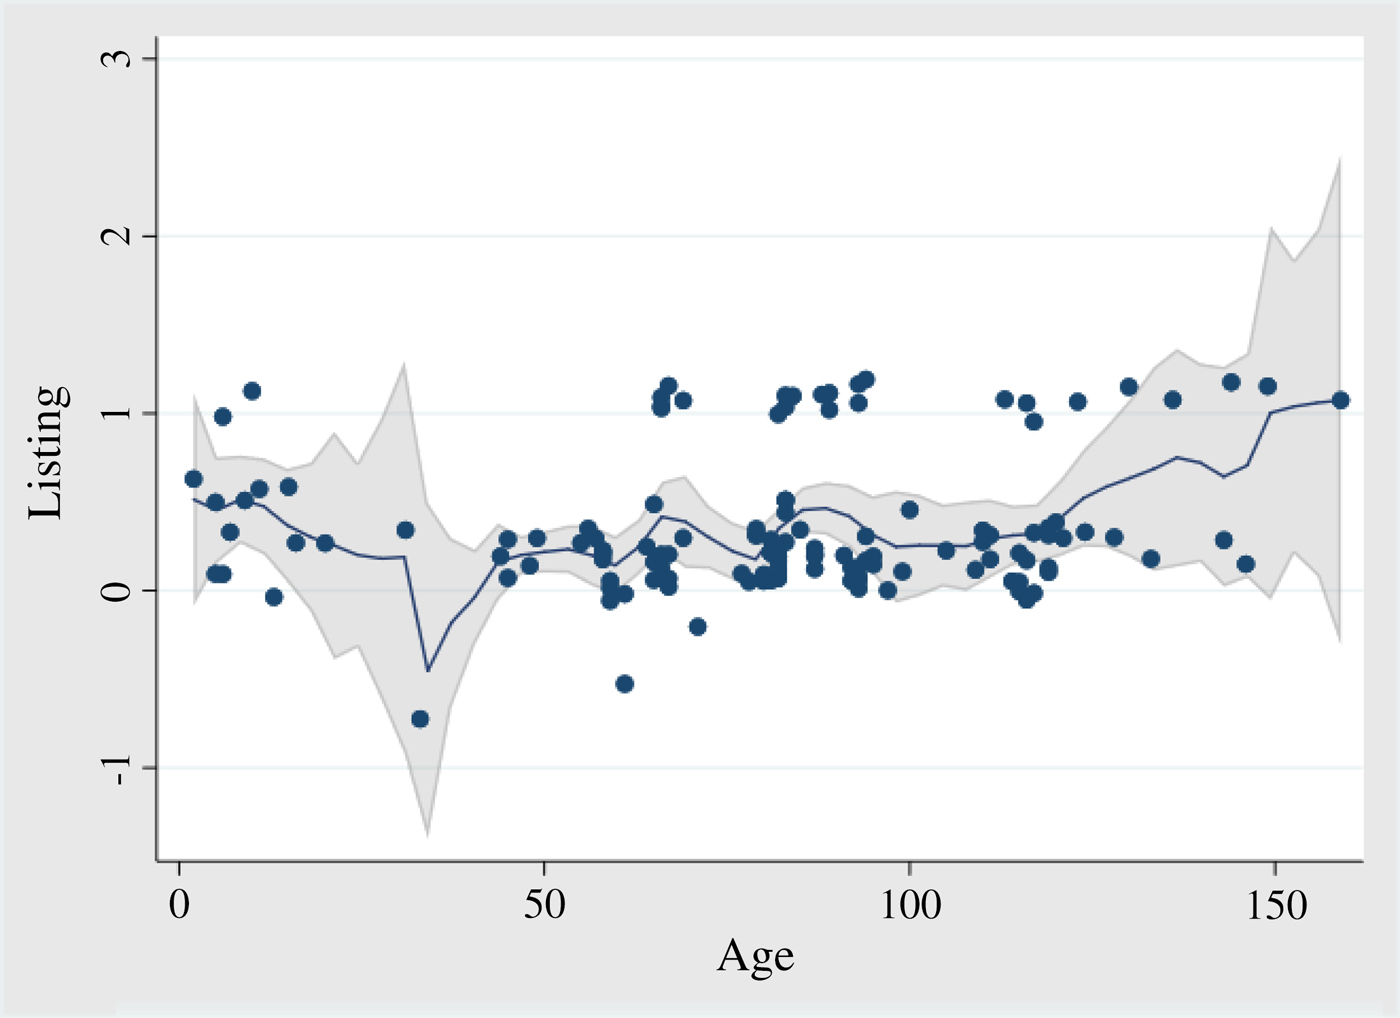
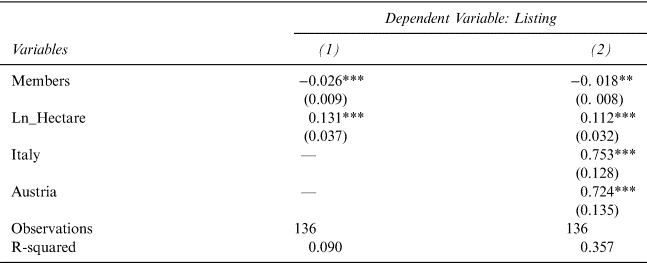
Here we present the results of a semiparametric model, since the cooperative's age might lead to biased coefficients due to a non-linear influence. The model includes age as a non-parametric variable (see Figure A1). All other variables are included as in our main logistic model (see Table A1). Using the specification test suggested by Hardle and Mammen (Reference Hardle and Mammen1993) we find that the logistic model is preferable to the semi-parametric model as the test does not provide support (p = .301) for the latter.
Non-parametric Estimation of the Effect of Cooperative Age on Listing

Estimation Results Semiparametric Regression