


1. Introduction
Cys-loop ligand-gated ion channels (LGICs) are membrane-spanning proteins that are activated by neurotransmitters; they are responsible for fast excitatory and inhibitory neurotransmission in the central and peripheral nervous systems. Vertebrate members of this family include serotonin (5-HT3), acetylcholine (nicotinic ACh or nACh), glycine (Gly), γ-aminobutyric acid (GABAA, GABAC) and zinc-activated (ZAC) receptors (R). There are also a range of invertebrate Cys-loop receptors gated by the same and other neurotransmitters (e.g. EXP-1, MOD-1, pHCl, HisCl, RDL, GluCl and SsCl), and related proteins have been identified in prokaryotes (e.g. ELIC and GLIC). Cys-loop receptors are the major targets for many active compounds, including anaesthetics, muscle relaxants, insecticides and a range of drugs that treat neurological disorders such as Alzheimer's, anxiety, epilepsy, learning, attention deficit and drug addiction. Methods such as high throughput screening (HTS) and fragment-based drug discovery (FBDD) use blind searches of large compound libraries to find drug candidates, but a rational design of more effective drugs requires a detailed molecular knowledge of the sites at which they act. For Cys-loop receptors, this information lags behind that of many other proteins.
Cys-loop receptors derive their name from a 13-amino-acid loop within the extracellular domain (ECD) that is enclosed by a pair of disulphide-bonded Cys residues. Members of the family share a common structure, consisting of five pseudo-symmetrically arranged subunits surrounding a central ion-conducting pore (Fig. 1). Most receptors have more than one type of subunit, and these can combine in different combinations to yield a complex array of (usually) heteromeric receptor stoichiometries, with varying physiological and pharmacological properties. Each receptor family is selective for either cations or anions, and their activation can be either excitatory or inhibitory, depending on the distribution of ions at either side of the membrane, and the membrane potential of the cell. The structure of the subunits has been studied using a variety of biochemical techniques such as mutagenesis, photolabelling and cryo-electron microscopy, and more recently by X-ray crystallography. Each subunit can be functionally separated into three domains: The large ECD contains the ligand-binding site and is a major target for therapeutics. The transmembrane domain (TMD) consists of four membrane-spanning α-helices (M1–M4) that enable ions to cross the membrane and is the target for compounds such as alcohols, anaesthetics and steroids. The intracellular domain (ICD) is primarily formed by the large M3–M4 intracellular loop (~100–270 residues), and is responsible for receptor modulation, sorting and trafficking, and contains portals (openings) that allow ions access in and out of the pore and influence ion conductance. Recent studies have described homologous bacterial proteins that do not possess a Cys-loop or an ICD, and deletion studies in the 5-HT3R and GABACR suggest that the ICD is not essential for the expression of vertebrate receptors (Bocquet et al. Reference Bocquet, Prado De Carvalho, Cartaud, Neyton, Le Poupon, Taly, Grutter, Changeux and Corringer2007; Jansen et al. Reference Jansen, Bali and Akabas2008).
Important functional components of the 5-HT3 receptor, a typical member of the Cys-loop family of LGICs. The structure shown is a 5-HT3 homology model based on a 4 Å-resolution structure of the nAChR (Miyazawa et al. Reference Miyazawa, Fujiyoshi and Unwin2003; PDB ID: 2BG9). The 5-HT3 receptor, like the other members, consists of five subunits (1–5). The receptor is shown from above and from the side with two (red & blue) of the five subunits highlighted. Specific residues of interest are highlighted in yellow. The receptor is modular in nature and can be considered as having three main regions termed the ECD, TMD and ICD. The ECD contains the ligand-binding site that is formed by the convergence of six peptide loops located at the interface of two adjacent subunits (Noam et al. Reference Noam, Wadman and Van Hooft2008; Thompson & Lummis, Reference Thompson and Lummis2006). Three rings of charged amino acids (extracellular, intermediate and cytoplasmic) are found in the pore lining α-helices of the TMD (Gunthorpe & Lummis, Reference Gunthorpe and Lummis2001; Thompson & Lummis, Reference Thompson and Lummis2003), and a hydrophobic constriction in the centre of the channel acts as the channel gate (Panicker et al. Reference Panicker, Cruz, Arrabit and Slesinger2002).

In summary, all Cys-loop receptors share homologous structures, and the basic mechanisms by which they function are also similar. In this review, we look at all members of the family, although concentrating largely on the 5-HT3R, to explore the relationship between structure and function. The 5-HT3R is a typical Cys-loop receptor, and has the advantage that it functions as a homomeric receptor, which simplifies the interpretation of experimental data. This protein has also been used extensively in homology modelling and ligand docking (Maksay et al. Reference Maksay, Bikadi and Simonyi2003; Reeves et al. Reference Reeves, Sayed, Chau, Price and Lummis2003; Thompson et al. Reference Thompson, Price, Reeves, Chan, Chau and Lummis2005; Yan & White, Reference Yan and White2005). As this technique is becoming an accepted route to understanding the structural details of the proteins, we use the new homology models and docked ligands to explore the validity of these techniques to define specific molecular interactions with agonists and antagonists in the 5-HT3 ligand-binding site.
For further reading, a number of recent reviews also cover some of the topics discussed here (Arias, Reference Arias2006; Auerbach, Reference Auerbach2010; Barnes et al. Reference Barnes, Hales, Lummis and Peters2009; Chen, Reference Chen2010; Corringer et al. Reference Corringer, Baaden, Bocquet, Delarue, Dufresne, Nury, Prevost and Van Renterghem2010; Hogg et al. Reference Hogg, Raggenbass and Bertrand2003; Lynch, Reference Lynch2004, Reference Lynch2009; Millar & Gotti, Reference Millar and Gotti2009; Peters et al. Reference Peters, Hales and Lambert2005, Reference Peters, Cooper, Carland, Livesey, Hales and Lambert2010; Webb & Lynch, Reference Webb and Lynch2007; Yakel, Reference Yakel2010).
2. Subunit stoichiometry
The stoichiometry of the neuromuscular nAChR was the first to be determined, and revealed that four different subunits formed a functional pentameric receptor with the stoichiometry α2βγδ (Karlin et al. Reference Karlin, Holtzman, Yodh, Lobel, Wall and Hainfeld1983). Determining the stoichiometry of other receptors has proved to be more problematic, as there are large numbers of subunits that could potentially contribute (e.g. 19 in the GABAA receptor family), and it is becoming apparent that different arrangements may exist even with the same subunit types (Gotti et al. Reference Gotti, Moretti, Gaimarri, Zanardi, Clementi and Zoli2007; Millar & Gotti, Reference Millar and Gotti2009; Millar & Harkness, Reference Millar and Harkness2008; Olsen & Sieghart, Reference Olsen, Chang, Li, Hanchar and Wallner2009). For example, neuronal α4β2 nAChR may be α2β3 or α3β2, which have differing pharmacologies (Moroni & Bermudez, Reference Moroni and Bermudez2006; Moroni et al. Reference Moroni, Zwart, Sher, Cassels and Bermudez2006). Studies indicate, however, that only a limited number of the possible stoichiometries are found in vivo, possibly because of cell-specific expression and/or interactions between subunit interfaces that form during receptor assembly (e.g. neuronal GABAA receptors are predominantly α12β22γ2). Receptor types may also be restricted to specific regions of the body (e.g. GABAC receptors are largely restricted to retinal bipolar cells; Cutting et al. Reference Cutting, Lu, O'Hara, Kasch, Montrose-Rafizadeh, Donovan, Shimada, Antonarakis, Guggino and Uhl1991; Enz & Cutting, Reference Enz and Cutting1999). Some Cys-loop receptors have considerably fewer potential stoichiometries. For example, there are only four known isoforms of the GlyR α-subunit (α1–α4) and a single β-subunit, with the probable stoichiometry of α13β2 or α14β (Lynch, Reference Lynch2009; Webb & Lynch, Reference Webb and Lynch2007), and only a single subunit has been described for vertebrate Zn2+-activated receptors (Davies et al. Reference Davies, Wang, Hales and Kirkness2002). Invertebrate receptors may also have multiple subunits; several glutamate-gated and pHCl receptor subunits have been reported, although currently there are only two known histamine-gated receptor subunits (HisCl1 and HisCl2SsCl) and single SsCl and MOD-1 receptor subunits (Cully et al. Reference Cully, Paress, Liu, Schaeffer and Arena1996, Reference Cully, Vassilatis, Liu, Paress, Van Der Ploeg, Schaeffer and Arena1994; Mounsey et al. Reference Mounsey, Dent, Holt, Mccarthy, Currie and Walton2007; Ranganathan et al. Reference Ranganathan, Cannon and Horvitz2000; Zheng et al. Reference Zheng, Hirschberg, Yuan, Wang, Hunt, Ludmerer, Schmatz and Cully2002). Prokaryotic receptors discovered to date also only have single subunits, but as many of these have only recently been described, the diversity of their subunits types may grow with further investigation (Bocquet et al. Reference Bocquet, Prado De Carvalho, Cartaud, Neyton, Le Poupon, Taly, Grutter, Changeux and Corringer2007; Hilf & Dutzler, Reference Hilf and Dutzler2008; Nury et al. Reference Nury, Bocquet, Le Poupon, Raynal, Haouz, Corringer and Delarue2009).
The 5-HT3R is an example of a Cys-loop receptor with relatively few subunits; five have been identified to date (A–E), although like many other receptors, some of these demonstrate a further level of complexity that results from different splice-variations and differing post-translational modifications (Bruss et al. Reference Bruss, Barann, Hayer-Zillgen, Eucker, Gothert and Bonisch2000; Tzvetkov et al. Reference Tzvetkov, Meineke, Oetjen, Hirsch-Ernst and Brockmoller2007; Werner et al. Reference Werner, Kawashima, Reid, Hussy, Lundstrom, Buell, Humbert and Jones1994). For example, there are long and short forms of the mouse 5-HT3A subunit that differ by six amino acids, and there are three translational variants of the human 5-HT3B subunit (Fig. 2). Only 5-HT3A subunits can form functional homomeric 5-HT3Rs, and appear to be obligatory in heteromeric receptors (Holbrook et al. Reference Holbrook, Gill, Zebda, Spencer, Leyland, Rance, Trinh, Balmer, Kelly, Yusaf, Courtenay, Luck, Rhodes, Modha, Moore, Sanger and Gunthorpe2009; Niesler et al. Reference Niesler, Walstab, Combrink, Moeller, Kapeller, Rietdorf, Boenisch, Goethert, Rappold and Bruess2007). Of the heteromeric receptors, only 5-HT3AB receptors have been extensively characterized and, compared to homomeric 5-HT3A, 5-HT3AB receptors differ in their EC50, Hill slope, desensitization kinetics, shape of current–voltage relationship, and most noticeably, a much larger single-channel conductance (~16 pS in 5-HT3AB compared to <1 pS in 5-HT3A; Davies et al. Reference Davies, Pistis, Hanna, Peters, Lambert, Hales and Kirkness1999; Dubin et al. Reference Dubin, Huvar, Andrea, Pyati, Zhu, Joy, Wilson, Galindo, Glass, Luo, Jackson, Lovenberg and Erlander1999). However, the pharmacology of 5-HT3A and 5-HT3AB receptors is almost identical, suggesting that they contain a common binding site (an A–A interface), a hypothesis supported by a recent study of mouse 5-HT3AB receptors (Brady et al. Reference Brady, Stanford, Ali, Lin, Williams, Dubin, Hope and Barnes2001; Lochner & Lummis, Reference Lochner and Lummis2010), but conflicting with the BABBA arrangement determined using atomic force microscopy (Barrera et al. Reference Barrera, Herbert, Henderson, Martin and Edwardson2005). The subunit types and stoichiometry of 5-HT3Rs have been recently reviewed (Barnes et al. Reference Barnes, Hales, Lummis and Peters2009; Jensen et al. Reference Jensen, Davies, Brauner-Osborne and Krzywkowski2008).
Alignment of human 5-HT3 receptor subunits. The binding loops (A–F) and transmembrane (M1–M4) regions are highlighted by horizontal lines above the text. Conserved residues are highlighted with a grey background. The human alternative long (5-HT3AL), truncated (5-HT3AT), Brain1 (5-HT3BR1) and Brain2 (5-HT3BR2) forms are shown. The boxes show the additional residues found in 5-HT3AL (32 amino acids) and 5-HT3D (12 amino acids) variants. Accession numbers for the alignment are as follows: 5-HT3A P46098, 5-HT3B O95264 and 5-HT3C Q6V706. 5-HT3D and 5HT3E were taken from Niesler et al. (Reference Niesler, Frank, Kapeller and Rappold2003). 5-HT3AL and 5-HT3AT were taken from Bruss et al. (Reference Bruss, Barann, Hayer-Zillgen, Eucker, Gothert and Bonisch2000). 5-HT3BR1 and 5-HT3BR2 were taken from Tzvetkov et al. (Reference Tzvetkov, Meineke, Oetjen, Hirsch-Ernst and Brockmoller2007).

3. The ECD
3.1. Structure
Recent X-ray crystal structures of the nAChR ECD have revealed molecular details of residues that contribute to the ligand-binding domain, but such studies of whole receptors, or even ECD pentamers are proving difficult to obtain (Dellisanti et al. Reference Dellisanti, Yao, Stroud, Wang and Chen2007). Therefore, most molecular details of Cys-loop receptors have been extrapolated from 4 Å resolution cryo-electron microscopy images of the nAChR, or from higher-resolution images of related acetylcholine binding proteins (AChBPs) and bacterial receptors. AChBPs are homologous to the ECD of nACh (~25% amino-acid sequence identity) and other Cys-loop receptors (15–20% identity). The original AChBP structure was determined at 2·7 Å resolution in 2001 (Brejc et al. Reference Brejc, Van Dijk, Klaassen, Schuurmans, Van Der Oost, Smit and Sixma2001), and since this time other AChBP structures have been reported (e.g. Celie et al. Reference Celie, Van Rossum-Fikkert, Van Dijk, Brejc, Smit and Sixma2004, Reference Celie, Klaassen, Van Rossum-Fikkert, Van Elk, Van Nierop, Smit and Sixma2005b; Hansen & Taylor, Reference Hansen and Taylor2007; Hibbs et al. Reference Hibbs, Sulzenbacher, Shi, Talley, Conrod, Kem, Taylor, Marchot and Bourne2009). The similarity between AChBP and the ECD of Cys-loop receptors was confirmed when the structures of an nACh subunit monomer and subsequently homologous prokaryotic receptors were determined (Bocquet et al. Reference Bocquet, Prado De Carvalho, Cartaud, Neyton, Le Poupon, Taly, Grutter, Changeux and Corringer2009; Dellisanti et al. Reference Dellisanti, Yao, Stroud, Wang and Chen2007; Hilf & Dutzler, Reference Hilf and Dutzler2008; Nury et al. Reference Nury, Bocquet, Le Poupon, Raynal, Haouz, Corringer and Delarue2009). With this similarity established, we can be more confident that studies that utilized the AChBP structure to make predictions within Cys-loop receptors were broadly correct. A review of prokaryotic receptors can be found in Corringer et al. (Reference Corringer, Baaden, Bocquet, Delarue, Dufresne, Nury, Prevost and Van Renterghem2010) .
3.2. The ligand-binding site
Early biochemical and labelling studies indicated that Cys-loop receptor ligand-binding sites were constituted by three non-contiguous regions from the ECDs of two contributing subunits. With the advent of the AChBP crystal structure, it was confirmed that the binding site was at the interface between two adjacent subunits (Brejc et al. Reference Brejc, Van Dijk, Klaassen, Schuurmans, Van Der Oost, Smit and Sixma2001; Celie et al. Reference Celie, Van Rossum-Fikkert, Van Dijk, Brejc, Smit and Sixma2004, Reference Celie, Kasheverov, Mordvintsev, Hogg, Van Nierop, Van Elk, Van Rossum-Fikkert, Zhmak, Bertrand, Tsetlin, Sixma and Smit2005a, Reference Celie, Klaassen, Van Rossum-Fikkert, Van Elk, Van Nierop, Smit and Sixma2005b). The two adjacent subunits are termed the principal and complementary subunits, and the binding site is formed by three peptide loops (loops A–C) from the principal subunit, and three β-sheets (loops D–F) from the complementary subunit; as this terminology was introduced before crystallographic studies revealed the secondary structure, these regions are not all ‘loops’ (Fig. 3).
AChBP, an analogous protein to the ECD of Cys-loop receptors. AChBP contains five subunits, but for clarity only two of these are shown. The binding loops and β-sheets are shown, the positions of which are taken from Brejc et al. (Reference Brejc, Van Dijk, Klaassen, Schuurmans, Van Der Oost, Smit and Sixma2001). The same binding loops and β-sheets are labelled in the linear amino-acid sequence below.

The exact location of the loop region varies subtly with different subunits of different receptors; the locations that we have shown in Fig. 3 are therefore only approximate. Only one or a few residues within each loop may face into the binding pocket, with residues in the remainder of the loop probably maintaining the structure of the pocket and/or participating in the conformational changes that result in channel opening. Evidence from AChBP structures (discussed later in section 7.5) suggests that binding of different ligands results in different movements of the binding pocket; the ECD generally contracts around agonists, but adopts a more open structure with antagonists. It has been known for some time that antagonists and agonists may interact with different binding pocket residues, and one ligand may interact with more or less residues than another (e.g. a large nAChR antagonist such as α-bungarotoxin (α-BTX) interacts with a much larger repertoire of residues than a small antagonist such as methyllycaconitine). What is perhaps more surprising is that agonists do not need to interact with the same residues to activate the receptor. For example, 5-HT forms a critical hydrogen bond with Glu129 in the 5-HT3R, but 5-FT, which still activates the receptor (albeit as a partial agonist), does not appear to interact at all with this residue (Bower et al. Reference Bower, Price, Sturdee, Dayrell, Dougherty and Lummis2008).
For the majority of Cys-loop receptors, at least two binding sites are required for channel activation, and at muscle nAChRs, the principal subunits at both these sites are the α1 subtype; for some neuronal receptors, it appears that the two principal subunits differ within a single receptor, for instance α4 and α6 (Champtiaux et al. Reference Champtiaux, Gotti, Cordero-Erausquin, David, Przybylski, Lena, Clementi, Moretti, Rossi, Le Novere, Mcintosh, Gardier and Changeux2003; Rayes et al. Reference Rayes, De Rosa, Sine and Bouzat2009). Questions about cooperative binding are often finessed with the statement that the open state of the channel is more likely to be associated with the presence of at least two bound agonists, although certain mutant receptors have Hill slopes near unity, allowing for the possibility of opening with just a single bound agonist. In some mutant receptors that are highly agonist-sensitive, there is also constitutive activation in the total absence of agonist, as though the open state is rather more stable than normal (e.g. Bhattacharya et al. Reference Bhattacharya, Dang, Zhu, Schnegelsberg, Rozengurt, Cain, Prantil, Vorp, Guy, Julius, Ford, Lester and Cockayne2004).
Cys-loop receptor-binding sites all contain a number of aromatic residues (Table 1). For many of the Cys-loop receptors, a cation–π interaction has been described between the natural ligand and one of these aromatic residues. This type of interaction has been observed in a variety of proteins using high-resolution structural data, but for Cys-loop receptors cation–π interactions have only been identified using unnatural amino acid mutagenesis (Dougherty, Reference Dougherty2008). For this technique, a series of electron-withdrawing or electron-donating groups are substituted onto the side chains of aromatic residues, subtly altering the energy of the cation–π interaction. If the EC50 varies monotonically with the calculated strength of the interaction, this is evidence for the presence of a cation–π interaction. In all Cys-loop receptors examined to date, when a cation–π interaction is found, the ligand interacts with only one aromatic side chain in the binding pocket; in some other proteins, the efficient stabilization of this bond relies upon interactions with several aromatic rings, and the optimal orientation of the cationic centre is normal to the planes passing through the centroids of these rings (Schärer et al. Reference Schärer, Morgenthaler, Paulini, Obst-Sander, Banner, Schlatter, Benz, Stihle and Diederich2005).
Aromatic residues in the binding sites of different Cys-loop receptors. Residues that contribute to cation-π interactions are shown in bold. 1,3Beene et al. (Reference Beene, Brandt, Zhong, Zacharias, Lester and Dougherty2002), 2Xiu et al. (Reference Xiu, Puskar, Shanata, Lester and Dougherty2009), 4Mu et al. (Reference Mu, Lester and Dougherty2003), 5Padgett et al. (Reference Padgett, Hanek, Lester, Dougherty and Lummis2007), 6Lummis et al. (Reference Lummis, Beene, Harrison, Lester and Dougherty2005a), 7Pless et al. (Reference Pless, Millen, Hanek, Lynch, Lester, Lummis and Dougherty2008). See Dougherty (Reference Dougherty2008) for further information. Note that loop D is in the complementary face, and residues from this face have not been found to form cation–π interactions to date

Different aromatic side chains (Trp, Phe or Tyr) make a cation–π interaction in different Cys-loop receptors. Each of these is located in one of the three loops on the principal subunit (Table 1); as yet, no cation–π interactions have been found in the complementary subunit. In the 5-HT3R, the contributing residue is a loop B Trp (Beene et al. Reference Beene, Brandt, Zhong, Zacharias, Lester and Dougherty2002, Reference Beene, Price, Lester, Dougherty and Lummis2004), while in the MOD-1 receptor (also activated by 5-HT) it is a Trp in loop C (W226; Mu et al. Reference Mu, Lester and Dougherty2003). Therefore, even in receptors activated by the same ligand, the residue involved in the cation–π interaction can differ. Similarly in the GABAC receptor, GABA has a cation–π interaction with a loop B Tyr residue, but in the GABAA receptor, GABA has a cation–π interaction at a Tyr on loop A. Several exogenous or synthetic agonists can also make cation–π interactions (e.g. epibatidine; Cashin et al. Reference Cashin, Petersson, Lester and Dougherty2005) but it is not essential; for example, nicotine can make a cation–π interaction at the neuronal α4β2 nAChR, but does not make a cation–π interaction at the muscle nAChR (Beene et al. Reference Beene, Brandt, Zhong, Zacharias, Lester and Dougherty2002; Xiu et al. Reference Xiu, Puskar, Shanata, Lester and Dougherty2009). These data provide an explanation for the low potency of nicotine at muscle nAChRs (and an understanding of why smoking does not cause severe muscle contractions), and also demonstrates the importance of understanding the molecular interactions when designing receptor-specific drugs. These data also highlight the problem that even with good structural information, docking a ligand into a protein may not always be accurate, and experimental data are essential to allow the correct solution to be selected from possible options.
3.2.1. Ligand binding; in silico predictions from the 5-HT3R
In silico predictions of ligand binding require either a high-resolution structure or a homology model, and the template used for the latter will determine its accuracy. To show how differing starting templates can introduce conformational variability, Fig. 4 overlays two 5-HT3 homology models that were created using similar AChBP structures containing the same bound ligand (HEPES; PDB ID's 1I9B and 1UX2). The overlay shows that the backbones closely mirror each other, but there are considerable differences in the orientations of side chains. Other starting templates that contain different bound ligands produce further variation, and if we use these for in silico docking, the positions of the side chains can have a significant impact on the final orientation of the ligand. Nevertheless, homology models have been produced for many receptors, and a range of ligands docked into their binding sites (e.g. Abdel-Halim et al. Reference Abdel-Halim, Hanrahan, Hibbs, Johnston and Chebib2008; Cromer et al. Reference Cromer, Morton and Parker2002; Le Novere et al. Reference Le Novere, Grutter and Changeux2002; Maksay et al. Reference Maksay, Bikadi and Simonyi2003; Reeves et al. Reference Reeves, Sayed, Chau, Price and Lummis2003; Schapira et al. Reference Schapira, Abagyan and Totrov2002; Trudell & Bertaccini, Reference Trudell and Bertaccini2004; Yan & White, Reference Yan and White2005). The ability of 5-HT3Rs to form homomeric receptors means that they are a relatively simple system for molecular modelling, and they have the considerable advantage that the experimental determination of the effects of amino acid substitutions on the properties of the receptor is straightforward. In the following section, this receptor is used as a model system to illustrate some of the pros and cons of in silico techniques.
An overlay of two 5-HT3 receptor homology models that were based on HEPES bound AChBP structures (PDB ID: 1I9B white and 1UX2 orange). Some residues that have been shown to be important for granisetron (a selective 5-HT3 antagonist) binding are highlighted and emphasize that some regions e.g. close to W195, have large differences in the orientation of their side chains. The relative positions of the models were compiled by Swiss-PdbViewer ‘magic fit’ using loop B as a reference point.

In silico docking of ligands can be performed using a variety of software tools. One of the most widely used and well regarded is GOLD (The Cambridge Crystallographic Data Centre, Cambridge UK), which places a ligand into the protein and then improves the fit by iteratively moving the ligand into the most energetically favourable orientation (Olsen et al. Reference Olsen, Pettersson, Hemmingsen, Adolph and Jorgensen2004a). To explore its accuracy, we determined whether GOLD could adequately locate binding sites and correctly position ligands in them by removing ligands from their original protein structures and re-docking them. Figure 5 shows the 10 predicted ligand orientations for nicotine and carbamylcholine in their original AChBP crystal structures, and in two other randomly selected structures. In each instance, the software correctly located the ligand within the receptor, although there are some subtle differences in their precise orientations.
A test for the accuracy of computational ligand docking. (A) Nicotine and carbamylcholine re-docked into their respective AChBP structures. (B) Nicotine docked into the carbamylcholine structure and vice versa. (C) Nicotine docked into two other AChBP structures. In each panel, the original ligand molecule is shown in grey and 10 docking solutions are shown in white; the ligands are clearly positioned on top of one another within the binding site.

Granisetron is a selective, competitive antagonist of 5-HT3Rs. Nuclear magnetic resonance (NMR) and crystallography studies of granisetron show that the azabicyclic of granisetron adopts a boat–chair configuration, and the carbonyl linker is relatively immobile (i.e. rigid), with a dihedral angle of 180° (Fludzinski et al. Reference Fludzinski, Evrard, Bloomquist, Lacefield, Pfeifer, Jones, Deeter and Cohen1987; Roe & Kuntz, Reference Roe and Kuntz1995; Schmidt & Peroutka, Reference Schmidt and Peroutka1989; Vernakar et al. Reference Vernekar, Hallaq, Clarkson, Thompson, Silvestri, Lummis and Lochner2010). Using this structure, we docked granisetron into a range of 5-HT3R homology models, the templates of which were the 18 currently available AChBP, nACh and prokaryotic receptor structures (Tables 2 and 3). We have used a flexible ligand (non-constrained bond angles) and a rigid ligand (constrained bond angles), and the tables show the additional variability that is introduced by altering the flexibility of the ligand. A comparison of the results shows that granisetron is located in broadly similar locations in the binding pockets, although the predicted orientations differ (Fig. 6). Flexible (Table 2) and rigid (Table 3) ligand docking generated eight and five categories of potential ligand orientations, respectively. Rigid docking increased the incidence of granisetron being placed outside the binding site (described as others); docking errors may be responsible, although some locations may represent local energy minima within the binding and unbinding routes, as previously suggested (Joshi et al. Reference Joshi, Suryanarayanan, Hazai, Schulte, Maksay and Bikadi2006; Maksay et al. Reference Maksay, Bikadi and Simonyi2003; Thompson et al. Reference Thompson, Chau, Chan and Lummis2006a; Zhang et al. Reference Zhang, Gullingsrud and Mccammon2006).
Examples of the eight main categories of docked poses found in the 320 homology models generated for this study. Categories were largely based on the proximity of granisetron atoms to W183, and the orientation of the azabicyclic and indazole rings. The number of docked poses that fell into each of these categories can be seen in Tables 2 and 3. In brief, the descriptions of these clusters are as follows: (A1) Indazole ring close to W183 and the azabicyclic ring orientated towards the membrane. (A2) Same as A1, but with the azabicyclic and indazole rings reversed. (B1) Indazole ring close to W183 and the azabicyclic ring orientated towards Y143 in loop E. (B2) Same as B1, but with the azabicyclic and indazole rings reversed. (C1) Carbonyl linker close to W183 and the azabicyclic ring orientated away from the membrane. (C2) Same as (C1), but with the indazole ring orientated away from the membrane. (D) Either the azabicyclic or indazole rings close to W183 and the opposite end of the ligand orientated towards loop C. (E) Granisetron lies horizontally across the back of loop C. (Other) A number of unique positions located throughout the ECD.

Flexible ligand docking of granisetron into the 5-HT3 receptor-binding site produces docked clusters that can be categorized into one of eight groups (A1–E). Docking solutions that place granisetron outside the binding site are described as others. The data were created using the boat-chair configuration of granisetron docked into a series of 5-HT3 homology models that were generated from the 18 currently available PDB templates that show homology to Cys-loop receptors. The protein sequence of the murine 5-HT3 receptor (accession number: Q6J1J7) was co-aligned with each of the template sequences using FUGUE, which takes into account secondary structures (Shi et al. Reference Shi, Blundell and Mizuguchi2001). Using Modeller 6v2, five homology models were generated from each PDB template (Sali & Blundell, Reference Sali and Blundell1993), and the best model selected using Ramachandran plot analysis. The protonated form of granisetron was constructed in Chem3D Ultra 7.0 (CambridgeSoft, Cambridge, UK) based on the crystal structure of a related indazole carboxamide (Cambridge Structural Database; reference code FIZXUH) and docked with GOLD v3.0 (The Cambridge Crystallographic Data Centre, Cambridge, UK), into a binding site that was defined as being within 20 Å of the α-carbon of W183. To dock ligands, 10 genetic algorithm runs were carried out for each homology model, with a population size of 50 and the maximum number of generations set to 27 000. For each homology model, the 10 docking solutions were categorized according to the ligand orientation, and the number of solutions in each category are shown (see Fig. 6 legend for descriptions)

Rigid ligand docking of granisetron into the 5-HT3 receptor binding site produces docked clusters which can be categorized into one of five groups. Methods used can be found in the legend of Table 2

An alternative method for orientating a ligand uses a protein in which a structurally similar ligand with a common pharmacophore has been co-crystallized (Fig. 7). To predict interacting amino acids, the new ligand can be pasted into the model. This method can result in steric clashes between the ligand and receptor, but these can be minimized with the software. It must be stressed, however, that all these in silico methods only estimate the possible orientations of amino-acid side chains and docked ligands. They do nevertheless provide testable hypotheses that can be validated by experimentation.
AChBP crystal structures showing the orientations of cocaine (PDB ID: 2PGZ at 1·76 Å) and tropisetron (2WNC at 2·2 Å). The orientations are most similar to category E described in Fig. 6.

3.2.2. Ligand binding; experimental evidence for the 5-HT3R in silico predictions
The two methods (flexible and rigid docking) produced in total eight distinct categories (or clusters) of ligand orientations (see Fig. 6), with, for example, 26 and 38 poses respectively in the orientation B2. This places granisetron with the azabicyclic rings between W183 and Y234, and the indazole ring towards loop E. Orientation A2 is the total most common (46 and 24 poses, respectively) and has more interactions with residues that have been identified as important in the 5-HT3R binding site (Joshi et al. Reference Joshi, Suryanarayanan, Hazai, Schulte, Maksay and Bikadi2006; Thompson et al. Reference Thompson, Price, Reeves, Chan, Chau and Lummis2005). The orientation that is best supported by the experimental evidence, however, is A1, where the orientation of granisetron is reversed so that the indazole ring is located between W183 and Y234 with the azabicyclic ring orientated towards the transmembrane region, between residues E129 and W90. Double-mutant cycle analysis shows that the azabicyclic ring of granisetron is close to W90 and the indazole ring is orientated away from the membrane (Yan & White, Reference Yan and White2005), and this orientation is also supported by experimental evidence as described by both Joshi et al. (Reference Joshi, Suryanarayanan, Hazai, Schulte, Maksay and Bikadi2006) and Thompson et al. (Reference Thompson, Price, Reeves, Chan, Chau and Lummis2005). In both orientations A1 and A2, there is an interaction with W183, a residue that is important for both agonist and antagonist binding (Beene et al. Reference Beene, Brandt, Zhong, Zacharias, Lester and Dougherty2002; Spier & Lummis, Reference Spier and Lummis2000), and with Y234, which also contributes to the binding site; substitutions of Y234 to Ala or Ser severely compromise granisetron binding, although Y234F mutants have similar binding affinities to wild-type receptors (Spier & Lummis, Reference Spier and Lummis2000; Suryanarayanan et al. Reference Suryanarayanan, Joshi, Bikadi, Mani, Kulkarni, Gaines and Schulte2005). An Ala mutation at the adjacent S233 residue also abolishes binding, which may be due to its altering the location of the adjacent Y234 residue (Suryanarayanan et al. Reference Suryanarayanan, Joshi, Bikadi, Mani, Kulkarni, Gaines and Schulte2005). Mutation of both E129 and W90 strongly affect granisetron binding regardless of the amino acid used, showing that they are both essential; E129 hydrogen bonds with 5-HT, and may similarly interact with granisetron (Price et al. Reference Price, Bower, Thompson, Lester, Dougherty and Lummis2008; Spier & Lummis, Reference Spier and Lummis2000; Sullivan et al. Reference Sullivan, Thompson, Price and Lummis2006; Yan et al. Reference Yan, Schulte, Bloom and White1999), and W90 may stabilize the structure of region by a T-type interaction with Tyr234 (Gallivan & Dougherty, Reference Gallivan and Dougherty1999).
Residues that have an impact on granisetron binding are shown in Fig. 8. These include a number of residues centred around W195 and D204 in loop F. Whether the residues in loop F are directly involved in ligand binding is difficult to determine from the homology models as this region is poorly resolved in the crystal structures, and some residues may interact with adjacent β-sheets rather than with the ligand itself (Spier & Lummis, Reference Spier and Lummis2000; Thompson et al. Reference Thompson, Padgett and Lummis2006b). Loop E residues G148 and V150 have been shown to abolish ligand binding when mutated to Ala and there are also effects at residues L178, F180, Q188, D189, I190 and N191 in loop B (Joshi et al. Reference Joshi, Suryanarayanan, Hazai, Schulte, Maksay and Bikadi2006; Thompson et al. Reference Thompson, Lochner and Lummis2008; Venkataraman et al. Reference Venkataraman, Venkatachalan, Joshi, Muthalagi and Schulte2002b). As many of these are at some distance from the binding site, and some are on opposite sides of β-sheets, it is unlikely that they directly interact with the ligand; their effects may be due to intra-molecular interactions that are critical for the structure of the binding site (Thompson et al. Reference Thompson, Padgett and Lummis2006b, Reference Thompson, Lochner and Lummis2008). Some of these residues have also been implicated in the binding/unbinding pathway of the ligand, while others may contribute to the subunit interface, or be involved in the transduction of binding energy into channel opening (Joshi et al. Reference Joshi, Suryanarayanan, Hazai, Schulte, Maksay and Bikadi2006; Thompson et al. Reference Thompson, Chau, Chan and Lummis2006a).
Binding site substitutions that cause significant changes in the binding affinity of granisetron at the 5-HT3 receptor. Residues have been superimposed upon a homology model of the 5-HT3 receptor that was generated using 1I9B. The data were taken from Beene et al. (Reference Beene, Price, Lester, Dougherty and Lummis2004), Boess et al. (Reference Boess, Steward, Steele, Liu, Reid, Glencorse and Martin1997), Joshi et al. (Reference Joshi, Suryanarayanan, Hazai, Schulte, Maksay and Bikadi2006), Price et al. (Reference Price, Bower, Thompson, Lester, Dougherty and Lummis2008), Schreiter et al. (Reference Schreiter, Hovius, Costioli, Pick, Kellenberger, Schild and Vogel2003), Spier & Lummis (Reference Spier and Lummis2000), Thompson et al. (Reference Thompson, Price, Reeves, Chan, Chau and Lummis2005, Reference Thompson, Padgett and Lummis2006b, Reference Thompson, Lochner and Lummis2008), Venkataraman et al. (Reference Venkataraman, Joshi, Venkatachalan, Muthalagi, Parihar, Kirschbaum and Schulte2002a, Reference Venkataraman, Venkatachalan, Joshi, Muthalagi and Schulteb), Yan et al. (Reference Yan, Schulte, Bloom and White1999), Yan & White (Reference Yan and White2005) and Sullivan et al. (Reference Sullivan, Thompson, Price and Lummis2006).

3.2.3. Ligand binding: summary
Our docking results show a wide range of ligand orientations, highlighting the potential problem of developing theories based solely on in silico predictions. We can, however, use this information to design experiments to probe the accuracy of the predictions. For the 5-HT3R, experimental data best support the predicted orientations of granisetron and 5-HT shown in Fig. 9, which are not the most common docking solutions, but are in general agreement with structure–activity relationships (Bower et al. Reference Bower, Price, Sturdee, Dayrell, Dougherty and Lummis2008; Maksay et al. Reference Maksay, Bikadi and Simonyi2003; Reeves et al. Reference Reeves, Sayed, Chau, Price and Lummis2003; Schmidt & Peroutka, Reference Schmidt and Peroutka1989). It must also be considered that it may be possible for ligands to adopt multiple orientations. For example, molecular dynamic studies examining GABA binding to the GABACR show that GABA appears to ‘flip’ from one orientation to another during the simulation, although there is currently only experimental data to support one of the orientations (Melis et al. Reference Melis, Lummis and Molteni2008), and in silico predictions in the 5-HT3R have concluded that there are two possible orientations for both mCPBG and granisetron (Joshi et al. Reference Joshi, Suryanarayanan, Hazai, Schulte, Maksay and Bikadi2006; Schulte et al. Reference Schulte, Hill, Bikadi, Maksay, Parihar, Joshi, Suryanarayanan and Arias2006).
Preferred orientations for 5-HT and granisetron docked into a homology model of the 5-HT3 receptor binding site. Both orientations provide the best fit for the experimental data. The ligands can potentially interact with W183, are influenced by a range of aromatic residues that are orientated with their π-rings normal to the ligand, and have critical hydrogen bonds interactions with E129. See text for more details.

Comprehensive reports can be found elsewhere on the binding sites of 5-HT3 (Schulte et al. Reference Schulte, Hill, Bikadi, Maksay, Parihar, Joshi, Suryanarayanan and Arias2006; Thompson & Lummis, Reference Thompson and Lummis2006), nACh (Romanelli et al. Reference Romanelli, Gratteri, Guandalini, Martini, Bonaccini and Gualtieri2007), Gly (Lynch, Reference Lynch2004) and GABA receptors (Abdel-Halim et al. Reference Abdel-Halim, Hanrahan, Hibbs, Johnston and Chebib2008; Huang et al. Reference Huang, Gonzales, Dillon and Arias2006; Korpi et al. Reference Korpi, Grunder and Luddens2002; Sedelnikova et al. Reference Sedelnikova, Smith, Zakharkin, Davis, Weiss and Chang2005).
3.3. Allosteric modulation
Cys-loop receptors are allosteric proteins, but they themselves are also subject to allosteric modulation by a wide range of organic and inorganic substances (Changeux et al. Reference Changeux, Devillers-Thiery and Chemouilli1984). Some of these substances occur endogenously and may reinforce or attenuate the natural response under physiological conditions, but, given the central importance of Cys-loop receptors in the nervous system and neurological disorders, it is not surprising that some synthetic receptor modulators are widely used potent and effective drugs, such as the benzodiazepines, which act at GABAA receptors. We will not attempt to describe the effects of all of these modulators, but will briefly describe some examples to give an indication of the diversity of compounds and the range of studies being undertaken to understand their mechanisms of action. Further information can be obtained from the following reviews for GABAA (Huang et al. Reference Huang, Gonzales, Dillon and Arias2006; Olsen et al. Reference Olsen and Sieghart2004b), Gly (Hawthorne & Lynch, Reference Hawthorne, Lynch and Arias2006; Lynch, Reference Lynch2004, Reference Lynch2009), nACh (Faghih et al. Reference Faghih, Gopalakrishnan and Briggs2008; Arias & Bouzat, Reference Lynch2006) and 5-HT3 receptors (Reeves & Lummis, Reference Reeves and Lummis2002).
3.3.1. Ions as modulators
Receptors in the Cys-loop family can be significantly affected by physiologically relevant ions such as calcium, magnesium and zinc. The effects of these ions vary according to the receptor type and subunit composition. For example, in the α7 nAChR, these cations potentiate responses, while 5-HT3R responses are typically reduced (Brown et al. Reference Brown, Hope, Lambert and Peters1998; Hu & Lovinger, Reference Hu and Lovinger2005; Hubbard & Lummis, Reference Hubbard and Lummis2000; Niemeyer & Lummis, Reference Niemeyer and Lummis2001; Thompson & Lummis, Reference Thompson and Lummis2008a). Ion-binding sites in many Cys-loop receptors have been identified in the channel (Bertrand et al. Reference Bertrand, Galzi, Devillers-Thiery, Bertrand and Changeux1993; Eddins et al. Reference Eddins, Lyford, Lee, Desai and Rosenberg2002a, Reference Eddins, Sproul, Lyford, Mclaughlin and Rosenberg2002b; Gill et al. Reference Gill, Peters and Lambert1995; Hu & Lovinger, Reference Hu and Lovinger2005; Livesey et al. Reference Livesey, Cooper, Deeb, Carland, Kozuska, Hales, Lambert and Peters2008; Niemeyer & Lummis, Reference Niemeyer and Lummis2001; Noam et al. Reference Noam, Wadman and Van Hooft2008; Quirk et al. Reference Quirk, Rao, Roth and Siegel2004; Thompson & Lummis, Reference Thompson and Lummis2008a; Van Hooft & Wadman, Reference Van Hooft and Wadman2003), but there are also binding sites in other regions of these proteins. A specific binding site for calcium, for example, has been identified in the ECD of the α7 nACh (Galzi et al. Reference Galzi, Bertrand, Corringer, Changeux and Bertrand1996), and insertion of this region into the 5-HT3R results in an enhancement of the 5-HT-induced response. This region coincides with residues that have been shown to bind Ca2+ in AChBP (Brejc et al. Reference Brejc, Van Dijk, Klaassen, Schuurmans, Van Der Oost, Smit and Sixma2001). Zinc-binding sites have been located at subunit interfaces in nAChR and GlyR (Hsiao et al. Reference Hsiao, Mihalak, Repicky, Everhart, Mederos, Malhotra and Luetje2006; Nevin et al. Reference Nevin, Cromer, Haddrill, Morton, Parker and Lynch2003), while in GABAA receptors, zinc binds to both the ECD and the pore (Dunne et al. Reference Dunne, Hosie, Wooltorton, Duguid, Harvey, Moss, Harvey and Smart2002; Fisher & Macdonald, Reference Fisher and Macdonald1998; Fisher, Reference Fisher2002; Horenstein & Akabas, Reference Horenstein and Akabas1998; Hosie et al. Reference Hosie, Dunne, Harvey and Smart2003). Binding of these ions is likely to have important physiological consequences although these are not yet fully understood. In the GABAA receptor, for example, sensitivity to zinc changes with the onset of epilepsy (Kapur & Macdonald, Reference Kapur and Macdonald1997), an effect that has been genetically linked to a mutation within the M2 region of the GABAA γ2 subunit (Baulac et al. Reference Baulac, Huberfeld, Gourfinkel-An, Mitropoulou, Beranger, Prud'Homme, Baulac, Brice, Bruzzone and Leguern2001).
3.3.2. Benzodiazepines
Benzodiazepines are an important class of therapeutic compounds that modulate GABAA receptors by binding at the α-γ subunit interface (Olsen & Sieghart, Reference Olsen, Chang, Li, Hanchar and Wallner2009). Differences in the pharmacological profiles of different α- and γ-subunit subtypes have enabled the identification of amino-acid residues that are involved in benzodiazepine binding. For example, α1-His102 directly interacts with flunitrazepam and diazepam (Berezhnoy et al. Reference Berezhnoy, Nyfeler, Gonthier, Schwob, Goeldner and Sigel2004; McKernan et al. Reference Mckernan, Farrar, Collins, Emms, Asuni, Quirk and Broughton1998; Tan et al. Reference Tan, Baur, Gonthier, Goeldner and Sigel2007), while α1-Tyr160, α1-Tyr210 (Amin et al. Reference Amin, Brooks-Kayal and Weiss1997) and γ2-Phe77 (Buhr et al. Reference Buhr, Baur and Sigel1997a) form part of the aromatic-binding site for benzodiazepines. Residues α1-Thr206, α1-Glu209, α1-Tyr162, α1-Thr207, γ2-Tyr58, γ2-Ala79, γ2-Met130 and γ2-Thr142 contribute to benzodiazepine selectivity and efficacy (Buhr & Sigel, Reference Buhr and Sigel1997; Buhr et al. Reference Buhr, Baur and Sigel1997a, Reference Buhr, Schaerer, Baur and Sigel1997b; Kucken et al. Reference Kucken, Wagner, Ward, Teissere, Boileau and Czajkowski2000; Mihic et al. Reference Mihic, Whiting, Klein, Wafford and Harris1994; Sigel & Buhr, Reference Sigel and Buhr1997; Teissere & Czajkowski, Reference Teissere and Czajkowski2001).
The mechanisms that communicate conformational changes between the GABA- and benzodiazepine-binding sites are less well understood. Mutations in loop F of the γ2 subunit do not change the binding affinity of benzodiazepines or the agonist response, but decrease potentiation, indicating that this region may be involved in telegraphing the modulatory behaviour to other areas of the receptor (Hanson & Czajkowski, Reference Hanson and Czajkowski2008; Padgett & Lummis, Reference Padgett and Lummis2008). Other regions of the protein are also probably involved, including the β10 sheet of the ECD (see Fig. 3), and residues in M1, M2 and the M2–M3 loop (Boileau & Czajkowski, Reference Boileau and Czajkowski1999; Jones-Davis et al. Reference Jones-Davis, Song, Gallagher and Macdonald2005). Further reading on benzodiazepines can be found in Olsen & Sieghart (Reference Olsen, Chang, Li, Hanchar and Wallner2009), Rudolph et al. (Reference Rudolph, Crestani and Mohler2001) and Sigel (Reference Sigel2002) .
3.3.3. Alcohols and anaesthetics
A wide range of alcohols and anaesthetics modulate Cys-loop receptor function, and their behaviours are mostly mediated via interactions with the TMD (Arias & Bhumireddy, Reference Arias and Bhumireddy2005; Hawthorne & Lynch, Reference Hawthorne, Lynch and Arias2006; Huang et al. Reference Huang, Gonzales, Dillon and Arias2006; Sessoms-Sikes et al. Reference Sessoms-Sikes, Hamilton, Liu, Lovinger and Machu2003). Effects of these compounds vary according to the receptor type, subunit composition, and the nature and concentration of compound being used. For example, long n-alkanols and anaesthetics are inhibitory at nAChRs, but ethanol is potentiating at low concentrations (Zuo et al. Reference Zuo, Kuryatov, Lindstrom, Yeh and Narahashi2002), while 5-HT3Rs are potentiated and inhibited depending upon the alcohol or anaesthetic (e.g. Machu & Harris, Reference Machu and Harris1994; Suzuki et al. Reference Suzuki, Koyama, Sugimoto, Uchida and Mashimo2002; Zhang et al. Reference Zhang, Oz, Stewart, Peoples and Weight1997). Other examples include α4β2 nAChRs, which are sensitive to the anaesthetics isoflurane and propofol, and αβγδ nACh and α7 nAChRs which are not (Flood et al. Reference Flood, Ramirez-Latorre and Role1997; Violet et al. Reference Violet, Downie, Nakisa, Lieb and Franks1997). There are many other examples, and there are excellent reviews on this subject by Arias & Bhumireddy (Reference Arias and Bhumireddy2005), Urban et al. (Reference Urban, Bleckwenn and Barann2006) and Yamakura et al. (Reference Yamakura, Bertaccini, Trudell and Harris2001).
3.3.4. Ivermectin – a commercially important modulator of invertebrate GluCl receptors
Ivermectin, a macrocyclic lactone produced by bacteria, is the world's largest-selling veterinary drug, and has also largely eradicated ‘river blindness’ resulting from nematode infections in sub-Saharan Africa. Ivermectin, its avermectin analogues and the milbemycins are probably allosteric potentiators of invertebrate GluCl channels at submicromolar concentrations (Vassilatis et al. Reference Vassilatis, Arena, Plasterk, Wilkinson, Schaeffer, Cully and Van Der Ploeg1997). These heteromultimeric channels, found in several invertebrate phyla, are homologous to vertebrate GlyR (and slightly less so to GABAA receptors).
We know little about the binding site for ivermectin, but because the GluCl channels resemble other Cys-loop receptors, it is certain that the GluClβ subunit carries the principal-binding site. The GluClβ Tyr182 residue aligns with the loop B cation–π residues: Trp of the nAChR, Trp of the 5-HT3R and (probably most similar) Phe of the GlyR (see Table 1). Substitutions to several other residues at this position abolish the responses to both glutamate and ivermectin. However, the GluClβ-Y182F mutation decreases the maximal glutamate response by ~6-fold, without changing the ivermectin response (Li et al. Reference Li, Slimko and Lester2002). This is evidence that the binding sites for glutamate and IVM do not overlap. Twenty other mutations were studied in the β-subunit ECD; none preserved glutamate sensitivity while abolishing ivermectin sensitivity (Li et al. Reference Li, Slimko and Lester2002). Therefore, we cannot say where ivermectin binds to GluCl channels.
GlyR are also activated by ivermectin, but are ~1000-fold less sensitive (Shan et al. Reference Shan, Haddrill and Lynch2001), suggesting that ivermectin may act differently on GlyR. Nevertheless, several GlyR-binding site mutations abolish glycine but not ivermectin sensitivity, supporting the idea that the agonist and ivermectin sites do not overlap (Shan et al. Reference Shan, Haddrill and Lynch2001). Also supporting the idea that ivermectin binds at a non-agonist site, voltage-clamp fluorometry established that the 19′ residue near the top of M2 changes its environment when the channel is opened by all agonists but not when opened by ivermectin (Pless et al. Reference Pless, Dibas, Lester and Lynch2007).
A mystery associated with ivermectin is its very low reversibility, which vitiates concentration-response experiments. Ivermectin effects take >8 h to wash out and this lower limit could actually be governed by a synthesis of new receptors (Slimko et al. Reference Slimko, Mckinney, Anderson, Davidson and Lester2002). The most appropriate experiments show that GluCl channels are half-activated by ivermectin during a 1 nM puff lasting several seconds (Slimko & Lester, Reference Slimko and Lester2003). In unpublished experiments (HAL lab), hypersensitive nAChR mutants with comparably low EC50 values show washout time constants of several minutes; therefore, simple high affinity does not explain the long washout times for ivermectin at GluCl channels. An unnatural Pro substitute in the M2–M3 linker of 5-HT3Rs produces an apparently irreversible activation (Lummis et al. Reference Lummis, Beene, Lee, Lester, Broadhurst and Dougherty2005b) with an EC50 of 20 nM, and may represent a good analogy to the action of ivermectin. Further comments on ivermectin can be found in sections 3.3.5 and 7.5.
3.3.5. α7 nACh receptor allosteric modulators
Among the nAChRs, the α7 nAChR has received recent attention as a target for allosteric activators (Bertrand et al. Reference Bertrand, Bertrand, Cassar, Gubbins, Li and Gopalakrishnan2008; Hogg & Bertrand, Reference Hogg and Bertrand2007). Potent positive allosteric modulators include NS-1738, 4-naphthalene-1-yl-3a,4,5,9b-tetrahydro-3-H-cyclopenta[c]quinoline-8-sulfonic acid amide (TQS), PNU-120596, N-(4-chlorophenyl)-α-[[(4-chloro-phenyl)amino] methylene]-3-methyl-5-isoxazoleacet-amide (‘compound 6’; Ng et al. Reference Ng, Whittemore, Tran, Hogenkamp, Broide, Johnstone, Zheng, Stevens and Gee2007), LY-2087101(Broad et al. Reference Broad, Zwart, Pearson, Lee, Wallace, Mcphie, Emkey, Hollinshead, Dell, Baker and Sher2006) and galanthamine (Lopes et al. Reference Lopes, Pereira, Wu, Purushottamachar, Njar, Schwarcz and Albuquerque2007); these act at concentrations ⩽10 μm. TQS and PNU-120596, but not NS1738, have the property that they either reactivate desensitized receptors and/or significantly retard desensitization, properties that are also shared by ivermectin at GlyR (Gronlien et al. Reference Gronlien, Hakerud, Ween, Thorin-Hagene, Briggs, Gopalakrishnan and Malysz2007). However, according to results from α7/5-HT3 chimeras, NS-1738 and PNU-12059 bind at different sites. The ECD of the α7 nAChR is required for NS-1738 action, and the ECD in combination with the M2–M3 linker of the α7 nAChR are required for agonist-independent activity in the presence of NS-1738 (Bertrand et al. Reference Bertrand, Bertrand, Cassar, Gubbins, Li and Gopalakrishnan2008). In contrast, the entire TMD of the α7 nAChR is required for allosteric modulation by PNU-12059 (Bertrand et al. Reference Bertrand, Bertrand, Cassar, Gubbins, Li and Gopalakrishnan2008).
4. The TMD
4.1. Structure
A range of experimental techniques show that the TMD is composed of four membrane spanning α-helices (M1–M4) from each subunit; each receptor therefore has 20 such α-helices within the membrane (Fig. 10). The α-helical nature of these regions, which was originally inferred from hydropathy plots (Noda et al. Reference Noda, Takahashi, Tanabe, Toyosato, Furutani, Hirose, Asai, Inayama, Miyata and Numa1982), was verified in the nAChR by photolabelling (Blanton & Cohen, Reference Blanton and Cohen1994), two-dimensional 1H-NMR spectroscopy (Lugovskoy et al. Reference Lugovskoy, Maslennikov, Utkin, Tsetlin, Cohen and Arseniev1998), Fourier transform infrared (FTIR) spectroscopy (Baenziger & Methot, Reference Baenziger and Methot1995; Corbin et al. Reference Corbin, Methot, Wang, Baenziger and Blanton1998; Görne-Tschelnokow et al. Reference Görne-Tschelnokow, Strecker, Kaduk, Naumann and Hucho1994; Methot et al. Reference Methot, Mccarthy and Baenziger1994) and mutagenesis (e.g. Tamamizu et al. Reference Tamamizu, Guzman, Santiago, Rojas, Mcnamee and Lasalde-Dominicci2000). The best available structural information comes from 4 Å resolution cryo-electron microscopy images of the nAChR (Miyazawa et al. Reference Miyazawa, Fujiyoshi and Unwin2003); higher-resolution structures from related prokaryotic receptors have been solved, but it is not yet clear how representative these are of vertebrate Cys-loop receptors (Bocquet et al. Reference Bocquet, Nury, Baaden, Le Poupon, Changeux, Delarue and Corringer2009; Hilf & Dutzler, Reference Hilf and Dutzler2008; Nury et al. Reference Nury, Bocquet, Le Poupon, Raynal, Haouz, Corringer and Delarue2009). The 4 Å nAChR images show that α-helices from each subunit are arranged symmetrically, forming an inner ring of M2 helices that line the central pore, and an outer ring composed of M1, M3 and M4 that shields the inner ring from the lipid environment (De Planque et al. Reference De Planque, Rijkers, Liskamp and Separovic2004; Miyazawa et al. Reference Miyazawa, Fujiyoshi and Unwin2003). On the extracellular side, the transmembrane helices are spread apart, but gather together as they cross the membrane towards the intracellular side (Goren et al. Reference Goren, Reeves and Akabas2004; Miyazawa et al. Reference Miyazawa, Fujiyoshi and Unwin2003; Panicker et al. Reference Panicker, Cruz, Arrabit and Slesinger2002). Overlaying electron densities of subunits in the resting state reveals that M1, M2 and M3 have precise positioning within the structure while the location of M4 is more relaxed, particularly at its C-terminus. A review of pore structures can be found in Absalom et al. (Reference Absalom, Schofield and Lewis2009).
Comparisons of TMDs from open and closed receptors. Top panel: structures of nAChR (closed; Miyazawa et al. Reference Miyazawa, Fujiyoshi and Unwin2003; PDB ID: 2BG9), ELIC (closed; Hilf & Dutzler, Reference Hilf and Dutzler2008; PDB ID: 2VL0) and GLIC (open; Bocquet et al. Reference Bocquet, Prado De Carvalho, Cartaud, Neyton, Le Poupon, Taly, Grutter, Changeux and Corringer2007; PDB ID: 3EAM) are shown. Two (red and blue) of the five subunits are highlighted. M2 lines the central pore, and residues that face this water accessible surface are shown in Fig. 11. Lower panels: pore diameter as calculated by HOLE, with a 15 Å cut-off to find the ends of the pores (Smart et al. Reference Smart, Goodfellow and Wallace1993). Each tick on the vertical axis is 25 Å. The nAChR pore appears longer, because the structure also contains part of the ICD.

4.2. M1 and the M1–M2 loop
M1 forms part of the outer ring that is in contact with the lipid environment and may also contact M2. Mutations in M1 have been shown to produce receptors that have altered desensitization, changes in EC50 or are non-functional (Akabas & Karlin, Reference Akabas and Karlin1995; Bianchi et al. Reference Bianchi, Haas and Macdonald2001; Dang et al. Reference Dang, England, Farivar, Dougherty and Lester2000; Engblom et al. Reference Engblom, Carlson, Olsen, Schousboe and Kristiansen2002; England et al. Reference England, Zhang, Dougherty and Lester1999; Greenfield et al. Reference Greenfield, Zaman, Sutherland, Lummis, Niemeyer, Barnard and Macdonald2002; Lobitz et al. Reference Lobitz, Gisselmann, Hatt and Wetzel2001; Lobo et al. Reference Lobo, Mascia, Trudell and Harris2004; Spitzmaul et al. Reference Spitzmaul, Corradi and Bouzat2004; Zhang & Karlin, Reference Zhang and Karlin1997). M1 may therefore be a structural element involved in transmitting movement of the ligand-bound ECD into M2, possibly through direct interactions with the M2 helix following activation (Unwin et al. Reference Unwin, Miyazawa, Li and Fujiyoshi2002). Indeed, some of the roles of specific residues that contribute to this activity are beginning to emerge. For example, the highly conserved proline residue in the centre of M1 has been shown to be critical due to its lack of ability to act as a hydrogen bond donor (Dang et al. Reference Dang, England, Farivar, Dougherty and Lester2000), and may permit M2 to transiently alter its position upon channel activation. Recent experiments introducing ionizable side chains into M1 revealed the current response is reduced 25–50% by protonation at any of five α-helically spaced M1 side-chains, suggesting M1 is not completely shielded from the channel axis by M2. The data also show that the side chains closest to the axis in the open state are also those closest in the cryo-electron microscopy studies, revealing that M1 moves little, or may not move at all, between the open and closed states (Cymes & Grosman, Reference Cymes and Grosman2008; Miyazawa et al. Reference Miyazawa, Fujiyoshi and Unwin2003).
There is evidence that the region that links M1 with the ECD is an important functional element involved in the gating process. Mutations at the extracellular end of the 5-HT3R (R222, Hu et al. Reference Hu, Zhang, Stewart and Weight2003), GlyR (R218, Castaldo et al. Reference Castaldo, Stefanoni, Miceli, Coppola, Del Giudice, Bellini, Pascotto, Trudell, Harrison, Annunziato and Taglialatela2004), GABAAR (K215, Kash et al. Reference Dahan, Dibas, Petersson, Auyeung, Chanda, Bezanilla, Dougherty and Lester2004) and nAChR (several residues, Zhang & Karlin, Reference Zhang and Karlin1997) have been shown to effect receptor gating. The other end of M1 may form part of the intracellular mass that lies at the cytoplasmic face of the pore. Evidence from SCAM has indicated that the intracellular end of M1 and the M1–M2 linker lie along the path of the permeating ions, and these regions contain residues responsible for anion/cation selectivity (Filippova et al. Reference Filippova, Wotring and Weiss2004; also see section 4.4). Coordination of cadmium ions in 5-HT3R Cys mutants and the use of negatively and positively charged thiol reactive MTS reagents have demonstrated that residues in the M1–M2 loop are accessible (Panicker et al. Reference Panicker, Cruz, Arrabit and Slesinger2002, Reference Panicker, Cruz, Arrabit, Suen and Slesinger2004).
4.3. M2 lines the channel pore and acts as the channel gate
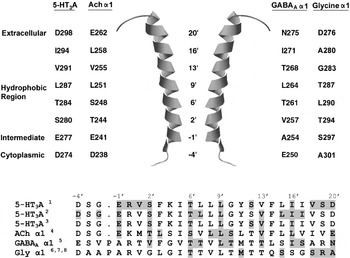
A great number of experiments over many years have shown that the residues in M2 line the channel pore and M2 is an α-helix. In particular, substituting cysteine, histidine, lysine or arginine residues into M2 has revealed water-accessible pore lining residues that have a periodicity consistent with an α-helical conformation (Akabas et al. Reference Akabas, Kaufmann, Archdeacon and Karlin1994; Cymes et al. Reference Cymes, Ni and Grosman2005; Reeves et al. Reference Reeves, Goren, Akabas and Lummis2001; Xu & Akabas, Reference Xu and Akabas1996; Zhang & Karlin, Reference Zhang and Karlin1998). Structural data from cryo-electron microscopy indicate that M2 is ~40 Å long and extends beyond the embrace of the lipid environment (Bachy et al. Reference Bachy, Heaulme, Giudice, Michaud, Lefevre, Souilhac, Manara, Emerit, Gozlan, Hamon, Keane, Soubrie and Lefure1993; Miyazawa et al. Reference Miyazawa, Fujiyoshi and Unwin2003). These data also show that within the limits of the membrane the M2 helices tilt radially towards the centre of the pore until they reach residues 6′–9′, a region that is considered to be the channel gate (Fig. 10). This is consistent with earlier studies that showed the binding site for the open-channel blocker QX-222 was located at the region between 6′ and 10′ of the nAChR, and suggested that the open channel tapered to its narrowest point just below 6′ (Charnet et al. Reference Charnet, Labarca, Leonard, Vogelaar, Czyzyk, Gouin, Davidson and Lester1990; Leonard et al. Reference Leonard, Labarca, Charnet, Davidson and Lester1988).
The centre of the pore coincides with a conserved collar of hydrophobic side chains; in the nAChR α1 subunit this includes Leu251, Val255 and Leu258 (Figs 1, 2, 10 and 11). Five symmetrically placed M2 helices from each of the five subunits create a hydrophobic region that is 3 Å at its narrowest and less than 3·5 Å over a distance of approximately 8 Å in the closed state, and has been referred to as a hydrophobic girdle (Miyazawa et al. Reference Miyazawa, Fujiyoshi and Unwin2003). Ion permeabilities suggest that the diameter of the open channel is between 7·4 Å and 8·4 Å for cation channels and between 5·2 Å and 6·2 Å for anion channels (Brown et al. Reference Brown, Hope, Lambert and Peters1998; Cohen et al. Reference Cohen, Labarca, Davidson and Lester1992; Fatima-Shad & Barry, Reference Fatima-Shad and Barry1993; Rundstrom et al. Reference Rundstrom, Schmieden, Betz, Bormann and Langosch1994; Wang & Imoto, Reference Wang and Imoto1992). Originally, the channel gate was predicted to be close to the cytoplasmic end of M2 (Wilson & Karlin, Reference Wilson and Karlin1998; Wilson et al. Reference Wilson, Pascual, Brooijmans, Murray and Karlin2000). This conclusion was supported by data from applying thiol reactive compounds in the closed or open state of the receptor, but the results were limited as channels may spontaneously open, modifying reaction rates can vary in the presence and absence of agonist and some of the modifying reagents may be small enough to pass the closed gate (Bali & Akabas, Reference Bali and Akabas2007; Tikhonov et al. Reference Tikhonov, Mellor and Usherwood2004; Wilson & Karlin, Reference Wilson and Karlin2001). It is now widely accepted that the gate is located in the centre of the channel. This constricted region shares structural similarities to the gate of other membrane-permeable channels which are also occluded by a narrow hydrophobic region (Chang et al. Reference Chang, Spencer, Lee, Barclay and Rees1998), and represents the only obstruction within the channel that provides an energetic barrier to ion permeation (Beckstein et al. Reference Beckstein, Biggin and Sansom2001; Hummer et al. Reference Hummer, Rasaiah and Noworyta2001).
M2 channel lining residues in different Cys-loop receptors. Pore-lining residues are shown next to the M2 α-helix (taken from the nAChR structure; PDB ID: 1oed). To allow for comparisons between M2 residues of different Cys-loop receptors, a prime (‘) notation is used: residues are assigned numbers according to their position relative to a charged M2 residue that is conserved in Cys-loop receptors. Residues that are accessible to modification are highlighted : 1Kaneez & White (Reference Kaneez and White2004), 2Reeves et al. (Reference Reeves, Goren, Akabas and Lummis2001), 3Panicker et al. (Reference Panicker, Cruz, Arrabit and Slesinger2002), 4Akabas et al. (Reference Akabas, Kaufmann, Archdeacon and Karlin1994), 5Xu & Akabas (Reference Xu and Akabas1996), 6Shan et al. (Reference Shan, Haddrill and Lynch2002), 7Lynch et al. (Reference Lynch, Han, Haddrill, Pierce and Schofield2001) and 8Lobo et al. (Reference Lobo, Mascia, Trudell and Harris2004). Accession numbers for the sequence alignment are: Mouse 5-HT3A, Q6J1J7; Electric Ray ACh α1, P02710; Human GABAA, α1 P14867; Human Gly α1, P23414.
4.4. M2 and ion selectivity
The residues that line the ion-accessible inner face of the channel are predominantly non-polar except for rings of charged amino acids (Figs 1 and 11) (Akabas et al. Reference Akabas, Stauffer, Xu and Karlin1992, Reference Akabas, Kaufmann, Archdeacon and Karlin1994; Panicker et al. Reference Panicker, Cruz, Arrabit and Slesinger2002; Reeves et al. Reference Reeves, Goren, Akabas and Lummis2001; Xu & Akabas, Reference Xu and Akabas1993; Xu et al. Reference Xu, Covey and Akabas1995; Zhang & Karlin, Reference Zhang and Karlin1998). Initially, Konno et al. (Reference Konno, Busch, Von Kitzing, Imoto, Wang, Nakai, Mishina, Numa and Sakmann1991) reported that the three rings of charged amino acids (referred to as extracellular, intermediate and cytoplasmic rings) in the nAChR M2 region were responsible for ion selectivity, with the intermediate ring exerting the strongest influence (Fig. 11). The mechanisms of charge selectivity were later evaluated by substituting M2 residues of the α7 nAChR with the corresponding residues from Gly α1 (Galzi et al. Reference Galzi, Devillers-Thiery, Hussy, Bertrand, Changeux and Bertrand1992). As the number of mutations was gradually reduced, the smallest number of residues required to reverse ion selectivity was found to be valine to threonine (V251T or V9′T), neutralization of a glutamate (E237A or E-1′A) and the insertion of a proline (P236 or P-2′) in the M1–M2 loop. Homologous changes also alter ion selectivity in the 5-HT3 (Gunthorpe & Lummis, Reference Gunthorpe and Lummis2001; Thompson & Lummis, Reference Thompson and Lummis2003), MOD-1 (Menard et al. Reference Menard, Horvitz and Cannon2005), GABA ρ (Carland et al. Reference Carland, Moorhouse, Barry, Johnston and Chebib2004; Wotring et al. Reference Wotring, Miller and Weiss2003), GABAA (Jensen et al. Reference Jensen, Timmermann, Johansen, Schousboe, Varming and Ahring2002, Reference Jensen, Pedersen, Timmermann, Schousboe and Ahring2005a) and Gly α1 receptors (Keramidas et al. Reference Keramidas, Moorhouse, French, Schofield and Barry2000). The contribution of each of the three mutations was studied in more detail in the α7 nAChR, and showed that the residue at the −1′ position is the most critical (Corringer et al. Reference Corringer, Bertrand, Galzi, Devillers-Thiery, Changeux and Bertrand1999a). At this position in cationic receptors glutamate predominates, while the −1′ residue in anionic receptors is uncharged (Keramidas et al. Reference Keramidas, Moorhouse, Pierce, Schofield and Barry2002; Wotring et al. Reference Wotring, Miller and Weiss2003). In the α7 nAChR V9′ was found not to be directly involved in charge selectivity, and the effect of the Pro insertion was the result of localized structural modifications at the intracellular end of M2 (Corringer et al. Reference Corringer, Bertrand, Galzi, Devillers-Thiery, Changeux and Bertrand1999a). Indeed, in the α7 nAChR, functional anionic channels could be generated by inserting a Pro at any of the positions 234, 236 or 237, although was dependent on being accompanied by the E237A and V251T mutations. The structural importance of the Pro was further illustrated by changes in functional properties of the mutant receptors, including differences in activation, desensitization, EC50, Hill co-efficient and spontaneous channel openings (Corringer et al. Reference Corringer, Bertrand, Galzi, Devillers-Thiery, Changeux and Bertrand1999a; Wotring et al. Reference Wotring, Miller and Weiss2003). At the invertebrate GluCl receptor, charge selectivity remains unaltered in similar Pro mutants and a structural role was also concluded (Sunesen et al. Reference Sunesen, De Carvalho, Dufresne, Grailhe, Savatier-Duclert, Gibor, Peretz, Attali, Changeux and Paas2006). Further complications were presented in a study by Wotring & Weiss (Reference Wotring and Weiss2008), who also showed that the introduction of Glu residues within an eight amino-acid stretch (−2′ to 5′) of GABA ρ1 produces varied permeability ratios depending upon the location of the substitution. However, in native receptors the character of the −1′ residue is conserved across the Cys-loop family, indicating that this position is critical. Consequently, the ring of charge at the −1′ position is now universally regarded as an essential component of charge selectivity within the Cys-loop family, with other residues in the region playing some roles in some receptors.
Mutations in the 5-HT3R close to the extracellular ring of charge have also been implicated in charge selectivity (Thompson & Lummis, Reference Thompson and Lummis2003). When the 19′ residue is changed from a serine to an arginine and combined with the −1′ Glu to Ala mutation, the receptor is predominantly anion selective. Importantly, unlike the triple mutants described above, these 5-HT3R mutants do not display concomitant changes in the biophysical properties of the channel, suggesting that these data more accurately reflect the residues directly involved in ion selectivity. Neutralization of R19′ in the GlyR, however, does not alter ion selectivity when expressed in conjuncture with A1′E and P2′Δ mutations, although it does modify conductance and rectification (Keramidas et al. Reference Keramidas, Moorhouse, Pierce, Schofield and Barry2002; Moorhouse et al. Reference Moorhouse, Keramidas, Zaykin, Schofield and Barry2002). These data indicate that there are structural differences between the cation- and anion-selective receptors (also see section 4.5).
As functional receptors can be formed from different combinations of subunits (which have different amino acids lining their pores), there can be large differences in the permeation of certain ions. One of these is Ca2+, and nAChRs have a wide range of Ca2+ permeabilities (Arias, Reference Arias2006; Cens et al. Reference Cens, Nargeot and Charnet1997; Gerzanich et al. Reference Gerzanich, Wang, Kuryatov and Lindstrom1998; Livesey et al. Reference Livesey, Cooper, Deeb, Carland, Kozuska, Hales, Lambert and Peters2008; Noam et al. Reference Noam, Wadman and Van Hooft2008; Tapia et al. Reference Tapia, Kuryatov and Lindstrom2007; Vernino et al. Reference Vernino, Amador, Luetje, Patrick and Dani1992) determined primarily by the residues located at the intermediate (−1′) and extracellular (20′) rings (Bertrand et al. Reference Bertrand, Galzi, Devillers-Thiery, Bertrand and Changeux1993; Galzi et al. Reference Galzi, Devillers-Thiery, Hussy, Bertrand, Changeux and Bertrand1992; Hu & Lovinger, Reference Hu and Lovinger2005; Livesey et al. Reference Livesey, Cooper, Deeb, Carland, Kozuska, Hales, Lambert and Peters2008). For example, reduced Ca2+ conductance in (α4)2(β2)3 nAChRs compared to (α4)3(β2)2 nAChRs is a consequence of only β2, but not α4 subunits having acidic residues at their −1′ positions (Tapia et al. Reference Tapia, Kuryatov and Lindstrom2007). Such data can be extrapolated to other receptors: 5-HT3ABR have lower Ca2+ permeability than 5-HT3AR, which may be the consequence of 20′ residue being Asp and Asn in A and B subunits, respectively. Consistent with this, a D20′A substitution reduces Ca2+ permeability, as does the replacement of the adjacent R19′ with Ser (Livesey et al. Reference Livesey, Cooper, Deeb, Carland, Kozuska, Hales, Lambert and Peters2008; Thompson & Lummis, Reference Thompson and Lummis2003). Recent studies suggest that the ICD may also play a role in Ca2+ permeability as substitutions of charged residues in this region can have a major effect on Ca2+ permeability (Livesey et al. Reference Livesey, Cooper, Deeb, Carland, Kozuska, Hales, Lambert and Peters2008; Thompson & Lummis, Reference Thompson and Lummis2003). In both nAChR and 5-HT3Rs, Ca2+ binding sites have also been reported in the ECD (see section 3.3.1).
Comprehensive reviews on ion selectivity in the Cys-loop family of receptors can be found in Jensen et al. (Reference Jensen, Schousboe and Ahring2005b), Keramidas et al. (Reference Keramidas, Moorhouse, Schofield and Barry2004), Peters et al. (Reference Peters, Cooper, Carland, Livesey, Hales and Lambert2010) and Sine et al. (Reference Slimko and Lester2010) .
4.5. The M2–M3 loop
The M2–M3 loop forms part of the interface that links the ECD with the TMD, and it has a critical role in transmitting the energy of binding into channel opening (discussed further in section 6). Studies have shown that mutations in this region disrupt activation in nACh, 5-HT3, GABA and Gly receptors (Campos-Caro et al. Reference Campos-Caro, Sala, Ballesta, Vicente-Agullo, Criado and Sala1996; Deane & Lummis, Reference Deane and Lummis2001; Grosman et al. Reference Grosman, Salamone, Sine and Auerbach2000a, Reference Grosman, Zhou and Auerbach2000b; Kusama et al. Reference Kusama, Wang, Spivak and Uhl1994; Lewis et al. Reference Lewis, Sivilotti, Colquhoun, Gardiner, Schoepfer and Rees1998; Lynch et al. Reference Lynch, Rajendra, Pierce, Handford, Barry and Schofield1997; O'Shea & Harrison, Reference O'shea and Harrison2000; Rajendra et al. Reference Rajendra, Lynch, Pierce, French, Barry and Schofield1995; Rovira et al. Reference Rovira, Ballesta, Vicente-Agullo, Campos-Caro, Criado, Sala and Sala1998, Reference Rovira, Vicente-Agullo, Campos-Caro, Criado, Sala, Sala and Ballesta1999; Saul et al. Reference Saul, Kuner, Sobetzko, Brune, Hanefeld, Meinck and Becker1999; Sigel et al. Reference Sigel, Buhr and Baur1999). The structure of this loop has been examined by a range of techniques, including NMR and electron microscopy, and the data suggest that there are differences between cation- and anion-selective receptors. In the nAChR, the M2 helix extends two rings above the membrane (i.e. up to the 23′ residue), while in the GlyR, the helix terminates at the 15′ residue (Ma et al. Reference Ma, Liu, Li, Tang and Xu2005). The loop moves during receptor activation; in the Gly α1 receptor, SCAM studies reveal that all the residues within the M2–M3 region are accessible to modification, and surface accessibility increases when the receptor is activated (Bera et al. Reference Bera, Chatav and Akabas2002; Lynch et al. Reference Lynch, Han, Haddrill, Pierce and Schofield2001). Specific residues in this loop play particular roles, for example, in the 5-HT3R a cis–trans isomerization of the Pro at the apex of this loop (Pro308, P8′) can trigger channel opening (Lummis et al. Reference Lummis, Beene, Lee, Lester, Broadhurst and Dougherty2005b). While the same mechanism seems not to activate the nAChR, the equivalent proline functionally couples to flanking Val residues extending from the β1–β2 and Cys-loops, and together these regions form a critical part of the transduction pathway (Lee et al. Reference Lee, Free and Sine2008). A conserved proline within the Cys-loop has also been identified as a candidate for channel activation (Limapichat et al. Reference Limapichat, Lester and Dougherty2010). This topic is also discussed in section 6.
4.6. M3 and M4 helices
Structural data show that M3 and M4 are α-helical and shield M2 from the lipid bilayer, although there are water-accessible clefts that lie between the TMD α-helices (Miyazawa et al. Reference Miyazawa, Fujiyoshi and Unwin2003; Fig. 10). SCAM studies on the M3 segment of GABAA receptors show that in the absence of GABA, only those residues towards the extracellular side of the membrane are accessible. Activation allows modifying reagents to approach residues located closer to the centre of the M3 α-helix, as water-permeable clefts between adjacent α-helices widen as a consequence of conformational changes in M2 (Miyazawa et al. Reference Miyazawa, Fujiyoshi and Unwin2003; Wang et al. Reference Wang, Milone, Ohno, Shen, Tsujino, Batocchi, Tonali, Brengman, Engel and Sine1999; Williams & Akabas, Reference Williams and Akabas1999). The outer face of the M3 helix is in close contact with the membrane and is inaccessible to these modifying agents (Blanton & Cohen, Reference Blanton and Cohen1992, Reference Blanton and Cohen1994; Blanton et al. Reference Blanton, Mccardy, Huggins and Parikh1998). Recent nAChR experiments introduced ionizable side chains into M3 to reveal relative distance from the channel's axis, similar to the experiments performed in M1 and M2 (Cymes et al. Reference Cymes, Ni and Grosman2005). The extent of block was <40% for only five side chains, limiting the precision of the data, but was not inconsistent with the α-helical pattern and orientation of the closed state found in structural studies. M3, like M1, apparently rotates little between the closed and open states.
Given the location and apparent roles of M3 and M4, it is surprising that mutations can have significant effects on receptor function, but such mutations cause changes in both the whole-cell current (Cruz-Martin et al. Reference Cruz-Martin, Mercado, Rojas, Mcnamee and Lasalde-Dominicci2001; Guzman et al. Reference Guzman, Santiago, Ricardo, Marti-Arbona, Rojas and Lasalde-Dominicci2003; Lasalde et al. Reference Lasalde, Tamamizu, Butler, Vibat, Hung and Mcnamee1996; Williams & Akabas, Reference Williams and Akabas1999; Wu et al. Reference Wu, Othman, Sharp, Mahendra, Deeb and Hales2010) and single-channel kinetics of nAChRs and 5-HT3Rs (Bouzat et al. Reference Bouzat, Barrantes and Sine2000, Reference Bouzat, Gumilar, Del Carmen Esandi and Sine2002; Corradi et al. Reference Corradi, Gumilar and Bouzat2009; De Rosa et al. Reference De Rosa, Rayes, Spitzmaul and Bouzat2002; Lee et al. Reference Lee, Li, Lasalde, Rojas, Mcnamee, Ortiz-Miranda and Pappone1994; Navedo et al. Reference Navedo, Nieves, Rojas and Lasalde-Dominicci2004; Ortiz-Miranda et al. Reference Ortiz-Miranda, Lasalde, Pappone and Mcnamee1997; Tamamizu et al. Reference Tamamizu, Lee, Hung, Mcnamee and Lasalde-Dominicci1999, Reference Tamamizu, Guzman, Santiago, Rojas, Mcnamee and Lasalde-Dominicci2000; Wang et al. Reference Wang, Milone, Ohno, Shen, Tsujino, Batocchi, Tonali, Brengman, Engel and Sine1999). The effect of these mutations can be additive both in terms of the contribution from each subunit (Bouzat et al. Reference Bouzat, Roccamo, Garbus and Barrantes1998; De Rosa et al. Reference De Rosa, Rayes, Spitzmaul and Bouzat2002) and within the same α-helix (Lasalde et al. Reference Lasalde, Tamamizu, Butler, Vibat, Hung and Mcnamee1996), although this observation is not supported by all studies (Cruz-Martin et al. Reference Cruz-Martin, Mercado, Rojas, Mcnamee and Lasalde-Dominicci2001). M4 may also detect the lipid environment and influence the functional properties of the receptor (daCosta & Baenziger, Reference Dacosta and Baenziger2009).
These regions also influence receptor expression: the number and characteristics of C-terminal residues in M4 are critical for the expression of 5-HT3R on the cell surface (Butler et al. Reference Butler, Lindesay, Dover, Kennedy, Patchell, Levine, Hope and Barnes2009) and the expression of non-assembling receptors that contain only the ECD and M1–M3 helices can be rescued by co-expression with M4 (Haeger et al. Reference Haeger, Kuzmin, Detro-Dassen, Lang, Kilb, Tsetlin, Betz, Laube and Schmalzing2010; Villmann et al. Reference Villmann, Oertel, Ma-Hogemeier, Hollmann, Sprengel, Becker, Breitinger and Becker2009). Thus, the M3 and M4 regions are an integral part of the receptor, and have a function that extends beyond simply shielding M2 from the membrane.
5. The ICD
5.1. Structure
The structure of the ICD is unresolved apart from a single α-helix that is located in the M3–M4 loop of each subunits. Electron microscopy-derived images at 9 Å resolution show that the ICD adopts a ‘hanging-basket’-type structure with openings or ‘portals’ that are the likely site of ion entry and exit to/from the channel (Hales et al. Reference Hales, Dunlop, Deeb, Carland, Kelley, Lambert and Peters2006; Unwin, Reference Unwin1993). One side of each portal is contributed by the α-helix described above. This amphipathic α-helix was originally identified by sequence analysis many years ago and was considered to line the pore (Finer-Moore & Stroud, Reference Finer-Moore and Stroud1984; Miyazawa et al. Reference Miyazawa, Fujiyoshi, Stowell and Unwin1999). More recent studies have shown that it contributes significantly to the channel conductance in both nAChRs and 5-HT3Rs (Hales et al. Reference Hales, Dunlop, Deeb, Carland, Kelley, Lambert and Peters2006; Peters et al. Reference Peters, Hales and Lambert2005). Interestingly, homologous receptors in bacteria do not have an extended loop region between M3 and M4, which has led to experiments where this region was deleted in 5-HT3Rs and GABACRs, demonstrating that these receptors maintained most of the characteristics of the parent receptor (Bocquet et al. Reference Bocquet, Prado De Carvalho, Cartaud, Neyton, Le Poupon, Taly, Grutter, Changeux and Corringer2007; Hilf & Dutzler, Reference Hilf and Dutzler2008; Jansen et al. Reference Jansen, Bali and Akabas2008). Thus, these regions are not essential for function or expression.
5.2. Channel conductance
Studies that demonstrated a role of the M3–M4 loop in channel conductance were originally performed in the 5-HT3R, and more recently extended to nAChRs and GlyRs (Carland et al. Reference Carland, Cooper, Sugiharto, Jeong, Lewis, Barry, Peters, Lambert and Moorhouse2009; Deeb et al. Reference Deeb, Carland, Cooper, Livesey, Lambert, Peters and Hales2007; Hales et al. Reference Hales, Dunlop, Deeb, Carland, Kelley, Lambert and Peters2006; Kelley et al. Reference Kelley, Dunlop, Kirkness, Lambert and Peters2003; Livesey et al. Reference Livesey, Cooper, Deeb, Carland, Kozuska, Hales, Lambert and Peters2008; Peters et al. Reference Peters, Kelley, Dunlop, Kirkness, Hales and Lambert2004). In the 5-HT3R, A-subunits can form functional homomeric channels with a conductance <1 pS, but when combined with B-subunits receptors display a much larger conductance (9–17 pS; Brown et al. Reference Brown, Hope, Lambert and Peters1998; Davies et al. Reference Davies, Pistis, Hanna, Peters, Lambert, Hales and Kirkness1999; Derkach et al. Reference Derkach, Surprenant and North1989; Hussy et al. Reference Hussy, Lukas and Jones1994). By replacing parts of the A-subunit sequence with homologous regions from the B-subunit, Kelley et al. (Reference Kelley, Dunlop, Kirkness, Lambert and Peters2003) identified three amino acids that govern the differences between the low conductance of the homomeric receptor and the higher conductance of the heteromeric receptor, and which align with a polar stripe of residues identified by Finer-Moore & Stroud (Reference Finer-Moore and Stroud1984). Electrophysiological data support the suggestion that the charged groups line portals within the sides of the ICD, and influence the ion flux between the cytoplasm and the inner vestibule at the base of the pore (Miyazawa et al. Reference Miyazawa, Fujiyoshi, Stowell and Unwin1999; Unwin, Reference Unwin2000). As the widest region of the portals resembles the diameter of a hydrated permeant ion, they provide an explanation for the homomeric 5-HT3 channel having a much smaller unitary conductance than most nAChRs, despite their similar ionic permeabilities and very similar M2 sequences (Brown et al. Reference Brown, Hope, Lambert and Peters1998; Lambert et al. Reference Lambert, Peters, Hales and Dempster1989; Malone et al. Reference Malone, Peters and Lambert1991; Mochizuki et al. Reference Mochizuki, Watanabe, Miyake, Saito and Furuichi2000; Yakel et al. Reference Yakel, Shao and Jackson1990; Yang, Reference Yang1990). Additional studies have shown that the conductance of the channel can be dynamically altered by sulphydryl modifying reagents (Deeb et al. Reference Deeb, Carland, Cooper, Livesey, Lambert, Peters and Hales2007) and the permeability of divalent cations is also altered by mutations in this region (Livesey et al. Reference Livesey, Cooper, Deeb, Carland, Kozuska, Hales, Lambert and Peters2008). A peptide that mimics this region at GABAARs similarly modulates conductance at inside-out patches (Everitt et al. Reference Everitt, Seymour, Curmi, Laver, Gage and Tierney2009). Charged residues at this location have also been proposed to interact with phosphate groups on intracellular proteins, regulating both channel conductance and ion selectivity (Livesey et al. Reference Livesey, Cooper, Deeb, Carland, Kozuska, Hales, Lambert and Peters2008; Noam et al. Reference Noam, Wadman and Van Hooft2008).
5.3. Intracellular modulation
Interactions of proteins and ions with the M3–M4 loop of Cys-loop receptors can modulate receptor activity, assembly, targeting and trafficking (e.g. Akk & Steinbach, Reference Akk and Steinbach2000; Bouzat et al. Reference Bouzat, Bren and Sine1994; Boyd et al. Reference Boyd, Low, Dunlop, Robertson, Vardy, Lambert, Peters and Connolly2002; Melzer et al. Reference Melzer, Villmann, Becker, Harvey, Harvey, Vogel, Kluck, Kneussel and Becker2010; Yu & Hall, Reference Yu and Hall1994). Some interactions are highly specific to different subunits of different receptors, such as gephyrin that specifically targets GlyR to postsynaptic synapses, while others are more general; phosphorylation of the M3–M4 loop, for example, is linked to changes in channel behaviour in nACh, 5-HT3, GABAA and Gly receptors (Filippova et al. Reference Filippova, Sedelnikova, Zong, Fortinberry and Weiss2000; Hubbard et al. Reference Hubbard, Thompson and Lummis2000; Lankiewicz et al. Reference Lankiewicz, Huser, Heumann, Hatt and Gisselmann2000; McDonald & Moss, Reference Mcdonald and Moss1994; McDonald & Moss, Reference Mcdonald and Moss1997; Moss et al. Reference Moss, Doherty and Huganir1992, Reference Moss, Mcdonald, Rudhard and Schoepfer1996; Nishizaki & Ikeuchi, Reference Nishizaki and Ikeuchi1995; Nishizaki & Sumikawa, Reference Nishizaki and Sumikawa1998; Ruiz-Gomez et al. Reference Ruiz-Gomez, Vaello, Valdivieso and Mayor1991; Sedelnikova & Weiss, Reference Sedelnikova and Weiss2002; Vaello et al. Reference Vaello, Ruiz-Gomez, Lerma and Mayor1994; Van Hooft & Vijverberg, Reference Van Hooft and Vijverberg1995; Wecker et al. Reference Wecker, Guo, Rycerz and Edwards2001). A comprehensive series of reviews by Connolly (Reference Connolly2008), Gaimarri et al. (Reference Gaimarri, Moretti, Riganti, Zanardi, Clementi and Gotti2007), Kneussel & Loebrich (Reference Kneussel and Loebrich2007), Millar (Reference Millar2008), Millar & Harkness (Reference Millar and Harkness2008) and Sarto-Jackson & Sieghart (Reference Sarto-Jackson and Sieghart2008) cover the assembly and trafficking of nACh, 5-HT3, GABAA and Gly receptors.
A variety of kinases including casine kinase II, tyrosine kinase, protein kinase A (PKA) and protein kinase C (PKC) phosphorylate different residues with differing effects. For example, PKA phosphorylates Ser409 in the 5-HT3R causing an increase in the rate of desensitization (Coultrap and Machu, Reference Coultrap and Machu2002; Hubbard et al. Reference Hubbard, Thompson and Lummis2000; Lankiewicz et al. Reference Lankiewicz, Huser, Heumann, Hatt and Gisselmann2000; Sun et al. Reference Sun, Hu, Moradel, Weight and Zhang2003; Yakel et al. Reference Yakel, Shao and Jackson1990), while PKC actions on this receptor regulate the probability of certain conductance states (Coultrap & Machu, Reference Coultrap and Machu2002; Van Hooft & Vijverberg, Reference Van Hooft and Vijverberg1995) and rapidly increase surface expression (Emerit et al. Reference Emerit, Doucet, Darmon and Hamon2002; Grailhe et al. Reference Grailhe, De Carvalho, Paas, Le Poupon, Soudant, Bregestovski, Changeux and Corringer2004; Ilegems et al. Reference Ilegems, Pick, Deluz, Kellenberger and Vogel2004; Sun et al. Reference Sun, Hu, Moradel, Weight and Zhang2003). Other processes of post-translational modulation such as protein glycosylation and palmitoylation have also been described, but the exact roles of these processes in the regulation of receptor assembly, targeting and trafficking are not yet fully determined (e.g. Boyd et al. Reference Boyd, Low, Dunlop, Robertson, Vardy, Lambert, Peters and Connolly2002; Drisdel et al. Reference Drisdel, Manzana and Green2004; Green et al. Reference Green, Stauffer and Lummis1995).
6. Molecular basis of Cys-loop receptor activation
Binding of an agonist to its receptor causes movements of the ECD that are transduced to the M2 helices and lead to the opening of the pore (e.g. Grosman et al. Reference Grosman, Zhou and Auerbach2000b; Lee et al. Reference Lee, Free and Sine2009; Unwin et al. Reference Unwin, Miyazawa, Li and Fujiyoshi2002). In the heteromeric nAChR, this movement is initiated within the α-subunits, which undergo rotations, although several recent studies also describe movements that precede rotation (Horenstein et al. Reference Horenstein, Wagner, Czajkowski and Akabas2001; Lape et al. Reference Lape, Colquhoun and Sivilotti2008; Pless & Lynch, Reference Pless and Lynch2009; Unwin et al. Reference Unwin, Miyazawa, Li and Fujiyoshi2002). The structural integrity of the ECD is important as weakening backbone hydrogen bonds in the β7, β9 and β10 sheets abolish receptor function, while photochemically cleaving the backbone between loops A and E has similar effects on GABA activation, but not on activation by pentobarbital (Gleitsman et al. Reference Gleitsman, Lester and Dougherty2009; Hanek et al. Reference Hanek, Lester and Dougherty2010). The movement of the ECD, mediated by the M2–M3 linker at the extracellular side of the TMD, destabilizes the hydrophobic ‘girdle’ in the channel, which moves away from the centre of the pore into space that resides between the inner and outer rings, opening the channel (Law et al. Reference Law, Forrest, Ranatunga, La Rocca, Tieleman and Sansom2000; Miyazawa et al. Reference Miyazawa, Fujiyoshi and Unwin2003). It is often claimed that Miyazawa et al. (Reference Miyazawa, Fujiyoshi and Unwin2003) found a ‘rotation’ in the M2 regions, but only rotations in the ECD were identified, along with two alternative structures of the M2 helices: straight in the closed state and kinked in the open state. The cytoplasmic ends of M2 remain relatively static during these events (Panicker et al. Reference Panicker, Cruz, Arrabit and Slesinger2002, Reference Panicker, Cruz, Arrabit, Suen and Slesinger2004). In support of this hypothesis, mutations of the gate residues affect ion permeation, cause increased sensitivity to channel opening, slow desensitization of macroscopic currents, increase closing events and/or increase channel open times (Chang & Weiss, Reference Chang and Weiss1998; Filatov & White, Reference Filatov and White1995; Labarca et al. Reference Labarca, Nowak, Zhang, Tang, Deshpande and Lester1995). A collective movement of all the M2 helices is likely, as they maintain their five-fold symmetry in both the closed and open states (Unwin, Reference Unwin1995), and the gate residue αL251 effects pore opening independent of the nAChR subunit type mutated (Filatov & White, Reference Filatov and White1995; Labarca et al. Reference Labarca, Nowak, Zhang, Tang, Deshpande and Lester1995). Gating of Cys-loop receptors can occur in the absence of bound ligand, but at very low frequency (e.g. Jackson, Reference Jackson1984, Reference Jackson1986; Hu & Peoples, Reference Hu and Peoples2008). The binding of ligand increases the probability of opening and maximizes as the quantity of bound ligands rises to at least two (Beato et al. Reference Beato, Groot-Kormelink, Colquhoun and Sivilotti2004; Corradi et al. Reference Corradi, Gumilar and Bouzat2009). As the channel opening rate can be quicker than the dissociation rate of the ligand, several openings can occur during a single ligand occupancy.
Electron microscopy studies (Miyazawa et al. Reference Miyazawa, Fujiyoshi and Unwin2003; Unwin et al. Reference Unwin, Miyazawa, Li and Fujiyoshi2002) have indicated that the β1–β2 and β8–β9 loops and the β10 strand in the ECD are closely associated with residues in the M2–M3 linker, providing a direct link between the ECD and TMD (Lee et al. Reference Lee, Free and Sine2008; Unwin, Reference Unwin1995; Unwin et al. Reference Unwin, Miyazawa, Li and Fujiyoshi2002). Comparing the structures of the ELIC (apparent closed conformation) and GLIC (apparent open conformation) prokaryotic receptors also shows distinct differences in this region (Bocquet et al. Reference Bocquet, Nury, Baaden, Le Poupon, Changeux, Delarue and Corringer2009; Hilf & Dutzler, Reference Hilf and Dutzler2008). In support of the structural data, experiments show that coupling of binding to gating in a chimaeric AChBP (ECD)/5-HT3 (ICD) receptor could only be achieved when these three amino-acid loops from the ECD of the 5-HT3R were substituted into the corresponding regions of AChBP. This indicates that compatibility between the two regions is necessary (Bouzat et al. Reference Bouzat, Gumilar, Spitzmaul, Wang, Rayes, Hansen, Taylor and Sine2004), although subsequent studies which could not repeat these functional data led these authors to conclude that AChBP is in the desensitized form (Grutter et al. Reference Grutter, Prado De Carvalho, Virginie, Taly, Fischer and Changeux2005b). Specific residues in the loops at the ECD/TMD interface have been identified as playing roles in the transduction process; in particular, a salt-bridge between the ECD and TMD regions has been identified in nACh (Lee & Sine, Reference Lee and Sine2005) and GABAC (Price et al. Reference Price, Millen and Lummis2007; Wang et al. Reference Wang, Lester and Dougherty2007) receptors. However, there is no such salt bridge between the equivalent residues in GABAAR (Kash et al. Reference Kash, Jenkins, Kelley, Trudell and Harrison2003, Reference Kash, Dizon, Trudell and Harrison2004), 5-HT3 (Price et al. Reference Price, Millen and Lummis2007) or GlyR (Schofield et al. Reference Schofield, Jenkins and Harrison2003), although it is clear that charged residues are important. A good explanation for these results is that there is a global electrostatic attraction between the two regions (Dougherty, Reference Dougherty2008; Xiu et al. Reference Xiu, Hanek, Wang, Lester and Dougherty2005). A series of recent reviews have summarized current knowledge of the changes that induce channel opening (Bartos et al. Reference Bartos, Corradi and Bouzat2009; Cederholm et al. Reference Cederholm, Schofield and Lewis2009; Chang et al. Reference Chang, Wu, Zhang and Huang2009; Gay & Yakel, Reference Gay and Yakel2007).
7. Time-resolved structural information
It has long been a goal of biophysicists to understand the conformational changes in an ion channel at sufficient time resolution (a) to link each structure to a functionally defined state, and possibly (b) to visualize the transition states as well. This goal remains elusive for two reasons. (1) Some Cys-loop receptors desensitize within a few ms after opening, and therefore, structural measurements must have sufficient temporal resolution to distinguish between active and desensitized states. (2) We do not yet understand the kinetic bases of equilibrium side chain parameters such as polarity, polarizability, volume and (in the case of Pro), backbone cis–trans isomerization, or how such properties govern the kinetics of changes in the secondary and tertiary structures of proteins. Therefore, results from site-directed mutagenesis alone cannot usually be interpreted in kinetic terms.
7.1. Time-resolved cryo-electron microscopy
Conceptually, the clearest approach is Unwin's pioneering experiment that obtained cryo-electron microscopy data at 9 Å resolution from Torpedo nAChR-rich membranes, both in the closed state, and ~5 ms after ACh was sprayed onto the membrane (Unwin, Reference Unwin1995). Unwin identified rotations in the ECD and two alternative structures of the M2 helices; straight in the closed state and kinked in the open state. These measurements may eventually be brought to the 4 Å resolution of Unwin's later cryo-electron studies (Unwin, Reference Unwin2005), but are currently insufficiently resolved to identify the orientation of individual amino-acid side chains.
7.2. Time-resolved mass spectrometry
As detailed in section 4, state-dependent cross-linking and SCAM experiments reveal that residues change their distance from each other, or their water-accessibility, as the channel opens, closes and desensitizes. A complementary technique uses photoaffinity labelling during periods when the Cys-loop receptor is in the open, closed or desensitized state. Using this technique, the membrane was kept intact to allow voltage control manipulations; oocytes expressing nAChR were exposed to constant ACh during a voltage-clamp experiment. The receptors, which have voltage-dependent gating, were switched from open to closed by voltage jumps. The oocyte was exposed to the lamp during 500 ms epochs that coincided with either the open or closed states (Leite et al. Reference Leite, Blanton, Shahgholi, Dougherty and Lester2003). Because of the photoprobe concentrates in the membrane, mass spectrometry then revealed regions whose exposure to the membrane changed during the state transitions. In the open state, there was specific probe incorporation within the ECD in the β8–β9 loop. In the closed state, probe incorporation occurred within the Cys-loop, and these findings agree well with present concepts about the gating interface. In the closed state, there was also probe incorporation in the M3–M4 region, emphasizing that this region too may move relative to the membrane during gating (Akk & Steinbach, Reference Akk and Steinbach2000; Bouzat et al. Reference Bouzat, Bren and Sine1994).
7.3. Light-flash relaxations
Other strategies produce a perturbation at a structurally defined location, and then ask how the receptor relaxes with a new equilibrium. The kinetics of the relaxation then reveal the speed of a conformational change that propagates from the perturbed residue to the channel gate(s). Unfortunately, the location of voltage dependence is unknown in those Cys-loop receptors (such as the muscle nAChR) that display voltage-dependent kinetics. However, light-flash relaxations are more informative, because they originate at known locations. In one example, the photoisomerizable nicotinic agonist Bis-Q was photoisomerized from the active, trans configuration to the non-agonist cis configuration while the Bis-Q molecule was bound to the binding site. Channels closed completely within <100 μs showing that dissociation of the agonist and channel closure are linked to this time scale (Nass et al. Reference Nass, Lester and Krouse1978; Sheridan & Lester, Reference Sheridan and Lester1982). The photon cross-section for this closure corresponds to two Bis-Q molecules per channel, showing that this conclusion applies to either of the two bound agonists. Information of this sort can be obtained only indirectly from other kinetic studies.
In another example, the unnatural side chain Tyr-ONB, or caged Tyr, was introduced in place of the Tyr residues in the nAChR α subunit at loop A (Tyr93), near the Cys-loop (Tyr127) or in loop C (Tyr198). The mutant receptor did not respond to ACh. Flash decaging, in the presence of ACh, produced conductance increases that covered a wide range of time scales (1 ms to 10 s), with at least two phases in each case (Miller et al. Reference Miller, Silverman, England, Dougherty and Lester1998). The faster phase (τ1) was governed by the time course of the flash (~1 ms); this is important, because it implies that changing any of these side chains to the native Tyr activates the gate within ~1 ms. The time constant of the slower phase (τ2) was considerably slower: τ2 at Tyr127 (13 ms) was faster than for Tyr198 (41 ms) or for Tyr93 (820 ms). We now understand that Tyr127 is closer to the channel gate than are the other two side chains, and we also know that Tyr198 is on a loop that moves when agonist binds in AChBP (Zheng & Zagotta, Reference Zheng and Zagotta2003). On the other hand, in most models, Tyr93 does not participate directly in conformational changes that open the channel. Thus, a structural change in a side chain influences the conductance more rapidly when it directly participates in the gating pathway.
7.4. Rate-equilibrium free energy relationships
Rate-equilibrium free energy relationships (REFERs) provide a more general way to specify the order at which various residues participate in the conformational changes that open and close the gate (Edelstein et al. Reference Edelstein, Schaad, Henry, Bertrand and Changeux1996; Grosman et al. Reference Grosman, Zhou and Auerbach2000b). In this analysis, one performs a kinetic experiment that can distinguish the rate of channel opening from that of channel closing. This can be accomplished with macroscopic measurements, but is most simply done by measuring single-channel kinetics at agonist concentrations so high that they saturate the binding step. The kinetic and equilibrium data are compared for a set of mutations at a residue under investigation. If the data are well behaved, they yield a parameter 0<Φ<1, which indicates the proximity of the transition state controlled by the residue of interest. Values of Φ near 0 and 1 indicate that a transition state is nearest to the open or closed state, respectively. Strikingly, the initial investigation showed that progression of Φ, from near 1 to near 0, approximated the physical position of residues from extracellular (near the binding site) to intracellular (near the channel gate), respectively (Chakrapani et al. Reference Chakrapani, Bailey and Auerbach2003; Grosman et al. Reference Grosman, Zhou and Auerbach2000b). These data led to the conclusion that opening proceeds in a conformational wave, from the binding site to the channel gate. Evidently, the Φ values imply both mechanistic order and temporal order.
More recent analyses have shown clusters of Φ values for neighbouring residues, giving rise to the idea that domains of the receptor move together and allowing the ordering of conformational changes that involve various domains. Thus, a recent analysis concludes that the residues at the top of α-M2 region move at about the same time as the binding site (Bafna et al. Reference Bafna, Purohit and Auerbach2008). Later in the conformational wave, the M2 regions have several distinct steps at Φ values between 0·64 and 0·31 (Purohit et al. Reference Purohit, Mitra and Auerbach2007).
7.5. Voltage-clamp fluorometry
Voltage-clamp fluorometry provides another way to identify changes in the local structure. Fluorescence changes (ΔF) that differ from conductance changes are the more interesting, whether these differences occur along the axis of time, agonist concentration, blocker concentration or agonist efficacy. In the usual experiment, an introduced Cys residue is derivatized with a Cys-reactive fluorophore whose fluorescence is highly dependent on local polarity. The typical probe, tetramethylrhodamine, increases its fluorescence by factors approaching 100 when its environment becomes less polar. We do not yet fully understand the photophysical nature of the relation between conformational changes and fluorescence, but can simply say that a ΔF means a local change in the environment. Indeed, several Cys-loop experiments show that the sign (positive or negative) of ΔF varies with position for closely spaced residues (Muroi et al. Reference Muroi, Czajkowski and Jackson2006; Dibas et al., HAL lab). We call this the ‘sign caution’. One must also rule out a direct interaction between the tethered fluorophore and the ligand under test, as well as making sure that the ligand does not have a fluorescent signature of its own.
Following the lead of experiments on voltage-gated channels and neurotransmitter transporters, voltage-clamp fluorometry measurements usually involve a voltage-clamped oocyte, because the large measureable membrane area provides better signal to noise ratios than experiments on an individual voltage-clamped mammalian cell. The excised inside-out patch procedure, which has proven to be useful for cyclic nucleotide-gated channels (Zheng and Zagotta, Reference Zheng and Zagotta2003), is less useful for channels gated by extracellular ligands and therefore has not been employed. There are also indications that covalently bound fluorophores can sense structural changes in the GABAAR that presumably originate at binding interfaces, and then propagate to a non-binding subunit that has the fluorescent label (Muroi et al. Reference Muroi, Czajkowski and Jackson2006).
Concentration–response relationships are possible when the maximal ΔF/F (e.g. signal/background) exceeds ~2%. The data for GABAA and GABAC receptors show that fluorophores tethered to loops A, C and E undergo agonist-induced conformational changes that change the fluorescence of bound fluorophores; these fluorescence changes have the same concentration–response relationship as the conductance (Chang & Weiss, Reference Chang and Weiss2002). Thus, we have another indication that part of the ECD moves as the channel opens; but the small ΔF/F prevented experiments that would compare the kinetics of the fluorescence changes and conductance changes. Interestingly, fluorophores in loops A (Chang & Weiss, Reference Chang and Weiss2002) and E (Chang & Weiss, Reference Chang and Weiss2002; Muroi et al. Reference Muroi, Czajkowski and Jackson2006) experience antagonist-induced fluorescence decrease, opposite to the agonist-induced changes. This difference eliminates concerns about the ‘sign caution’. On the other hand, a fluorophore in loop C exhibits similar changes whether the binding site is occupied by agonists or antagonists (Chang & Weiss, Reference Chang and Weiss2002). These findings about antagonists could not have been obtained from mutagenesis alone. Because of the ‘sign caution’, the results do not conflict with recent conclusions, mostly based on AChBP, that agonists allow loop C to collapse on the agonist, while antagonists tend to push loop C away from the other loops (Gao et al. Reference Gao, Mer, Tonelli, Hansen, Burghardt, Taylor and Sine2006; Hansen et al. Reference Hansen, Sulzenbacher, Huxford, Marchot, Taylor and Bourne2005). Picrotoxin, a pore blocker, does not induce ΔF by itself (Muroi et al. Reference Muroi, Czajkowski and Jackson2006), but partially blocked ΔF for a loop E position, fully blocked ΔF for a loop A position, and failed to block ΔF for a loop C position (Chang & Weiss, Reference Chang and Weiss2002). Pore block is a complex kinetic and equilibrium phenomenon and detailed concentration–response experiments for both agonist and blocker would be required to resolve the question of whether a fluorophore in the ECD senses a different environment when the channel is blocked by picrotoxin (Lester, Reference Lester1992).
The largest ΔF/F (10–20%) has been measured for the environment-sensitive fluorophore, tetramethylrhodamine (TMR) tethered at the extracellular end (typically close to the channel lining residue 19′) of the M2 region at the muscle nAChR (Dahan et al. Reference Dahan, Dibas, Petersson, Auyeung, Chanda, Bezanilla, Dougherty and Lester2004) or GlyR (Pless et al. Reference Pless, Dibas, Lester and Lynch2007). These signals enable spectrally resolved studies on the fluorescence, verifying the expectation (from studies in solution) that the emission spectrum shifts towards the blue as the emission increases. The original report concerned the muscle nAChR β-subunit containing TMR tethered to the 19′Cys mutation; but signals almost as large have now also been found for the γ19′ and δ19′ positions as well (Dibas et al., unpublished results). The concentration–response relations for agonist-induced ΔF are shifted well to the left of those for agonist-induced current, implying that conformational changes occur at concentrations too low to open the channel. Further experiments led to the conclusion that β19′ positions events that closely follow agonist binding at the αδ interface. In this case, ΔF/F was sufficiently large to allow kinetic studies, down to a time resolution of ~5 ms. The kinetic studies showed that one or more desensitized states of the nAChR retain the fluorescence increase, consistent with the idea that most desensitized receptors have agonist bound. The question arose, does ΔF arise solely from one or more desensitized states? The answer is no, because when the receptors were activated by a flash-induced increase of the agonist trans-Bis-Q, ΔF was complete with 20 ms, one to two orders of magnitude faster than desensitization (Dahan et al. Reference Dahan, Dibas, Petersson, Auyeung, Chanda, Bezanilla, Dougherty and Lester2004).
Experiments with tetramethylrhodamine tethered to a GlyR 19′ Cys residue show that large ΔF/F has the same Gly concentration–response relation as the Gly-induced conductance (Pless et al. Reference Pless, Dibas, Lester and Lynch2007). But β-alanine and taurine produced robust ΔF without appreciably activation. Propafol converted taurine and β-alanine to full agonists, yet failed to produce a Gly-like blue-shifted emission spectrum. Thus, as in the nAChR, TMR at 19′ reports a conformational change associated with a binding event in the ECD that occurs in the absence of channel opening. On the other hand, ivermectin, suspected of acting in the TMD, activates the channel without inducing ΔF. Strychine, which competes at the binding site, blocks ΔF; picrotoxin, which blocks the channel, does not reduce ΔF.
Voltage-clamp fluorometry has justified its promise as a procedure that can reveal conformational changes induced by ligands, separable from those associated with channel opening (Pless & Lynch, Reference Pless and Lynch2008). Cys-loop receptors apparently have wondrously complex conformational states and flexibility. Unfortunately, voltage-clamp fluorometry has told us little about the specific nature of the additional conformations.
7.6. Total internal reflection fluorescence
Some of Axelrod's pioneering experiments with total internal reflection microscopy (TIRF) were performed on muscle nAChRs labelled with antibodies (Wang & Axelrod, Reference Wang and Axelrod1994). Since then, many investigators have appreciated that TIRF is an optimal technique for resolving membrane-associate proteins. Recent TIRF experiments with single-molecule resolution have utilized channels that incorporate fluorescent proteins to count subunits in various ion channels (Ulbrich & Isacoff, Reference Ulbrich and Isacoff2007). In a further refinement of the channel- and subunit-counting theme, it is now possible to label nAChRs with fluorescent unnatural amino acids, which vastly decreases the possible structural perturbation produced by the fluorophore (Pantoja et al. Reference Pantoja, Rodriguez, Dibas, Dougherty and Lester2009). It is also possible to count individual subunits with fluorescent ligands, either α-BTX (Pantoja et al. Reference Pantoja, Rodriguez, Dibas, Dougherty and Lester2009) or a Cy3-derivative of carbamoylcholine (Fujimoto et al. Reference Fujimoto, Yoshimura, Ihara, Matsuda, Takeuchi, Aoki and Ide2008). Within a given individual cell, there is good agreement among the estimates for the number of channels from electrophysiology, fused fluorescent proteins, the fluorescent unnatural side chain and fluorescent α-BTX (Pantoja et al. Reference Pantoja, Rodriguez, Dibas, Dougherty and Lester2009). It may also be possible to develop high-throughput assays for 5-HT3Rs with TIRF detection of fluorescent ligands (Hovius et al. Reference Hovius, Schmid, Tairi, Blasey, Bernard, Lundstrom and Vogel1999).
The ‘optical patch clamp’ is an entirely different use of single-molecule TIRF microscopy (Demuro & Parker, Reference Demuro and Parker2005). Cells are injected with a dye whose fluorescence increases when it binds Ca2+. When an nAChR channel opens, the resulting transient cytoplasmic microdomain of increased fluorescence is sufficiently close to the membrane to be visualized by TIRF. The increased fluorescence has a square-wave time course (at a temporal resolution of ~2 ms) and exhibits all the expected kinetics, pharmacology, dose-dependence and voltage dependence expected from single nAChR channels. The technique simultaneously images and resolves the opening of hundreds of channels. It is especially encouraging that muscle nAChRs and normal Ringer solutions were used in the experiment, because the muscle nAChR has a relatively lower Ca2+ permeability than most nACh and 5-HT3Rs, implying that nearly all receptors could be studied with the ‘optical patch clamp’.
8. Conclusions
Members of the Cys-loop of LGICs display considerable structural and functional homology. In this review, we have seen how evidence from structural studies can often be applied across the whole family of receptors. Functional conservation cannot be better demonstrated than by the creation of chimaeric receptors that combine varying regions of the different family members to create new receptors that possess the functional properties of both receptors (i.e. Eiselé et al. Reference Eiselé, Bertrand, Galzi, Devillers-Thiéry, Changeux and Bertrand1993; Galzi et al. Reference Galzi, Bertrand, Corringer, Changeux and Bertrand1996; Grutter et al. Reference Grutter, De Carvalho, Dufresne, Taly, Edelstein and Changeux2005a, Reference Grutter, Prado De Carvalho, Virginie, Taly, Fischer and Changeuxb). Considering the level of sequence and structural similarity between members, it is not surprising that there is also cross-talk by agonists (e.g. Nakazawa et al. Reference Nakazawa, Akiyama and Inoue1995; Macor et al. Reference Macor, Gurley, Lanthorn, Loch, Mack, Mullen, Tran, Wright and Gordon2001) and antagonists within the group (e.g. Ballesetro et al. Reference Ballestero, Plazas, Kracun, Gomez-Casati, Taranda, Rothlin, Katz, Millar and Elgoyhen2005; Broad et al. Reference Broad, Felthouse, Zwart, Mcphie, Pearson, Craig, Wallace, Broadmore, Boot, Keenan, Baker and Sher2002; Drisdel et al. Reference Drisdel, Sharp, Henderson, Hales and Green2008; Gurley & Lanthorn, Reference Gurley and Lanthorn1998; Macor et al. Reference Macor, Gurley, Lanthorn, Loch, Mack, Mullen, Tran, Wright and Gordon2001; Thompson & Lummis, Reference Thompson and Lummis2008b). There has already been considerable research on these receptors, and the more recent identification of new members (e.g. Histamine-gated (Beg & Jorgensen, Reference Beg and Jorgensen2003; Bocquet et al. Reference Bocquet, Prado De Carvalho, Cartaud, Neyton, Le Poupon, Taly, Grutter, Changeux and Corringer2007; Davies et al. Reference Davies, Wang, Hales and Kirkness2002; Zheng et al. Reference Zheng, Hirschberg, Yuan, Wang, Hunt, Ludmerer, Schmatz and Cully2002), EXP-1 (Beg & Jorgensen, Reference Beg and Jorgensen2003), Zinc-activated (Davies et al. Reference Davies, Wang, Hales and Kirkness2002), ELIC (Hilf & Dutzler, Reference Hilf and Dutzler2008), proton-gated (Bocquet et al. Reference Bocquet, Prado De Carvalho, Cartaud, Neyton, Le Poupon, Taly, Grutter, Changeux and Corringer2007), glutamate-gated (Cully et al. Reference Cully, Vassilatis, Liu, Paress, Van Der Ploeg, Schaeffer and Arena1994), MOD-1 (Ranganathan et al. Reference Ranganathan, Cannon and Horvitz2000) and SsCl (Mounsey et al. Reference Mounsey, Dent, Holt, Mccarthy, Currie and Walton2007)) suggests that others still remain undiscovered. A combination of traditional experimental methods and some of the more recent developments described in section 7 will provide us with further insights, many of which will be widely applicable to the whole Cys-loop receptor family.
9. Acknowledgements
The authors' research is supported by the Wellcome Trust (SCRL, AJT; SCRL is a Wellcome Trust Senior Research Fellow in Basic Biomedical Science); the EU (SCRL; NeuroCypres FP7) and NIH (HAL).



