When incumbent presidents are reelected in African countries, their victory is often attributed to a opposition that is fragmented, often along ethnic lines (Southall, Reference Southall1998; Mozaffar et al., Reference Mozaffar, Scarritt and Galaich2003; van de Walle, Reference van de Walle2003). Public opinion data confirms that African voters often report an intention to vote for presidential candidates from minor ethnic parties,Footnote 1 even though these parties have far too little support in the population to have any chance of victory. In Guinea, the Soussou, who make up 20 percent of the population, and who could be pivotal if they voted as a bloc, instead split their intended vote between at least three minor Soussou-dominated parties. In Kenya, 23 percent of opposition voters, and 12 percent of voters overall, say they will vote for minor parties that are strongly associated with their own ethnic group. In Namibia, those not of the ruling Wambo ethnic group make up almost 50 percent of the population, but, rather than uniting against the Wambo, cast votes for a dozen tiny parties, many of which, like NUDO or APP, are dominated by members of a single minority ethnic group. The result is that African oppositions are indeed remarkably fragmented: a Herfindahl index of opposition parties supported by Afrobarometer respondents yields an average country score of 0.8.Footnote 2
Driven by concerns about reduced accountability and the entrenchment of the incumbent, a growing literature seeks to identify the conditions under which voters can be convinced to coordinate on a single presidential candidate nominated by a multi-ethnic opposition coalition (Arriola, Reference Arriola2013; Riedl, Reference Riedl2014; Peterka, Reference Peterka2016). What these studies do not explain, however, is why voters are supporting candidates from ethnic minor parties in the first place. There is ample existing evidence that African voters’ preferences for coethnic politicians, where they exist, are weighed alongside strategy. Ghanaian voters who live among members of other ethnic groups defect from their own ethnic party and vote along with their neighbors in order to increase the community's political leverage (Ichino and Nathan, Reference Ichino and Nathan2013). Zambian voters avoid ethnic voting, and instead align with larger identity groups, when their ethnic group is not large enough to form a minimum winning coalition (Posner, Reference Posner2004). The non-viability of small ethnic parties is why race, rather than ethnicity, is still the dominant cleavage in South Africa (Piombo, Reference Piombo2005).
Voters’ continued support of ethnic minor parties at the presidential level is therefore a puzzle: why would strategic voters cast their vote for a minor party whose candidate cannot win, instead of coordinating with other voters into a larger opposition party that can? One possibility is that the subset of voters who vote for ethnic minor parties are not strategic. Another possibility is that voters do not realize they are not voting strategically because, given low information, they erroneously believe their candidate has a high likelihood of winning (Horowitz and Long, Reference Horowitz and Long2016).
In this article, I argue that strategic, fully-informed voters will still vote for sincerely preferred minor parties when there is little cost to “wasting” their vote. A primary concern for voters in many poor countries is maximizing access to future government goods. Where distribution is targeted only to those who supported the winning candidate, a voter who votes sincerely for a candidate who is guaranteed to lose will not be able to later trade in her vote for clientelist rewards. However, as the incumbent provides more programmatic goods, which are accessible to all voters regardless of whom they support, the relative cost of sincere voting decreases. I develop a model that demonstrates that greater programmatic distribution under the incumbent will tend to increase the share of voters who vote for a minor party, even accounting for all parties in the system and voters’ varied preferences. The counterintuitive implication of this model is that an ethnically divided opposition will be most likely to occur where voters feel most secure in their access to valuable government goods.
I show results from a survey experiment among potential minor party supporters in Uganda, and an analysis of cross-national public opinion. The experiment shows that subjects who perceive poor distribution vote strategically, supporting the major opposition party. On the other hand, those who believe they are receiving goods that were not conditioned on their vote are more likely to choose an ethnic minor party. Using the Afrobarometer, I then show that respondents are more likely to choose minor parties over major opposition parties when they are unlikely to be receiving clientelism, but still approve of the president's overall provision of goods and services. I provide direct evidence that this is due to an increase in sincere voting among respondents who perceive good programmatic distribution. Overall, both support for minor parties and opposition fragmentation are correlated with positive evaluations of the incumbent.
The puzzle I highlight here is not unique to Africa: party fragmentation induced by minor ethnic parties is also of concern in Latin America and Europe (Ordeshook and Shvetsova, Reference Ordeshook and Shvetsova1994; Madrid, Reference Madrid2005; Birnir and Van Cott, Reference Birnir and Van Cott2007; Peli, Reference Peli2011; Stroschein, Reference Stroschein2011). Thus the paper contributes to the comparative behavior literature more broadly. First, I show that minor party voting is theoretically and empirically relevant to our models of voting and accountability: the incumbent's performance determines both how likely it is that voters will oppose him and whether the opposition will be unified enough to oust him. Second, I identify a cause of minor party support and opposition fragmentation that has been overlooked in favor of electoral rules and social fractionalization: the incumbent's distribution affects the cost voters pay for voting sincerely. In general, though previous literature has correlated both minor party voting and opposition fragmentation with political dysfunction, I show that both patterns are positively correlated with better outcomes and more satisfied voters.
1. Theory
There is already a literature on the determinants of minor party support in advanced democracies. In these models, minor party support is treated as a sincere vote: minor party voters are more closely aligned with the ideology of the minor party and either get expressive utility from voting for the party closest to their ideal point, or hope to induce one of the major parties to adopt the minor party's platform in order to recapture their vote. However, voters will override their sincere preference and vote strategically for their preferred major party if they believe that casting a vote for a minor party creates an unacceptably high risk that the other, less-preferred major party would win. Voters in advanced democracies are more likely to cast a strategic vote if their distaste for their least-preferred party is strong, and more likely to vote sincerely if they do not believe their vote will change the outcome of the election (Blais, Reference Blais2002; Hillygus, Reference Hillygus2007; Moser and Scheiner, Reference Moser and Scheiner2009; Myatt, Reference Myatt2017).
The general logic of these models is intuitive and should apply everywhere: voters will be most likely to cast a sincere vote for a preferred minor party candidate when they perceive a sufficiently low risk that doing so will produce a bad outcome. The relevant caveat is that, in most African countries, the “bad outcome” is unlikely to mean the election of an ideologically-distant candidate: African political systems are generally non-ideological, and most parties have similar valance platforms (Conroy-Krutz and Lewis, Reference Conroy-Krutz and Lewis2011; Bleck and van de Walle, Reference Bleck and van de Walle2013). Instead, the cost of supporting a minor party candidate is the loss of access to government goods that are conditioned on prior support for the candidate who wins the election. Those who vote for candidates who have no chance of winning eliminate their chance of trading their vote for clientelist rewards in the future. Whether voters can afford to waste their votes on a minor party, therefore, depends on the relative value of the goods they forsake by failing to support a winning candidate. In the models below, I show that, under conditions that are easily met in African countries, the share of voters who choose a minor party over the opposition will tend to increase as the incumbent allocates more goods that are unconditional on political loyalty.
In the model, any party—major parties i (incumbent) and o (opposition), and minor party m—can provide two types of goods upon gaining office. Clientelist goods are discretionary private or local public goods that are targeted specifically to the individuals or communities that supported the candidate and can include anything from vouchers and transfers to equipment and local infrastructure. A candidate will only provide these goods to those who voted for him. Programmatic goods are not conditional on political support and include true non-targetable public goods like economic growth and national security, as well policies and material goods that benefit citizens according to need, efficiency, or other non-partisan criteria. Voters will have the same access to any programmatic goods provided by the winner whether they voted for him or not.
The value of the programmatic goods given to the voter by candidate x is notated as G x. The value of the clientelist goods given to the voter by candidate x is notated as C x. Together they comprise the total value that candidate x provides to the voter. However, they are not perfect substitutes, because candidates may steal or waste resources, or provide value in the form of non-material goods such as favorable policy: one candidate could provide both a higher G x and a higher C x than the other, and an increase in one type of good does not necessarily imply a decrease in the other.Footnote 3
Each party's candidate also has an initial probability of victory, notated as $\Pr ( x)$ . The minor party candidate's chance of victory is always zero no matter what the voter does, and the probabilities of victory for parties i and o always sum to one. When the voter votes for either of the major party candidates, the chosen candidate's chance of winning is increased by v, and the other major candidate's likelihood is reduced by the same amount; v represents the (perceived) impact of the voters’ vote.Footnote 4 If the voter selects a minor party candidate, the minor party's chance of victory remains at zero, and both major parties keep their original chance of victory.
Finally, voters get direct expressive utility (e) from voting sincerely in favor of their preferred party. This utility may represent the satisfaction of casting an “honest” vote, protesting discrimination or expressing solidarity with their ethnic group. Voters who prefer the minor party may also be trying to increase leverage over the major parties by demonstrating willingness to defect, or trying to help a local political entrepreneur garner a large enough bloc of voters to bargain for a position in government. No matter why voters might gain the utility represented by e, this utility accrues at the time of voting and is not affected by the outcome of the election. All voters get utility from supporting their preferred party, whichever party that is, but since I want to explain the conditions under which those who prefer a minor party vote sincerely, I assume in the models below that the voter prefers the minor party and will only gain expressive utility e if she votes for party m.
Equations 1 and 2 provide the utility when the voter, who prefers party m, votes for o and m, respectively. They show that voting for party o provides no expressive utility to the voter, but increases the likelihood that o will win and provide both clientelist and programmatic goods to the voter. Voting for m provides expressive utility, but no chance of clientelist goods, and an unchanged likelihood of receiving the programmatic goods that would be provided by either i or o.


The voter will select minor party m over major party o when μ(m) > μ(o). Equation 3 simplifies the inequality to provide the conditions under which the voter will choose the minor party rather than the major opposition party.

Equation 3 generates a number of unsurprising implications that have been demonstrated elsewhere. First, voters will be more likely to choose the opposition when the opposition will distribute more. Voters become more likely to select the minor party when expressive utility (e) is higher or when the opposition has a lower ex ante probability of victory and the incumbent's reelection becomes more certain.
The less trivial implication of the model is that whether the voter prefers the minor party or the major opposition party is influenced by the distributive choices of the incumbent. Equation 3 shows that the utility of selecting o decreases, and the likelihood of choosing m increases, as the incumbent provides more or more valuable programmatic goods (as G i increases).Footnote 5 Conversely, as G i decreases, voters will be more likely to prefer o to m.Footnote 6
Of course, there is more than one choice facing voters in this scenario: the behavior of the incumbent also affects how voters choose between the two major parties, and whether they prefer the minor party over the incumbent. Similarly, though I modeled the choices of a voter who prefers the minor party, voters may also sincerely prefer a major party. In Appendices A and B, I account for voters’ other choices and the possibility that some voters sincerely prefer major parties. The models confirm that, under conditions that are easily met, increasing programmatic distribution by the incumbent reduces the share of voters choosing o without reducing the share choosing m.Footnote 7 In other words, even accounting for all three parties in the system, and voters’ varied preferences, programmatic distribution will tend to increase the share of voters who support the minor party relative to the share who support the major opposition party.
The models also demonstrate that sincere voting will be most likely, and the incumbent's distribution will have the greatest effect on vote choice, when the incumbent has the highest probability of victory. Where the incumbent is at an electoral advantage (and the opposition at a disadvantage), G i will have a relatively larger impact on voters’ expected utilities. Where the incumbent has a lower probability of victory, there will be fewer (if any) values of G i that would be sufficient to induce a voter to select a minor party over the opposition.
1.1 Intuitive interpretation of the model
The intuitive interpretation of the model is that voters will vote sincerely when they can afford to. Voters will be most willing to support a minor party where the incumbent not only provides programmatic goods, but is also very likely to win. In this case, the voter will receive goods from the incumbent even if she supports a minor party, and because the incumbent's seat is safe, she is less likely to inadvertently allow the election of a challenger who would provide less. Under these conditions, voters can get the expressive utility of sincere voting without sacrificing material well-being.
On the other hand, where outcomes are poor for everyone, or where good outcomes only accrue to those who supported the winning party, voters face substantial opportunity cost in voting for a minor party. Voting for a minor party eliminates access to clientelist goods and does nothing to increase the chance the incumbent could be replaced with a better-performing challenger. Voters will only select a minor party when they receive substantial expressive utility that is enough to outweigh the material costs.
This theoretical construction provides a different view of minor party voting than much of the existing literature, which argues that voters select minor parties when they are displeased with or distrusting of the government. My model instead predicts that voters will be more likely to choose a minor party when they believe the incumbent is doing a better job providing broad access to government goods. Accordingly, both the models and the intuition imply that support for the incumbent and support for minor parties will move in the same direction relative to the major opposition party. Voters who are satisfied with the incumbent are freer to indulge in a sincere vote, especially if the incumbent is favored to win, and have less incentive to instead vote strategically for a party that can depose the incumbent.
1.2 Hypotheses
The model provides three testable implications:
H1: The share of voters choosing a minor party over a major opposition party will increase as the incumbent distributes more unconditional/programmatic goods
H2: Support for the incumbent and support for minor parties will be positively correlated
H3: Voters will be most likely to choose a minor party, and the impact of distribution on vote choice will be greatest, where the incumbent has the highest likelihood of victory
2. Ugandan experiment
I provide evidence consistent with the hypotheses from two sets of data: a survey experiment in Uganda, and an observational analysis of public opinion in an 18-country pooled sample. The experiment was run first, as part of a larger project on distribution and voting: I generated the model inductively to explain why the experiment, which provided cues about the incumbent, had most of its effect on the composition of the opposition. The observational analysis was run after the model was developed and provides an out-of-sample test of the model, including some additional implications that could not be tested with the experimental data.
The survey experiment took place among a clustered random sample of voters of Ganda ethnicity from Mukono District, Uganda in May and June of 2014.Footnote 8 Mukono District is one of the districts that comprise Buganda, the traditional Ganda kingdom; a large majority of residents in Mukono are Baganda. Baganda split their votes between the incumbent party (NRM), the major opposition party (FDC) and an ethnic minor party, the Democratic Party (DP). There are currently 15 Members of Parliament from the DP, 13 of them elected by constituencies within Buganda. According to Round 5 of the Afrobarometer, 5 percent of Ugandan voters overall and 19 percent of Baganda also support the DP at the presidential level.Footnote 9 There is room in this sample to induce and capture changes in the dependent variable, which is the share of voters choosing a presidential candidate from the DP, rather than FDC.
Additionally, most constituencies in Mukono return majority support for the incumbent at the presidential level, but the region is competitive, and local leaders represent multiple parties. Government services in the district are better than average, especially in urban areas, but the conventional wisdom in Uganda is that the southwest region, not Buganda, is most favored by the regime. It is reasonable for voters in the region to believe they are receiving clientelist rewards (because their constituency supports the incumbent) or to believe they are not (because their support is more tenuous than elsewhere). Therefore, there is also room to manipulate perceptions of how much the government distributes to the area and the extent to which this represents programmatic rather than clientelist distribution.
Since these data are collected in a single time and place, I cannot use them to show that the incumbent's distribution has greater effect when he is more likely to win. However, if the model is correct, Uganda's strong one-party state should make the hypotheses easier to test, by increasing the incumbent's probability of victory and therefore both the likelihood of sincere voting and the marginal effect of government distribution on vote choice.
2.1 Description of treatments
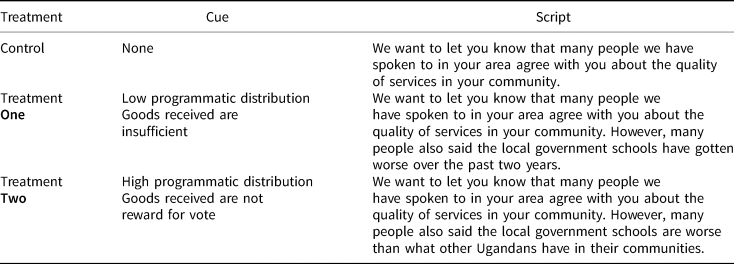
All subjects in the study were assigned to either control or one of two treatments. The treatments primed subjects to adjust their perceptions of the educational resources the community has received from the incumbent. The first treatment manipulated subjects’ perceptions of how much had been allocated in total for their local government primary school by cuing them to consider that the school was improving or deteriorating. The second treatment manipulated perceptions of how much they had been allocated in relative terms, by cuing subjects to consider that their local school was better or worse than other schools in Uganda.
I choose primary schools because they are one of the few government-funded goods that all subjects have in their communities. While fewer than half of Ugandans have paved roads, electricity, piped water, or sanitation, almost 90 percent live within walking distance of a primary school. School quality is also more likely to reflect current government policy, since it is heavily dependent on recurrent distributions of funding, staff, and instructional materials. As there are far too few educational resources to go around, reallocation across schools and sectors is common.
Schools are also tightly associated with the central state and the incumbent. The Minister of Education and Sports—who is also Uganda's First Lady—is responsible for allocating funds, constructing classrooms, developing instructional materials, training teachers, and assigning teachers to schools. As with most local public goods in Uganda, school funding is devolved to the local level for administration, but funds are monitored to prevent leakage: the amount every school has been allocated by the center is reported in government-run media and must be posted on school grounds. Local governments do not collect additional taxes for schools.Footnote 10 Existing literature indicates that Ugandans associate the quality of their school with the incumbent president (Harding and Stasavage, Reference Harding and Stasavage2014; Carlson, Reference Carlson2016a). Table A1 in the appendix confirms that problems at local schools, especially poor teaching, reduce Ugandans’ evaluations of the president's performance in providing education, his overall performance, and whether they plan to vote for him.Footnote 11
Many Ugandans already have accurate information about objective characteristics of their primary school (e.g. the number of teachers per pupil). Providing factual information would not necessarily affect subjects’ attitudes, unless I provided misinformation, which I did not want to do. Instead, I solicited subjects’ opinions about school quality and treated them by telling them (truthfully) that others disagreed with their assessments. Few government schools in Mukono are of unambiguously high or low quality, so highlighting disagreement prompted subjects to recall, re-weight, or assign different values to various aspects of school quality. For example, a subject who had been thinking of a newly built classroom block when giving a positive assessment of his school might be prompted by treatment to remember that the school had also lost two senior teachers to reassignment, and therefore to downgrade his assessment of the overall quality of the school or the value it provides.
This method of assigning treatment meant that while respondents were randomly assigned to treatment or control, the content of the treatment script was not random, and depended on how they had initially evaluated their school. As it happened, a large majority of subjects (78 percent) initially rated their school as improving or staying the same over the past two years. A similarly large percentage (74 percent) said their schools were better than or the same as the schools in other communities. Therefore, most subjects assigned to treatment were given a negative cue, and told that others said their school was either worsening over time, or was worse than other schools in Uganda. The precise scripts are shown in Table 1.
Treatments scripts

The sample of subjects who initially gave a negative assessment on either variable, and were treated with positive cues, is too small to provide reasonable power and these subjects are not included in the main analysis. These results are shown in Table A5 in the appendix.
2.2 Mapping treatments onto the model
To understand how the treatments could shift perceptions of programmatic distribution, without directly mentioning distribution, consider that any resource provided by the government to a school could be clientelist or programmatic depending on whether it was conditioned on prior support for the incumbent. A school might receive only programmatic goods, or a mixture of programmatic and clientelist goods. As an example, imagine that every school in the country received the same per capita allocation of Ministry-written textbooks—this resource was distributed programmatically and provides value G i—but that schools in loyal communities are systematically assigned more qualified teachers—this resource was distributed clientelistically and represents C i. Both types of resources would contribute to the absolute quality of the school and the value it provides, but clientelist distribution would also affect how schools compare to one another, with schools being better, on average, when they are receiving clientelist rewards on top of their programmatic allocation.Footnote 12
Treatment One manipulated perceptions of overall school quality, which reflects the sum of programmatic and clientelist distribution (C i + G i), both of which must be low if the school is deteriorating. Programmatic distribution cannot be higher than total distribution, so if the school is worse than subjects thought, the maximum possible value of G i is also lower, reducing perceived programmatic distribution on average.Footnote 13 If the model is correct, this will also drive down minor partying voting. More intuitively, where distribution under the incumbent is low enough that schools are deteriorating, subjects have an incentive to actually unseat the incumbent, which means voting strategically for an opposition candidate who can win: voting for a minor party does nothing to improve outcomes.
By manipulating perceptions of relative quality, Treatment Two provided evidence that distribution to the community was not clientelist. Mukono's relative wealth and proximity to the capital mean school quality should be better than average, all else equal. If schools are worse in Mukono, the incumbent is actively targeting clientelist rewards to other, more loyal areas and C i is zero. Since all resources are either programmatic or clientelist, any resources subjects previously attributed to clientelism (C i) must now be counted as programmatic distribution and G i will be higher, on average, than subjects previously believed; this should increase support for the minor party.Footnote 14 Intuitively, the treatment means that none of the resources the school is receiving were a reward for prior loyalty and subjects do not have to trade on their vote to maintain current school quality. Subjects are free to vote for whomever they wish, including a minor ethnic party.
2.3 Measuring vote intention
The treatment scripts were read aloud to subjects near the end of a face-to-face interview. Because vote choice can be sensitive, I allowed subjects to report their preference in private. After the enumerator asked the subject which party she would be most likely to vote for in a presidential election, he handed his smartphone to the subject, who saw the logos and names of the four parties that consistently put up presidential candidates, a blank box for “other or independent” and a crossed-out box for “would not vote.” Respondents tapped the logo indicating their preference, at which point the screen blanked out and a smiley face image appeared to obscure their choice.
3. Experimental results
The model predicts that reducing perceptions of total school resources (Treatment One) will also reduce perceptions of programmatic expenditure and decrease support for the minor party (and the incumbent) relative to the major opposition party. Cuing voters to believe that school funding is not a reward for their vote (Treatment Two), on the other hand, will increase perceptions of programmatic distribution, increasing support for the minor party (and the incumbent). Table 2 presents the results of a multinomial logit that estimates the effect of each treatment on subjects’ choice between the NRM, the FDC, and the DP. Support for the major opposition party (the FDC) is the omitted category.
Effect of treatment on choice of presidential party

Standard errors in parentheses
+ p < 0.1, * p < 0.05, ** p < 0.01 Results present multinomial logit model of party choice, with support for the major opposition party as the omitted category. The rows present results from different models: analysis of Treatment One controls for unbalanced variables of food insecurity and school improvement rating. Analysis of Treatment Two does not include additional controls. All models cluster standard errors by the enumerator. Treatment effects are estimated within respondents who gave the same initial evaluations of absolute and relative school quality.
I estimate the effect of Treatment One controlling for food insecurity and the particular positive rating (holding steady or improving) subjects initially gave to their school: both of these were imbalanced at the 5 percent level between control and Treatment One, as shown in Table D in the appendix. No covariates were significantly unbalanced across those assigned to control and Treatment Two, so I do not add controls to my estimate of the second treatment effect.Footnote 15 All models cluster responses within enumerators, to absorb any heterogeneous treatments effects caused by variation in how treatments were delivered. Each model estimates the effects of treatment among those who gave an initial positive evaluation on both aspects of school quality and could have been assigned to either treatment or to control. The effects of each treatment relative to control were analyzed separately, but are combined in the table to save space.
The results show that, consistent with Hypothesis 1, the share of voters selecting the minor party over the major opposition party was significantly reduced when subjects were cued to perceive low distribution: Treatment One reduced the likelihood that subjects would choose the DP over the FDC by over 10 percentage points. In contrast, subjects who were cued to believe that current education funding was programmatic rather than clientelist were significantly more likely than those in the control to choose the minor over the major opposition party: those choosing the DP over the FDC increased by more than 15 percentage points.
Consistent with Hypothesis 2, both treatments moved support for the incumbent in the same direction as support for the minor party, relative to support for the opposition. Treatment One reduced the likelihood subjects would choose the incumbent NRM over the FDC, and Treatment Two increased the likelihood voters would instead choose the NRM. These results are consistent with a model in which minor party voting is more likely to occur when voters feel secure that the incumbent is providing them with goods that are unconditional on their votes and see less need to vote strategically for the opposition.
Determinants of vote choice in support in pooled African sample

Standard errors in parentheses
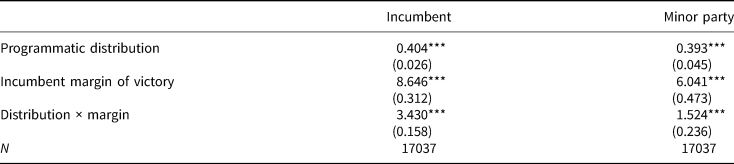
+ p < 0.10, * p < 0.05, ** p < 0.01, *** p < 0.001 Table presents results of generalized multinomial logit model with community-level fixed effects. Support for a major opposition party is the omitted category. Coefficients estimate likelihood respondents will select the incumbent or minor party over the major opposition party. Controls not shown include perceived ethnic discrimination, ethnic attachment, poverty, education, urban residence, gender, age, employment status, V-Dem democracy score, GDP per capita, ethnic fractionalization, perceived survey sponsor, and the enumerator's evaluation of whether the respondent seemed anxious while answering political questions.
3.1 Robustness
Table A3 in the appendix shows that the results are robust to the inclusion of non-response or “other” as a fourth vote choice option. Table A4 shows the results are robust using different methods for handling clustering in the data. Table A5 shows that the effect of treating subjects with positive cues about the incumbent had the expected, reverse effects on subjects’ vote choice, though the effects are less significant due to the substantially smaller sample size.
3.2 Alternative explanations and additional patterns
My argument is that the treatments affected subjects’ perceptions of the extent of programmatic distribution and their freedom to vote sincerely for a preferred party. As the treatments were not purposed-designed to test for programmatic distribution, it is possible that subjects did not interpret the treatments this way, and the treatment effects are driven by some other mechanism. In this section, I provide additional evidence in favor of the proposed interpretation.
First, Table A6 in the appendix uses standard logit to assess the effect of treatment on whether subjects voted for or against the incumbent, as well on the composition of the opposition. This specification shows, as the results in Table 2 did, that both treatments significantly affected the number of opposition voters choosing the minor party. However, neither treatment had a large or statistically significant effect on the number of subjects choosing the incumbent over the opposition as a whole. This result is not consistent with standard retrospection model or one in which subjects took the treatments as a cue to vote for the incumbent in hopes of gaining access to more clientelism: both alternative models would predict changes to the share of voters voting for or against the incumbent. Instead the results suggest that treatment affected whether opposition voters felt compelled to coordinate strategically on the major opposition party in particular.
A second possibility is that informing subjects that they were disfavored by a non-coethnic president increased the salience of ethnicity. However, Table A7 in the appendix shows that ethnicity was most salient to those who could have been assigned to Treatment Two, but were not. These voters—who initially reported the region was favored, and were not contradicted—were 16 percentage points more likely to prefer a hypothetical coethnic candidate presented at the end of the survey. Subjects who were cued to believe they were disfavored and those who believed they were disfavored from the start showed a substantially weaker preference for the coethnic candidate. These results indicate that telling subejcts they were disfavored did not increase their preference for coethnic candidates or parties, but instead freed them to vote for the candidate they already preferred.
A final possibility is that the treatments had their effect by changing perceptions of how popular the incumbent would be in a national contest. In this construction, Treatment One signaled that the incumbent was performing poorly and was likely less popular than the subject thought.Treatment Two, on the other hand, signaled that other voters were getting better services and the incumbent would be more popular elsewhere that the subject suspected. While these interpretations are not about programmatic distribution, they are in keeping with the model, which shows that sincere voting will become more (less) frequent as the incumbent becomes more (less) like to win. In the following analysis, I will distinguish between programmatic distribution and support for the incumbent, in order to isolate the effect of the former.
4. Cross-national evidence
To show that the interpretation and theory hold up outside the experiment, I use Round 5 of the Afrobarometer, which includes data from 18 countries.Footnote 16 In addition to providing a larger and more varied sample than the experiment, the data allow me to test additional implications of the model. I can use these data to test Hypothesis 3, which predicts that the effects of distribution will be greatest in countries where the incumbent has the strongest likelihood of victory. The data also include separate measures of respondents’ preferred party, and the party they would vote for; this allows me to confirm that what is changing across conditions is voters’ propensity to vote sincerely.
The dependent variable in this section is respondents’ choice of incumbent, major opposition or minor ethnic party if a presidential election were held tomorrow. I code ethnic minor parties as those that receive the support of less than 15 percent of those who reported a preference, and whose supporters are disproportionately from a single ethnic group.Footnote 17 There are 153 parties in the data that meet these criteria. Parties classified as minor parties in the data include the DP, the Ugandan minor party that was addressed by the experiment. They also include the Liberty Party (a Bassa party that won 9 percent in the 2017 Liberian presidential elections), the APGA (an Igbo party that won 3 percent in Nigeria in 2018), the CUF (a Zanzibari party that did not put up a candidate in 2015), and the MDC-N (an Ndebele party that split from the MDC for the 2013 Zimbabwean election and won 3 percent of the vote). Slightly over 20 percent of respondents in the sample say they “feel close” to a party coded as a minor party, but only 7 percent of respondents report an intention to vote for a minor party at the presidential level.
I code major opposition parties as any non-incumbent parties that receive more than 15 percent of support in the sample, regardless of their ethnic composition. I set the threshold low for a major party because parties with vote shares of less than 30 percent in a first round have occasionally gone on to win office and Afrobarometer respondents tend to understate their support for the opposition (Weghorst, Reference Weghorst2011; Bratton et al., Reference Bratton, Dulani and Masunungure2016; Carlson, Reference Carlson2016b). I want to capture parties whose actual support in the population is high enough that they have (or are perceived to have) a non-zero chance of winning the presidency.
I capture perceived programmatic distribution using respondents’ approval of the president's performance, which reflects the total value the respondent receives from the incumbent. However, because some of that value may arise from goods that were provided clietentelistically, I distinguish approval driven by programmatic distribution from that which may be driven by receipt of clientelist rewards. I regress approval ratings on ethnicity, partisanship, and household-level economic improvements, all of which are correlated with clientelism (Franck and Rainer, Reference Franck and Rainer2012; Ichino and Nathan, Reference Ichino and Nathan2013; Burgess et al., Reference Burgess, Jedwab, Miguel, Morjaria and Padró i Miquel2015; Ejdemyr et al., Reference Ejdemyr, Kramon and Robinson2017). I then calculate a residual. By construction, the residual captures how respondents evaluate the president on provision of goods and services that are not targeted to loyal social groups and do not increase private consumption. In other words, the residual will disproportionately pick up respondents’ assessments of the provision of programmatically provided goods.Footnote 18
Table A8 in the appendix provides evidence that the residual is capturing programmatic distribution. The residual is higher among those who say they trust the incumbent and who believe there is less corruption in the president's office. It is lower among those who believe their ethnic group, or people in general, are treated unfairly by the government. These correlations imply that the residual is capturing programmatic good governance, rather than clientelism or kleptocracy. According to the theory, an increase in this variable should increase support for the minor party (and incumbent) relative to the major opposition party.
4.1 Correlation of programmatic performance with vote choice
The model shown in Table 3 estimates the correlation of vote choice with perceived programmatic distribution, and with an interaction of programmatic distribution and the incumbent's margin of victory. I calculate the incumbent's margin as his reported support on the survey minus 50 percent.Footnote 19
The table presents a generalized multinomial logit model, with support for a major opposition party once again the omitted category. The model includes a number of controls for subject demographics as well as ethnic salience, institutional structure, and societal fractionalization, which are traditional predictors of party fractionalization and ethnic voting. I also include two indicators correlated with misreporting, including whether the respondent believed (erroneously) that the interviewer was sent by the government. Finally, I add community-level fixed effects to account for clustering in the sample and absorb any unmeasured variation in local conditions that might affect vote choice, including clientelist distribution that takes the form of local public goods.
The results show that, consistent with Hypothesis 1, perceived programmatic distribution significantly increases the share of voters selecting a minor ethnic party over a major opposition party. Consistent with Hypothesis 2, programmatic distribution's effect on relative support for the minor party is in the same direction as its effect on relative support for the incumbent: all coefficients are of the same sign in both columns. Consistent with Hypothesis 3, both minor party voting and the marginal effect of distribution on vote choice increase as the incumbent's margin of victory increases; the unconditional vote-margin variable and the interaction are both significantly positive.
Altogether, under the conditions under which I argue minor party voting should be least appealing—elections are competitive and voters see little of value beyond clientelist distribution—as few as 8 percent of opposition voters choose a minor party. Where the model predicts voters should be most willing to vote sincerely—the incumbent is electorally safe, and voters approve of his programmatic performance—up to 55 percent of opposition voters chose minor parties. These results support all three testable implications of the model and affirm the larger intuition that voters are most likely to vote for a minor party when they feel most secure under current outcomes.
4.2 Robustness
Table A10 provides the main coefficients given changes in how minor parties are coded. Table A9 shows different ways of isolating perceptions of programmatic distribution from presidential approval, including calculating the residual at the level of the respondents’ communities. Table A11 provides the results under different approaches to the geographic clustering in the data.
4.3 Correlation of programmatic performance with sincere voting
While the results already shown are consistent with my proposed model, a multinomial logit model cannot rule out an alternative explanation: minor party voters are unstrategic partisans who are indifferent to the incumbent's performance, and variations in relative shares are driven entirely by movement in and out of the major opposition party while minor party support remains constant.
In Table 4, I provide direct evidence of shifts in the level of sincere voting. I limit the sample to those who, when asked about their partisanship, reported that they “feel close” to a party I have coded as an ethnic minor party. The dependent variable is whether the respondent reported an intention to vote sincerely for the minor party they prefer. The model is a standard logit with community-level fixed effects. The independent variables, interaction term, and controls are otherwise identical to those in Table III. The results show that, as theorized, sincere voting among those who prefer a minor party increases with perceived programmatic distribution. Those who are more satisfied with the president's performance are more likely to cast their vote for the minor party they prefer, while those who are less satisfied are more likely to instead vote strategically for a major party. As in the previous analyses, and the theoretical model, the effect is greatest where the incumbent has the greatest electoral advantage.
Determinants of sincere voting, among minor party supporters

Standard errors in parentheses
+ p < 0.10, * p < 0.05, ** p < 0.01, *** p < 0.001 Sample includes only those who report they “feel close” to a minor party. Dependent variable takes a one if the respondent reported that they would vote for the minor party. Controls not shown include perceived ethnic discrimination, ethnic attachment, poverty, education, urban residence, gender, age, employment status, V-Dem democracy score, presence of bystanders during the survey, and perceived survey sponsor. The measure of programmatic distribution is the same as the measure used in Table 3.
5. Conclusion
In this study, I develop a model of ethnic minor party support in developing democracies. I argue that as leaders provide more programmatic goods, voters are freer to “waste” their vote on a sincerely preferred candidate who is certain to lose. I demonstrate that the model is consistent with the results of a survey experiment among potential supporters of an ethnic minor party in Uganda, and with the results of an out-of-sample test among a cross-national observational sample. Voters in both samples are more likely to choose a minor party over the major opposition party when they perceive better access to government goods that are unlikely to have been provided in exchange for their support of the regime. They vote strategically for the major opposition when the reverse is true.
The results indicate that voters who support ethnic minor parties that cannot win are not necessarily choosing ethnic expression over strategic considerations, but have concluded that the costs of expressive voting are low enough to make strategy irrelevant. While existing studies link minor party support to disapproval of the incumbent or distrust in the political process, my results show that minor party support is linked to greater satisfaction with the government. The results provide a qualitatively different explanation for voters support minor parties and why oppositions end up divided. The results imply that minor party voters are not those who are disillusioned, but those who feel secure enough to vote sincerely.
Supplementary material
The supplementary material for this article can be found at https://doi.org/10.1017/psrm.2020.36.