Introduction
The interface between the boreal forest and the Arctic tundra is the Earth's greatest vegetation transition (Callaghan and others Reference Callaghan, Werkman and Crawford2002). This interface region is over 13,000 km long, and occupies around 5% of the vegetated surface of the Northern Hemisphere. It represents major gradients in key climatological parameters such as carbon flux, waterflux and albedo. The position of this interface region, and the species composition of the northern boreal forest, have undergone major shifts (for example up to 3000 km in position) since the last glacial maximum (Payette and others Reference Payette, Eronen and Jasinski2002). Ecosystem-based modelling predicts northward shifts in boreal vegetation distributions in response to global warming (Skre and others Reference Skre, Baxter, Crawford, Callaghan and Fedorkov2002; ACIA 2004), with roughly half to two thirds of the present tundra being displaced by forest by the end of the 21st century. Such changes would have majorclimatological implications through the probable increase in CO2 absorption and decrease in CH4 emission, decrease in regional albedo and alteration of the hydrological cycle (Betts Reference Betts2000; Harding and others Reference Harding, Kuhry, Christensen, Sykes, Dankers and van de Linden2002). The processes that determine the northern limit of trees are, however, complex and not fully understood. As well as environmental factors, ‘plant performance’ also plays a critical although imperfectly known role (Sveinbjörnsson and others Reference Sveinbjörnsson, Hofgaard and Lloyd2002), and local to regional human impacts are also significant (Vlassova Reference Vlassova2002). Systematic monitoring data are scarce, and provide scant evidence for the northward shift predicted by models such as BIOME. Indeed, counterintuitive observations have been noted, including southwards shifts of species, and expansion of tundra, despite strong arctic warming trends (Crawford and others Reference Crawford, Jeffree and Rees2003).
Despite a century of research, there is still a lack consistent data on the location, nature and dynamics of the tundra-taiga interface (TTI) at all scales from global to landscape (Callaghan and others Reference Callaghan, Werkman and Crawford2002). The greatest uncertainties are in Siberia. As an example of locational uncertainty, Fig. 1 shows six different treelines. The difficulties arise mainly from scarcity of data at the circumpolar scale, and in adapting traditional definitions of treeline, forest line etc, basedon in situ measurements or high-resolution air photography, to encompass a wide range of spatial scales. Both of these difficulties can be addressed through application of remote sensing data and new quantitative methods of landscape analysis. It is obvious that only broad-swath satellite remote sensing has the capability of providing systematic and timely circumpolar-scale data (Rees and others Reference Rees, Brown, Mikkola, Virtanen and Werkman2002). Historically, the principal source of such data has been the series of AVHRR (advanced very high resolution radiometer) instruments, operational since 1978 and offering spatial resolution of the order of 1 km and swath widths of around 2600 km. Major new opportunities are presented by the MODIS and MERIS instruments (operational since 1998 and 2002 respectively) which provide greater spectral and spatial resolution than AVHRR with similarly hightemporal resolutions. A number of high-level data products are now being generated from both MODIS and MERIS data, with potential relevance to the discrimination of the TTI. In particular, the suite of MODIS land products includes MOD12Q1, a land-cover map produced by supervised classification at a spatial resolution of 1 km and a temporal resolution of3 months. This classifies natural vegetation into 11 land-cover units (five forest types and 6 non-forest types) as defined by the International Geosphere-Biosphere Programme (IGBP). These have not, however, been optimised for description of the tundra-taiga interface. Although systematic comparisons with other global land-cover classifications have not, to the author's knowledge, been reported, preliminary comparisons suggest that, at least in some parts of the Arctic, the representation of the TTI is distinctly poor.
Circumarctic treelines as adopted by Hustich for three different tree species (Hustich Reference Hustich1983), the Circumpolar Arctic Vegetation Map (CAVM Team 2003), the WWF (Olson and Dinerstein Reference Olson and Dinerstein1998), and the USGS/UNL/JRC global land cover database (Eidenshink and Faundeen Reference Eidenshink and Faundeen1994, Olson Reference Olson1994a, Reference Olsonb). (Note that on Greenland the lines are boundaries between tundra and non-tundra areas, not treelines.)

This does not imply that data products from MODIS or similar instruments are unfitted for the task of representing and monitoring the TTI, simply that the necessary research has not yet been carried out. There are several promising lines of development, apart fromthe use of existing land-cover classification schemes. These include approaches based on the seasonal dynamics of vegetation indices or estimates of leaf-area index, and the use of ‘vegetation continuous fields’, in which percentages of different land-cover types are assigned to each pixel, rather than simply assigning each pixel to a single type according to some decision rule. Such data products are being developed from MODIS data (Hansen and others Reference Hansen, DeFries, Townshend, Carroll, Dimiceli and Sohlberg2003) and also from AVHRR data (DeFries and others Reference DeFries, Hansen and Townshend2000). However, it is clear that new algorithms will need to be developed, using field-based assessments and other sources of high-resolution data such as aerial imagery and higher-resolution satellite data such as from the QuickBird, SPOT or Landsat satellites (Häme Reference Häme1991; Colpaert and others Reference Colpaert, Kumpula and Nieminen1995; Rees and Williams Reference Rees and Williams1997; Tømmervik and others Reference Tømmervik, Høgda and Solheim2003; Stow and others Reference Stow, Hope, McGuire, Verbyla, Gamon, Huemmrich, Houston, Racine, Sturm, Tape, Hinzman, Yoshikawa, Tweedie, Noyle, Silapaswan, Douglas, Griffith, Jia, Epstein, Walker, Daeschner, Petersen, Zhou and Myneni2004; Tømmervik and others Reference Tømmervik, Johansen, Tombre, Thannheiser, Høgda, Gaare and Wielgolaski2004). Since the field-scale measurementsused for training and validation of the algorithms are acquired at a resolution of typically 1–10 m, while MODIS and similar imagery has a resolution of a few hundred to around a thousand metres, it will be important to consider scale relations (Marceau Reference Marceau1999; Marceau and Hay Reference Marceau and Hay1999) and to take explicitly into account the spatial structure of the TTI itself, which has been characterised as a pattern of tundra islands within the forest, shading into a pattern of forest islands within the tundra (Payette and others Reference Payette, Fortin and Gamache2001) (Fig. 2). Three-dimensional structure of forest edge regions through analysis of airborne LiDAR data (Means and others Reference Means, Acker, Fitt, Renslow, Emerson and Hendrix2000; Hudak and others Reference Hudak, Lefsky, Cohen and Berterretche2002), recent research on forest edge structure (Allen and Walsh Reference Allen and Walsh1996; Harper and others Reference Harper, Macdonald, Burton, Chen, Brosofsky, Saunders, Euskirchen, Roberts, Jaiteh and Esseen2005) and new spatiotemporal models (Harper and Macdonald Reference Harper and Macdonald2001), and application of fractal concepts such as scale-dependent lacunarity (to characterise the ‘holes’ of tundra in the forest matrix and vice versa) and edge density all have significant potential to define new methods of upscaling data. One possible approach to the task of upscaling is provided by the ‘scaling ladder’ (Wu Reference Wu1999), which integrates hierarchy theory and patch dynamics and can help simplify the complexity of systems under study, enhance ecological understanding, and, at the same time, minimise the danger of unacceptable error propagation in translating information across multiple scales
Forest (black) and non-forest (white) areas near Dividalen, Norway, based on classification of airborne scanner imagery. The image covers an area 1.28 × 0.96 km at a resolution of 2 m. The linear non-forest feature towards the right-hand side of the image is a river.

An international, coordinated programme of research into the TTI has been developed under the auspices of the International Polar Year (IPY). This programme has the title Present-day processes, past changes and spatiotemporal variability ofbiotic, abiotic and socio-environmental conditions and resource components along and across the Arctic delimitation zone (PPS Arctic) (http://www.ipy.org/development/eoi/proposal-details.php?id=151). PPS Arctic combines around 50 researchers from 13 countries, and will have around 20 fieldwork sites across the circumarctic TTI region, chosen to provide adequate sampling of both latitudinal and altitudinal treelines, the oceanicity gradient, and the broad range of tree species composing the TTI. It is coordinated from Norway and the United Kingdom. Its work is organized into four modules:
1. Global change effects on the arctic-boreal transition zone and modelling structural changes
2. Past history and broad scale temporal variations of the transition zone
3. Spatial variations in vegetation, land cover and land use, by remote sensing
4. Land use and development of the tundra-taiga interface through the joint perspective of local traditional and scientific knowledge
This paper describes preliminary work within module 3 on forest structure, aimed at developing a characterisation of the structure of the TTI that is sensitive to the scale ofmeasurement.
Study area and data collection
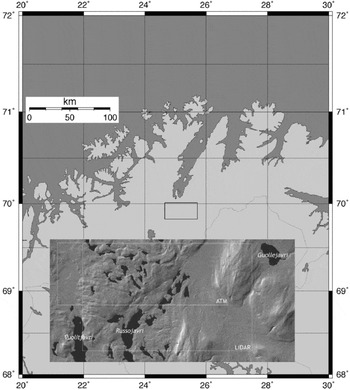
The study site for this work is located near Porsangmoen, in the county of Finnmark, Norway, centred around 69.9° N, 25.1° E. (Fig. 3). The area is forested at altitudes up to 200–400 m, with Scots Pine (Pinus silvestris) and Brown Birch (Betula pubescens).

Remote sensing data were collected from the study site in 2004 and 2005. High-resolution visible/near-infrared imagery was collected on 20 July 2004, using the CASI (compact airborne spectrographic imager: Itres Research of Canada) and ATM (airborne thematic mapper: Azimuth Systems AZ16) instruments carried on board a Dornier 228 aircraft operatedby the Airborne Research and Survey Facility (ARSF) of the United Kingdom Natural Environment Research Council (NERC). These instruments are somewhat complementary in that CASI provides high spectral resolution with more limited spectral range and a narrower swath while ATM provides lower spectral resolution but greater spectral range and wider swath. The characteristics of these instruments are given in table 1. The aircraft was flown at a nominal altitude of 3600 m above ground level, giving pixel widths of 4.5 m (ATM) and 3.6 m (CASI) and swath widths of 3.5 km (ATM) and 1.8 km (CASI). In both years the flight direction was from east to west and vice versa, so the angle between the view direction and the solar illumination varied across thewidth of the imaged swaths.
Characteristics of the ATM and CASI airborne scanners. h is the flying height above the surface.

A third dataset was collected from the same site on 17 July 2005. (The original intention had been to collect all datasets on the same occasion, but a technical problem necessitated a return visit in 2005.) In this case the instrument was an Optech ALTM3033 scanning LiDAR (Light Detection and Ranging) belonging to the University of Cambridge Unit for Landscape Modelling (ULM), again operated by the NERC ARSF from their Dornier 228 aircraft. The LiDAR measures the range to the surface with high accuracy and precision by timingthe flight of pulses of near-infrared laser radiation. It transmits pulses at a repetition frequency of 33 kHz and by scanning the field of view from side to side at up to 30 Hz, data can be collected from a strip either side of the aircraft. The viewing geometry is controlled with extremely high precision by the use of differential GPS, and the horizontal accuracy of the measurements is estimated to be 1 m or better from a height of 1000 m (Arnold and others Reference Arnold, Rees, Devereux and Amable2006). The data were collected at a mean horizontal spacing of 2 m. In fact, the LiDAR system collects two pieces of range information from each pulse: the first return and the last return. In the case of a comparatively open-structured target such as a tree, the first return is from the upper surface of the tree while the last return is most likely to be from the ground, as a result of some radiation penetrating the tree canopy. This characteristic is especially favourable for the study of vegetation canopies since it gives the possibility of directly determining the three-dimensional structure (MacLean and Krabill Reference MacLean and Krabill1986).
Processing and analysis of scanner imagery
The ATM data were processed to assess the suitability of this type of airborne visible/infrared imagery for characterising the forest edge. The data were supplied by ARSF as seven overlapping HDF (hierarchical data format) level 1b products, that is, image files with radiometric calibration and with location and navigation information. The latter are provided by on-board inertial and GPS sensors. Theseimage strips were processed using the software azgcorr(Azimuth Systems UK), supplied by ARSF. This transforms the level 1b image to a level 3a image, that is one that is mapped onto a particular coordinate system and corrects for the on-board attitude and positional data. At the same time it is possible to resample the image to any convenient pixel size. The chosen image projection was UTM zone 35, using the WGS84 ellipsoid and datum, with 5 m pixels. The default method of resampling by azgcorr is bicubic interpolation. Since the resampled resolution was coarser than the original resolution of the imagery, the artefacts introduced by this method of resampling would not have been large.
At this stage it is also necessary to correct for terrain distortion effects since a pixel at the edge of the ATM swath will be displaced by a distance equal to approximately half of its height above the reference datum (the effect for CASI is about half as large as this owing to its narrower swath width). Since the study area contains about 700 m of relief, these distortions would be highly significant. Surface elevation data were available as a digital elevation model (DEM) with a grid spacing of 25 m and a vertical resolution of 1 m. Fig. 4 shows band 7 of one of the level 3a image strips. This band is in the near infrared part of the spectrum which gives a strong contrast between vegetated, non-vegetated and water surfaces. The irregular margins of the strip indicate irregularities in the aircraft's motion that have beencorrected by azgcorr.
ATM band 7 image strip after processing to level 3a.

All seven image strips were processed in this way. In principle it should have been possible to combine all of the level 3a images into a single image mosaic, but in practice the images were found still to contain georeferencing errors significantly greater than the pixel size of 5 m (typically 20 to 50 m RMS), contributed mainly by variations in scale. Further processing was therefore performed on each image strip individually. Fig. 5 shows the result of performing an unsupervised classification on the 11-band image strip represented in Fig. 4. This processing was performed using the freely available Multispec image processing software (Purdue Research Foundation 1994–2006). The ISODATA clustering algorithm was initialised with 30 clusters and converged to 15 stable and unambiguous clusters. These were interpreted as belonging to 5 general classes – water, bare ground, tundra, forest, and a class occurring only at the edges of the image strip – on the basis of evidence from 1:50,000 scale maps and limited in situ validation.
Interpreted ISODATA classification of the 11-band image represented in figure 4. White: bare ground; light grey: tundra; mid grey: forest; dark grey: image edges; darkest grey: water.

Inspection of Fig. 5 shows that while some land cover classes (bare ground, water) are clearly and unambiguously represented, thetundra-forest transition is less clearly delineated. The general pattern of a gradual transition from patches of tundra in the forest, to patches of forest in the tundra, is consistent with both field observations and the model of Payette and others (Reference Payette, Fortin and Gamache2001). On the other hand, well-defined classes along the edges of the swath are clearly unrealistic and are presumably attributable to variations in the viewing geometry. Sensor noise also causes some random misattributions between forest and tundra classes.
Processing and analysis of LiDAR data
LiDAR data were pre-processed by ULM and supplied as a ‘point cloud’ – two sets of (x, y, z) coordinates for each pulse – in ASCII format. The study site of 126 km2 was sampled at a mean density of 0.25 pulses persquare metre, so the dataset consisted of around 33 million first and last returns occupying around 2.3 GB of storage. The data were gridded into two DEMs, one each for the firstand last returns, with a grid interval of 2 m. Gridding and subsequent processing was carried out using the public-domain ImageJ software (Rasband Reference Rasband1997–2006). The last-return DEMwas subtracted from the first-return DEM to produce a tree-height dataset. An extract of this dataset is shown in Fig. 6, from whichit is clear that individual trees have been resolved. From the dataset of which Fig. 6 forms a part, it is straightforward to calculate statistical properties of the distribution of tree heights. For example, the modal height is around 6.6 m and the maximum height is around 17 m. Not surprisingly, the tallest trees are found next to the rivers.
Visualisation of tree heights by subtracting the last-return from the first-return LiDAR DEM.

A number of spatially distributed forest structural parameters can be derived from thetree height dataset. For example, a reasonable definition of ‘forest’ could be that it consists of trees not more than 10 m from one another, with a tree being defined as at least 2 m tall. This definition is straightforwardly implemented by establishing a threshold for the height dataset at 2 m and then constructing a ‘Euclidean distance map’ to identify all those points within 10 m of a tree. The result of this process is shown in figure 7.
Forest regions of the study area, defined as places not more than 10 metres from a tree at least 2 m tall. Black denotes forest.

The pixels of the image shown in figure 7 represent either 100% forest cover, or 0% forest cover – the image is a binary representation of the forest. At coarser resolutions, a typical pixel will contain a mixture of forest and non-forest areas, giving a mean percentage of forest (canopy) cover between 0 and 100. This forms the basis of a means of investigating the scale-dependence of the forest structure. A 4096 × 4096 pixel region (the number was chosen to be a power of 2) of the image of Fig. 7 was extracted, and its resolution was halved in the sense that each pixel value in the new image was the average of four neighbouring pixels in the original image. This process was repeated until the image had been reduced to 4 × 4 pixels. At each stage, the maximum pixel value (canopy density) was calculated. The results of this analysis are shown in Fig. 8, from which it can be inferred that at pixel sizes up to around 10 m, much of the spatial information about the canopy structure is captured in the sense that pure forest pixels are still found. At coarser resolutions, all pixels are mixed. The linear trend in Fig. 8 suggests that pixel sizes less than about 2500 m are needed to identify forest cover.
Maximum average forest canopy density plotted as a function of pixel size from 2 to 1024 m (logarithmic scale).

As a very simple investigation of scale dependence, the results of Fig. 8 were used to define a resolution-dependent threshold canopy density that preserved the total area of forest independent of the resolution. This threshold was then applied to the downscaled images to classify them into forest/non-forest areas. A selection of the results of this process is shown in Fig. 9. Analysis of the full range of resolutions, from 2 m to 1024 m, shows strong evidence of fractal behaviour, with the length of the forest edge (defined simply as the boundary between forest and non-forest areas), the number of discrete regions of forest and the area of the largest discrete region all being well described by power-law dependences on the pixel size p, with exponents of –0.93, –1.77 and +0.51 respectively. Fig. 9 also shows some evidence for a systematic shift in the position ofthe forest edge, in the direction of increasing density, as the resolution is coarsened.
Binary (forest/non-forest) classifications of an 8192 × 8192 m2 area at resolutions of 8 m, 32 m (top), 128 m and 512 m (bottom).

Discussion
This paper has described some preliminary investigations into the structure of the TTIover a range of scales. Two sources of airborne remotely sensed data were used, namely multispectral scanner imagery and LiDAR. The multispectral imagery evinced some problems, related to sensor noise, scanning geometry and inadequate knowledge of the aircraft'sposition and attitude, and although some of these difficulties could probably be ameliorated by more sophisticated image processing and classification procedures, or the use of amore modern imager, it is likely that they are to some extent endemic. On the other hand, the airborne LiDAR data have proved notably well suited to the task of structural characterisation of the forest edge. The position and pointing accuracies are known to be very high, so that mosaicing adjacent data coverages does not cause problems, and in consequence it is straightforward to collect data from reasonably large areas (hundreds of square kilometres) at a resolution high enough to discern individual trees. Although tree heightsestimated from LiDAR are generally too small (Naesset Reference Naesset1997) for a variety of reasons, conclusions based on the two-dimensional canopy structure should be valid.
While data with a spatial resolution of 2 m are well suited to the study of structuralphenomena in the treeline region, it is clearly impractical to hope to use such data to characterise the whole circumarctic TTI, as is the aim of the PPS Arctic project. Such characterisations will instead depend on the use of much coarser resolution remotely sensed data, such as that from the MODIS instrument. The understanding of scale dependences of forest edge phenomena will be critical to the systematic use of such coarse-resolution data. The preliminary analyses presented in this paper suggest the outlines of such an understanding. There is evidence that the forest edge may have a fractal character, consistentwith fractal structure noted in forest interiors (Weishampel and others Reference Weishampel, Blair, Knox, Dubayah and Clark2000), and hence perhaps be rather simple to characterise in terms of power-law exponents which may in turn lead to a simple relationship between the position of the forest edge and the scale of the imagery or measurements used to determine it. Future development of this work will beintegrated within the PPS Arctic project. Structural data will be collected from a wide range of sites, and common in situ measurement protocols are being developed, to be combined with high-resolution imagery to determine the relationship between ecologically-defined treelines and their manifestation in satellite imagery at a range of scales.
Acknowledgements
The remote sensing data analysed in this paper were supplied by the NERC ARSF and the Unit for Landscape Modelling, University of Cambridge, with funding from NERC. Logisticalsupport for the data collection was provided by Dr Annika Hofgaard and Dr Hans Tømmervik, both at NINA (Norwegian Institute for Nature Research), and Dr Tømmervik also supplied the DEM of Norway and advice on scaling. I also gratefully acknowledge the assistance of Dr Neil Arnold (Scott Polar Research Institute, Cambridge) and Ivana Barisin(ARSF).