1. Introduction
1.1 A mitosis primer
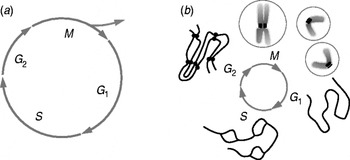
Mitosis is the process by which all eukaryotic cells segregate their already-duplicated chromosomes in preparation for cell division, or ‘cytokinesis’. The cell's preparations for mitosis include the duplication of its DNA. The resulting ‘sister’ DNA double helices are tied together by multiple copies of a protein complex laid down as DNA replicates. Cells then synthesize many additional macromolecules, so at the end of ‘interphase’ (the period between cell divisions), they contain all the materials needed to form two viable cells. Mitosis and cytokinesis then separate this biochemically doubled cell into two essentially identical objects, each equipped to grow and divide again. Thus, mitosis is one part of a cell's growth and division cycle (Fig. 1a).
The cell growth and division cycle. (a) Mitosis (M) is seen in the context of the whole cell cycle, represented as a circle. ‘Interphase’, the time between divisions, includes S phase, when the cell's DNA is replicated, and gaps (G1 and G2) before and after S phase. M is followed by cell division, or ‘cytokinesis’, which divides the already duplicated cell into two essentially identical pieces. The timing of cytokinesis relative to mitosis and interphase varies among different cells, so it is shown only as the forking arrows that imply the emergence of two cells from one. (b) Chromosome structure as a function of time in the cell cycle: in G1 one de-condensed chromosome is shown, representing all chromosomes in the cell. These are replicated during S (‘bubbles’ are places where replication has already occurred, but replication is not yet complete). In G2 there are two copies of each chromosome, still held together by cohesions (bars between ‘chromatids’ in the diagram). In early M (prophase) the chromosomes condense, whereupon one can see each chromosome as a double object with two chromatids and a primary constriction (centromere) where cohesions still hold the chromatids together. This is the site where kinetochores form. During M the chromatids separate; in cytokinesis a cell is formed around each chromosome set. Circles on either side of M represent first the one, then the two cells formed by division.

The first physical problem that a soon-to-divide cell must solve is the restructuring of its chromosomes, so each is sufficiently compact to be separable from its sister within a space no bigger than the cell. In a human cell, the DNA molecules range in length from ~1.9 to 8.5 cm, whereas the nucleus that contains these 46 duplicated objects is an approximately spherical compartment with diameter usually <8 μm. Thus, each DNA duplex must be reduced in length by >1000-fold. Such ‘condensation’ is achieved in multiple steps, initially by wrapping the DNA around nucleosome ‘core particles’ (octamers of the histone proteins); this makes the material called ‘chromatin’. Fibers of chromatin are then coiled and looped in ways that are not yet well understood until each chromosome is only a few micrometers long and usually <1 μm thick. For a review of chromosome condensation, see Belmont (Reference Belmont2006).
The majority of chromatin condensation occurs during the first stage of mitosis, called ‘prophase’. As each piece of chromatin becomes shorter and thicker, it becomes visible in the light microscopy as a thread, hence the term mitosis (mitos=thread in Greek). With continued condensation chromosomes commonly display their dual nature: the sister DNA duplexes formed at replication become distinct. These are called ‘chromatids’. At this stage sister chromatids are still linked by the ‘cohesins’ protein complexes laid down during DNA replication. These attachments are of great importance for the logic of mitosis because accurate segregation of sister chromatids depends on their being attached until the moment when all chromatids will begin segregation at essentially the same time.
Commonly there is one place along the length of each chromosome where sister chromatids are particularly tightly coupled; this is the ‘primary constriction’ or ‘centromere’. As the chromosomes condense, cohesins dissociate from much of the chromosome arms, but near the centromere the chromatids remain bound until their segregation begins. The centromere is also the place where each chromosome develops specializations for its attachment to the machine that will affect its segregation (Fig. 1b).
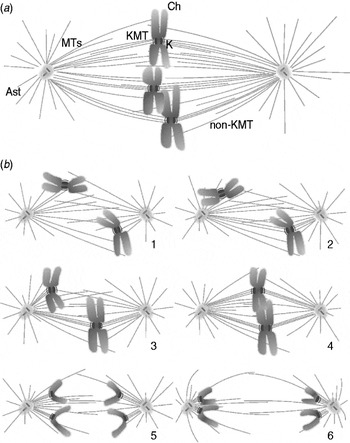
Prophase ends when the already condensed chromosomes begin to interact with the segregation machine, the ‘mitotic spindle’; this name came from the fact that in many cell types the structure resembles the spindle that was used years ago to twist wool into yarn. The mitotic spindle is an assembly of microtubules (MTs); it organizes the chromosomes into a disk-shaped array, then pulls the two identical parts of each chromosome to opposite ends of the cell (Fig. 2). In many cells, including mammals, chromosome–spindle interaction is permitted by a disassembly of the envelope that separated nucleus from cytoplasm throughout interphase. The spindle, which forms from cytoplasmic components, can now influence chromosome position and behavior. In many micro-organisms, however, the spindle forms within the nuclear envelope, which never breaks down (a ‘closed’ mitosis). Thus, there is nothing fundamental for mitosis about the mixing of nucleus and cytoplasm.
Formation of a typical mitotic spindle. (a) A typical spindle at metaphase, showing three chromosomes (Ch) situated near the spindle equator. The spindle poles (SP) and the microtubules (MTs) form the body of the spindle. All MTs are polar polymers, vectorial nature not diagrammed, which are oriented with their plus-ends distal to the pole with which they are associated. MTs that associate with kinetochores (Ks), called KMTs, share this polar orientation. Some KMTs reach all the way to the pole but some do not. Many MTs do not end on Ks (non-KMTs), either because they miss that target or because they pass right through the chromatin. Some MTs project away from the spindle and form the asters (Ast). (b) Diagrams showing spindle formation (1–4), including chromosome–spindle attachment (1–3) and chromosome congression to the metaphase plate (3,4). Chromosome segregation in anaphase A (5) is followed by spindle elongation, or anaphase B (6). Cytokinesis ensues (not shown).

Spindles are composed largely of MTs, which are polymers of the GTP-binding protein, tubulin in complex with many associated proteins. Spindle formation initiates the process of chromosome organization in the mitotic stage called ‘prometaphase’. At this time, the essential event is the attachment of all chromosomes to spindle MTs in such a way that each chromatid of every chromosome is associated with MTs that are in turn associated with one and only one end of the mitotic spindle. A second event of prometaphase is the migration of all chromosomes to the spindle mid-plane, or ‘equator’, a process called ‘congression’. Once these motions have been accomplished, the cell is said to be in ‘metaphase’ (Fig. 2a).
Normal cells include quality control processes that determine whether each chromosome is properly attached to the spindle before segregation is allowed to begin; this is the ‘spindle assembly checkpoint’ (SAC). Shortly after this checkpoint has been satisfied, the cohesins that have been holding sister chromatids together are cleaved by a protease. MT-generated forces acting on the now-independent sister chromatids move them to opposite ends of the cell in a process called ‘anaphase’. If the nuclear envelope dispersed during spindle formation, it now reforms on the still-condensed chromosomes by the application of vesicles derived largely, if not entirely, from the previously dissociated nuclear envelope. As these membranes are fusing to define the two nuclear compartments, the cell initiates cytokinesis, the process that divides the cytoplasm into two approximately equal parts, each of which contains its own nucleus. At the same time, the chromosomes de-condense, and the daughter cells return to interphase (Figs 1 and 2).
Cells employ a special mitotic machine for chromosome segregation because each chromosome is present in only the two copies made by DNA replication, and each daughter cell needs one copy of every chromosome to be able to grow and divide again. At the same time, cells contain vast numbers of structures, such as mitochondria, ribosomes, cytoplasmic membranes, and enzymes, which must also be segregated to daughter cells for the progeny to be healthy. No special device is used for these segregation processes, presumably because these objects are numerous, so the likelihood that all copies will be in one-half of the cell at cytokenisis is very small. In some cells, structures such as mitochondria are present in only a few copies; in such cases, the structure in question will commonly fragment into many pieces for cell division, so the laws of large numbers will help assure their equipartition. Some specialized cells, e.g. certain algae, contain only one copy of an essential organelle, such as a chloroplast or a flagellum; its segregation to daughter cells is then coupled to the position of the mitotic spindle and thus to the process of cytokinesis. Thus, cell division is both parsimonious and clever.
1.2 The problems considered here
The above account shows that mitosis includes many processes. This article focuses on the organization and segregation of already-condensed chromosomes. These processes depend on the mitotic spindle, so our presentation is organized in terms of spindle formation and action. For treatments of membrane dynamics during mitosis, see Altan-Bonnet et al. (Reference Altan-Bonnet, Sougrat and Lippincott-Schwartz2004) and Tang et al. (Reference Tang, Mar, Warren and Wang2008); for cytokinesis, see Pollard (Reference Pollard2010). Our review of the remaining mitotic phenomena will rely on some knowledge of MT dynamics, reviewed in Desai & Mitchison (Reference Desai and Mitchison1997) and of MT-dependent motor enzymes (Gatlin & Bloom, Reference Gatlin and Bloom2010; Vale, Reference Vale2003). We will not, however, deal with MT-related structures, such as centrioles or flagella; nor will we consider the important differences in chromosome structure between mitosis and meiosis, which allow the latter process to reduce the chromosome number from a diploid to a haploid complement in preparation for sexual reproduction.
Mitosis itself is of sufficient interest that it has been reviewed with almost overwhelming frequency; a complete list of even the most relevant reviews would try the reader's patience. We draw attention, though to a few recent papers that will be helpful for the interested reader (Cheeseman & Desai, Reference Cheeseman and Desai2008; Dumont & Mitchison, Reference Dumont, Mitchison, Goldman and Ostap2011; McAinsh et al. Reference McAinsh, Tytell and Sorger2003; Walczak & Heald, Reference Walczak and Heald2008; Welburn & Cheeseman, Reference Welburn and Cheeseman2008).
1.3 Structure of a typical mitotic spindle
Spindle organization is most easily understood at metaphase, after forming, the spindle has already imposed order on chromosome position. Below we will see how this structure forms and how it changes as it does its job. Once fully formed, most spindles have two identical ends, called ‘poles’. An axis of rough-rotational symmetry runs between these poles, and there is a 2-fold axis of approximate symmetry perpendicular to the cylindrical axis. The duplicated but not-yet-segregated chromosomes lie at or near the spindle midplane, or ‘equator’, forming the ‘metaphase plate’ (Fig. 2a). Each of the two chromatids in every metaphase chromosome is attached to one spindle pole, while its sister is attached to the other; meanwhile, the sister chromatids are still mechanically coupled by cohesins. This arrangement anticipates the functional symmetry of anaphase, in which each chromatid will move toward the pole to which it is attached. The resulting segregation of sister chromatids to sister poles is the essence of mitosis.
The details of spindle structure are more complex than the overview. Each MT is a polar polymer in the sense that all the α–β-tubulin dimers from which it is made point in one direction; every β-tubulin is distal to its associated α-tubulin relative to the spindle pole with which the MT is associated. The MT end with β-tubulin exposed is usually more dynamic than the α-tubulin end, faster in both growth and shortening; it is called the ‘plus-end’. MT polarity is important for spindle tubulin dynamics and for the action of the many motor enzymes that use ATP to power their motility over the MT surface.
In vivo tubulin polymerization is commonly initiated by a lock-washer-shaped, multi- protein complex called the γ-tubulin ring complex (γ-TuRC); each of these contains about 13 copies of the γ-isoform of tubulin and several associated proteins (Wiese & Zheng, Reference Wiese and Zheng2006). This complex defines the position of MT nucleation, the polar orientation of the resulting polymer, and the lattice into which tubulin assembles. Most copies of the γ-TuRC are concentrated near the spindle poles, thanks to tethers made from long, α-helical, coiled-coil proteins. The presence of two foci of MT initiation results naturally in a bipolar structure with the initiating sites at its ends.
Spindle MT lengths are heterogeneous, so some plus-ends lie quite distant from their initiating site, while others are close (Fig. 2a). Moreover, some MTs are initiated elsewhere in the spindle. The distributions of MTs lengths and positions are complex (Mastronarde et al. Reference Mastronarde, McDonald, Ding and McIntosh1993; Yang et al. Reference Yang, Houghtaling, Gaetz, Liu, Danuser and Kapoor2007a), but all these complexities maintain the 2-fold symmetry of the spindle, which is fundamental to its ability to segregate chromosomes.
The plus-ends of some spindle MTs become associated with chromosomes in ways that are essential for mitotic success. The centromere of each chromatid binds many proteins specific to this locus, forming a specialization called the ‘kinetochore’. This is the most important part of the chromosome for spindle MT attachment; it is also responsible for chromosome segregation at anaphase. Kinetochores are central to our understanding of the biophysics of mitosis, so they are considered in detail below. It is sufficient to say here that each kinetochore shows an affinity for MTs with a stronger binding to the MT plus-end (Huitorel & Kirschner, Reference Huitorel and Kirschner1988); the resulting kinetochore–MT bonds attach that chromatid to the spindle, whereupon it is pulled toward the pole with which it has become associated. Conversely, kinetochore binding at an MT end makes that tubulin polymer more stable (Mitchison, Reference Mitchison1989b). The kinetochores on sister chromatids are commonly arranged back-to-back, so they naturally tend to form connections with sister poles through the MTs whose plus-ends they bind. In reality, however, this ‘proper’ attachment does not always form, and we will see that cells have developed error-correction processes to bring errant chromosomes into a proper, 2-fold symmetric attachment to the spindle.
In many cells, including those of most vertebrates, the spindle poles initiate some MTs that grow away from the sister pole and do not contribute to the spindle per se. These form star-like arrays called ‘asters’ (Fig. 2). Astral MTs can be long enough to reach the edge of the cell, where they interact with proteins in the cell ‘cortex’, a gelatinous, actin-rich layer just beneath the inner surface of the plasma membrane. Not all cells have asters, so they cannot be essential for mitosis, but they do help position the spindle near the cell's middle, and they can contribute both to spindle mechanics and the position of cytokinesis.
1.4 Mechanical requirements for mitosis
Clearly, spindles can generate whatever forces are necessary to organize the chromosomes during prometaphase and to segregate them in anaphase. A look at chromosome velocities suggests that these forces might be very small. Although chromosomes can be big on a cellular scale, their movements are slow, usually ranging from 0.01 to 1 μm/s, where the high end of this range is seen only during the early stages of mitosis and is usually brief. Based on both reasonable estimates and measurements of cytoplasmic viscosity, the force necessary to overcome viscous drag on chromosomes is at most a few tens of pico-Newtons (pN). Such forces could be generated by only a few motor enzymes of the kinesin or dynein families. Thus, force development seems not to be a major task for the spindle. When mitosis goes wrong, however, chromosomes can become entangled, so their segregation requires more force. Indeed, direct measurement has shown that at least one spindle can actually produce ~10 000×the force necessary to overcome the viscous drag that would act on a chromosome (Nicklas, Reference Nicklas1983). Thus, both the generation and regulation of spindle forces are topics of great interest.
The principal job of the spindle is to segregate the chromosomes without mistakes. A daughter cell that lacks an entire chromosome is not likely to thrive, and even a cell with one extra chromosome may be compromised, as is seen in the pathologies faced by children born with Down or Patau Syndromes (three chromosomes 21 or 13). The accuracy of chromosome segregation has been measured in budding yeast, and the chance of chromosome loss is ~10−5/cell division (with 16 chromosomes per haploid cell) (Hartwell & Smith, Reference Hartwell and Smith1985). This is an impressive accomplishment for a machine that functions at the micrometer scale, using engines that are truly nano-machines. An important aspect of our review will be an effort to understand how spindles can be so accurate.
1.5 The mechanics to be understood
The processes considered below are: (1) How are spindle MTs formed and organized so a metaphase structure is obtained? (2) How do spindle MTs interact with chromosomes so sister kinetochores become attached to sister poles? (3) How do chromosomes get moved to the spindle midplane and form the metaphase plate? (4) How does a cell decide when to start anaphase and where to place the daughter cells that will form at cytokinesis? (5) How does a cell exert force on a chromosome to pull sister chromatids to sister poles? (6) How does a spindle elongate to push the separated chromosomes to opposite ends of the cell?
2. Building and maintaining a bipolar spindle
2.1 Introduction
Here, we consider spindles of two kinds: those with and those without ‘centrosomes’ at their poles. Centrosomes are structured initiators of MT polymerization formed by clustering multiple copies of the γ-TuRC into one region of the cell. They duplicate during interphase, usually about the time of DNA replication, so a cell enters mitosis with two of them. The active γ-TuRCs associated with each centrosome define the position, number, and polarity of the MTs that form. However, some cells form spindles without centrosomes; examples include all higher plants and the oocytes of many animal species. Acentrosomal spindle formation can follow either of two pathways: one emphasizes MT initiation in the vicinity of chromosomes (as seen in frog oocytes), the other takes advantage of both a cylindrical array of cytoplasmic MTs and MT initiation from polar regions, even though centrosomes are absent (common in higher plants). Kinetochores too can contribute to spindle MT formation, though the extent of this pathway varies among organisms. The striking thing about this diversity is that all these assembly pathways lead essentially to the same metaphase structure, suggesting that this arrangement is a favorable place on the energy landscape. For an alternative treatment of this interesting problem, see Duncan & Wakefield (Reference Duncan and Wakefield2011).
2.2 Centrosome-mediated spindle formation
Cells that contain two identical MT initiation sites have an obvious route by which to form a 2-fold symmetric MT array; simultaneous activation of these sites will form just the structure needed.
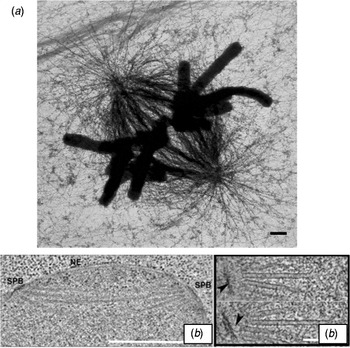
Centrosome morphology is diverse, but all centrosomes include a structured core to which multiple copies of the γ-TuRC are connected. This assembly defines the splays of MTs that grow as the spindle forms, including the asters seen in many animal cells (Figs 2a and 3a). A collection of long, α-helical coiled-coil proteins links the structured material at the center of the centrosome with multiple copies of the γ-TuRC. In vertebrate cells, one such linker is the calmodulin-binding protein, pericentrin (Dictenberg et al. Reference Dictenberg, Zimmerman, Sparks, Young, Vidair, Zheng, Carrington, Fay and Doxsey1998), also known as kendrin. These tethers probably also function to hold the minus-ends of MTs in place, giving the whole assembly mechanical coherence. However, centrosome function is more complicated than a simple tethering of MT initiators; it requires the action of multiple protein kinases, e.g. Aurora A (Cowley et al. Reference Cowley, Rivera-Perez, Schliekelman, He, Oliver, Lu, O'QUINN, Salmon, Magnuson and Van Dyke2009; Glover et al. Reference Glover, Leibowitz, Mclean and Parry1995), whose localization to the centrosome requires the MT-associated protein (MAP) TPX2 (Bird & Hyman, Reference Bird and Hyman2008; Garrett et al. Reference Garrett, Auer, Compton and Kapoor2002). The kinase, Plk1, is also pole-associated and important for spindle formation (Barr et al. Reference Barr, Sillje and Nigg2004), as are the protein phosphatases, PP6 (a negative regulator of Aurora kinase) and PP2A (which has many substrates) (Bollen et al. Reference Bollen, Gerlich and Lesage2009). It seems likely, however, that cells contain some additional MT-initiating capacity that is not dependent on the γ-TuRC, because when the gene for γ-tubulin is knocked down, many centrosome-associated MTs still form, though their organization is generally incorrect (Mahoney et al. Reference Mahoney, Goshima, Douglass and Vale2006). It is not yet certain whether such polymer initiation is due to incomplete depletion of γ-tubulin, spontaneous MT formation as occurs in vitro, or some alternative initiation complex.
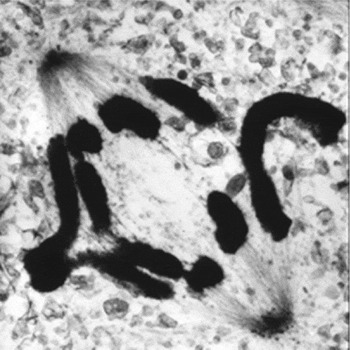
Spindle structure as seen in the electron microscope. (a) High-voltage electron micrograph of a mitotic mammalian cell, strain PtK1, in metaphase. Chromosomes are stained with uranyl acetate, MTs by colloidal gold attached to an antibody specific for tubulin. Bundles of MTs converge on each kinetochore; at their other ends they focus at the poles. Astral MTs are clear. Background fibers are mostly intermediate filaments that are not part of the spindle. Bar=1 μm. (Micrograph courtesy of Mary Morphew, University of Colorado, reprinted from McIntosh, Mol. Biol. Cell, November 2011.) (b) Electron micrographs of spindles from the yeast, Saccharomyces cerevisiae. Left shows the spindle pole bodies (SPB) of a metaphase cell as part of the nuclear envelope (NE); the MTs course through the nucleoplasm, but the chromosomes are not sufficiently condensed to be visible. Bar=0.5 μm. Right shows two slices from a tomographic reconstruction of one spindle pole and MTs emanating from it. Their pole-proximal ‘minus-ends’ are capped and connected to the pole by slender strands (arrowheads). MT plus-ends flare out as the protofilaments bend near the MT end. Bar=75 nm. (Micrographs courtesy of Eileen O'Toole, University of Colorado.)

Centrosomes accumulate several MT-dependent motor enzymes, including those with either plus- or minus-end-directed activities (Gaglio et al. Reference Gaglio, Dionne and Compton1997). Kinesin-13s, which are ATPases that work not as motors but as MT disassembly engines, are also common (Desai, Reference Desai, Verma, Mitchison and Walczak1999). Some centrosomes also concentrate up to three classes of AAA ATPases, such as katanin, that can sever MTs (Zhang et al. Reference Zhang, Rogers, Buster and Sharp2007). This may explain how some MTs lose their minus-end caps, as seen in the blastomeres of a nematode (O'Toole et al. Reference O'Toole, McDonald, Mantler, McIntosh, Hyman and Muller-Reichert2003). Tethering such MTs to the centrosome may depend on ‘patronin’, which stabilizes MT minus-ends in Drosophila S2 cells against enzymatically driven shortening (Goodwin & Vale, Reference Goodwin and Vale2010). Thus, the centrosome is a site MT initiation, anchorage, and severing, plus some aspects of cell regulation.
One of the best-studied centrosomes is that found in budding yeast. It is a plaque built right into the nuclear envelope (which remains intact throughout mitosis, Fig. 3b). Its nuclear surface binds multiple copies of an α-helical coiled-coil protein, SPC110, which in turn links a small γ-tubulin complex to the nuclear-facing surface of the centrosome (Kilmartin & Goh, Reference Kilmartin and Goh1996). Although SPC110 is not homologous with pericentrin, the idea of clustering γ-tubulin into a defined geometry is the same. Moreover, while the spindle is forming, the cytoplasmic face of the centrosome uses a different fibrous protein to bind the γ-TuRCs that initiates MTs that serve as asters. This example shows how cells can use quite different proteins to accomplish essentially the same function. It also shows the use of an interphase structure (the nuclear envelope) to define the placement of key MT organizing structures (the centrosomes), so they will be able to make MTs that influence events in both the cytoplasm and the nucleus.
The MT-initiating activity of a centrosome is under cell cycle control. In mammals, 5–10 times more MTs grow from a mitotic centrosome than from one in interphase (Snyder & McIntosh, Reference Snyder and McIntosh1975). Indeed, the amount of pole-localized γ-tubulin increases as the cell goes into mitosis (Khodjakov & Rieder, Reference Khodjakov and Rieder1999). These changes are accompanied by changes in the phosphorylation of many centrosome-localized proteins, but how these modifications alter the ability of the structural material in the centrosome to bind γ-TuRCs is not yet known. The salient point is that all centrosome-based spindles form from a pair of MT initiating structures, making a bipolar framework of MTs that can then attach the chromosomes.
2.3 Mechanisms for separating duplicate centrosomes at the onset of spindle formation
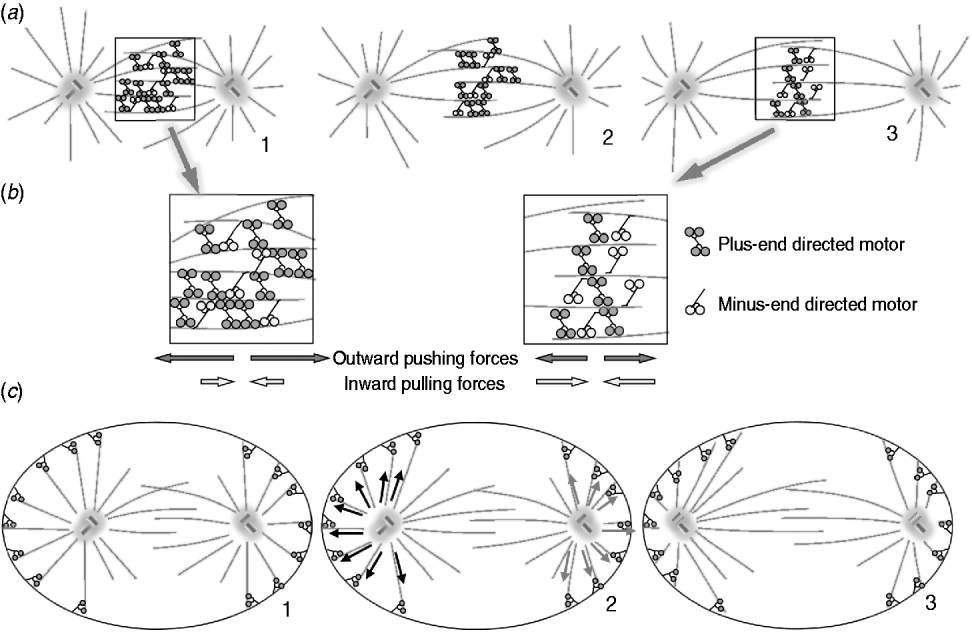
In cells that are growing and dividing, centrosomes usually lie close to the nucleus through most of the interphase. They commonly duplicate around the onset of S-phase but remain close to one another, functioning as a single MT-organizing center until the spindle begins to form. Centrosome separation commonly occurs during prophase, while the nuclear envelope is still intact. This process has been proposed to result from pushing forces generated by interactions between MTs that grow from sister centrosomes. Such a model is supported by the observation that inhibition of kinesin-5, a homo-tetrameric, plus-end-directed motor enzyme, blocks centrosome separation, leading to monopolar spindles (Brust-Mascher & Scholey, Reference Brust-Mascher and Scholey2007). A mechanism by which this plus-end-directed MT motor might contribute to centrosome separation is shown in Figs 4a and b. In some cells, e.g. those cultured from newt heart, the spindle forms as the centrosome separates (Taylor, Reference Taylor1959). In this case, motor-driven processes may still be relevant, but spindle MT growth, including the elongation of kinetochore-associated MTs, is also a part of the separation process (Toso et al. Reference Toso, Winter, Garrod, Amaro, Meraldi and McAinsh2009).
Mechanisms of centrosome separation. (a) Spindle pole separation driven by motors that cross-bridge antiparallel MTs. The dominant effect is from plus-end-directed motors, which walk in that direction on the pairs of antiparallel MTs to which they are connected. This action pulls the MT ends nearer to one another (a: 2, 3). Increased pole separation is permitted by MT elongation. (b) Diagram showing zoomed in views of the 1st and 3rd states of spindle elongation from (a). MT sliding is actually driven by a balance of forces generated by both plus- and minus-end-directed motors. The spindle reaches its steady-state length when the number of motors pulling in each direction becomes equal. (c) Spindle pole separation driven by pulls from outside the spindle acting on centrosome-associated astral MTs. Dark dots represent sites of cortex-attached minus-end-directed motor activity that pulls on the MTs and thus on the spindle poles, forcing them apart. On panel 2 black arrows show forces generated by motors that act on a left pole and gray arrows for forces that act on the right pole.
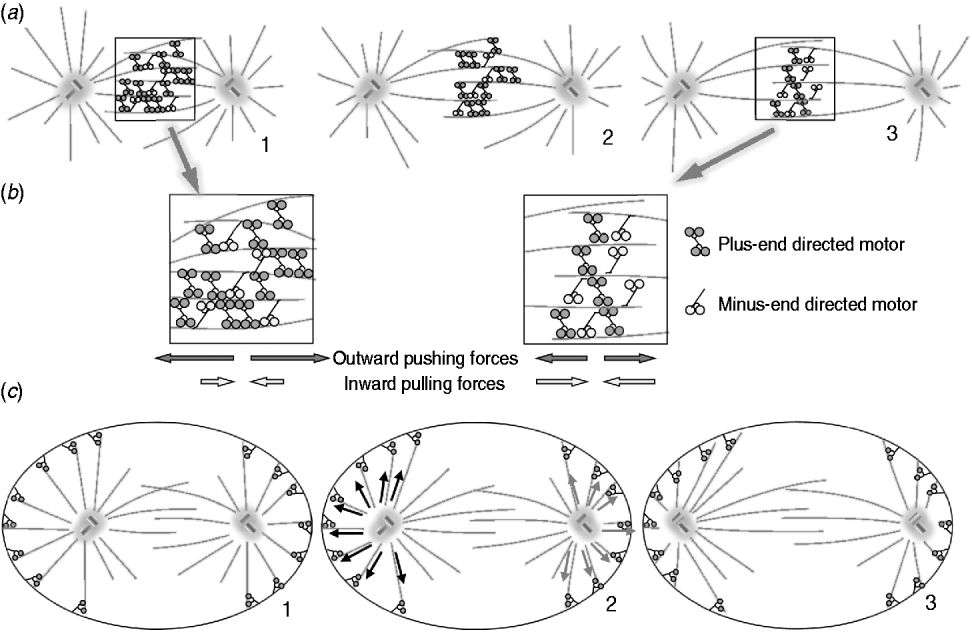
An alternative view emerges from the observation that inhibition of dynein, a minus-end-directed motor, can block centrosome separation in at least some cells. Microinjection of function-blocking anti-dynein causes the pair of adjacent centrosomes to function as a single-spindle pole and form a monopolar spindle (Vaisberg et al. Reference Vaisberg, Koonce and McIntosh1993). Insights into how this minus-end-directed motor might function in centrosome separation have come from several studies on dynein's action in vivo (Waters et al. Reference Waters, Cole and Rieder1993). Dynein can couple to actin, probably through its cellular partner, the dynactin complex. This binding tethers some dynein to the cell cortex (Dujardin & Vallee, Reference Dujardin and Vallee2002). Here, it can interact with the ends of MTs initiated by centrosomes and pull each centrosome toward the cell surface. When two vicinal centrosomes are both affected in this way, the balance of forces will help pull the centrosomes apart (Fig. 4c). A dynein-mediated mechanism of this kind has been realized in vitro, acting on a single centrosome in a shallow, cylindrical well (Laan & Dogterom, Reference Laan and Dogterom2010). The resulting forces center a single centrosome, but such pulling forces could obviously contribute to the separation of duplicate centrosomes in some systems.
2.4 Spindle formation without centrosomes
The best-studied system of acentrosomal spindle formation is found in frog oocytes. Complex biological activities persist in cell-free extracts of egg cytoplasm (Hyman & Karsenti, Reference Hyman and Karsenti1996). Sperm, sperm heads, isolated somatic nuclei, and even phage DNA can be introduced into this medium, whereupon mitotic spindles will form. When centrioles are present, e.g. from the basal bodies of sperm flagella, they organize centrosomes and form MT asters that interact with chromosomes and produce a functional spindle. When centrosomes are not present, spindles still form following a wide range of treatments. The most interesting for our purposes is the addition of chromosomes, or even naked DNA, which the egg-extract turns into chromatin by adding histones and other chromosomal proteins (Heald et al. Reference Heald, Tournebize, Blank, Sandaltzopoulos, Becker, Hyman and Karsenti1996).
In this extract chromatin binds a GTP exchange factor for the small monomeric G-protein, Ran (Carazo-Salas et al. Reference Carazo-Salas, Guarguaglini, Gruss, Segref, Karsenti and Mattaj1999; Kalab & Heald, Reference Kalab and Heald2008). On the other hand, proteins that activate RanGTPase (Ran-GAPs), thereby stimulating Ran's self-terminating hydrolytic activity, are uniformly dispersed. The result is a gradient in RanGTP, with its highest concentrations immediately around the chromosomes (Athale et al. Reference Athale, Dinarina, Mora-Coral, Pugieux, Nedelec and Karsenti2008). At least two protein factors respond to this gradient in ways that influence MT behavior. TPX2, mentioned previously as a centrosomal protein, has RanGTP-stimulated MT binding and initiating activity; it can promote MT formation without γ-tubulin (Gruss & Vernos, Reference Gruss and Vernos2004). CDK-11 is a RanGTP-stimulated, cyclin-dependent kinase that confers stability on MTs (Yokoyama et al. Reference Yokoyama, Gruss, Rybina, Caudron, Schelder, Wilm, Mattaj and Karsenti2008). Together with several MAPs, these activities lead to a centrosome-independent growth of MTs in the vicinity of chromatin (Athale et al. Reference Athale, Dinarina, Mora-Coral, Pugieux, Nedelec and Karsenti2008).
Current data show Ran-GTPase Exchange Factor distributed uniformly over the chromosomes, but the MT-initiating activity of chromosomes is stronger near kinetochores than elsewhere for reasons that are not yet well understood. This behavior was first observed by Pease, using high hydrostatic pressure to depolymerize spindle fibers, then a release of pressure to allow them to reform (Pease, Reference Pease1946). Similar results have been obtained in many ways, e.g. in cultured animal cells by the washout of a drug that poisons tubulin polymerization (Geuens et al. Reference Geuens, Hill, Levilliers, Adoutte and Debrabander1989; Witt et al. Reference Witt, Ris and Borisy1980). Earlier experiments on chromosomes in lysed cells showed that MTs formed near kinetochores, although the organization of these MTs was poor (Snyder & McIntosh, Reference Snyder and McIntosh1975). How these MTs are nucleated, how they become organized into bundles with the correct polar orientation, and how they contribute to spindle formation under normal circumstances are still unanswered questions.
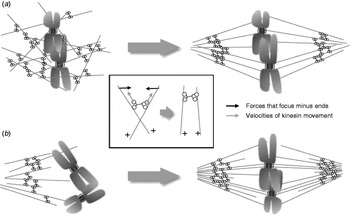
A second set of activities in frog-egg extract can reorganize the chromatin-initiated MTs into a bipolar array (Walczak et al. Reference Walczak, Vernos, Mitchison, Karsenti and Heald1998). Motor-mediated MT sliding will cluster MT minus-ends into one or a few foci (Gaglio et al. Reference Gaglio, Saredi, Bingham, Hasbani, Gill, Schroer and Compton1996). The long, fibrous protein, nuclear-mitotic apparatus (NuMA), first identified as a structural component of both nuclei and spindles, contributes to the focusing and organization of the MT minus-ends as they are clustered by dynein. When both components are present in mitotic extracts, nicely ordered asters are formed with high efficiency (Merdes et al. Reference Merdes, Heald, Samejima, Earnshaw and Cleveland2000). These structures have sufficient mechanical integrity to function as spindle poles (Charlebois et al. Reference Charlebois, Kollu, Schek, Compton and Hunt2011). When chromosomes or chromatin-binding structures are present, they often become arranged quite symmetrically near the midplane of a bipolar, spindle-shaped MT array (Hyman & Karsenti, Reference Hyman and Karsenti1996) (Fig. 5a).
Formation of acentrosomal spindles. (a) Spindle formation without centrosomes in extracts from amphibian oocytes. MTs form near chromosomes, due to protein activities regulated by RanGTP. MT-dependent motor activities then rearrange these polymers, clustering their minus-ends, so a bipolar spindle is formed. The insert shows how minus-end-directed motors that crosslink MTs can align and focuses them into pole-like structure. (b) Spindle formation without centrosomes in higher plant cells. There are regions near the nucleus where MT initiation is probable, as with centrosomes, even though no such structures are seen. In this diagram, only one such pole is shown, but in reality, MTs grow into the nuclear region from both sides. As the nuclear envelope disperses, these MTs grow into the nucleoplasm, forming a bipolar MT array in which some polymers interact directly with kinetochores.

This self-organizing behavior is so strong in frog-egg extracts that the chromosomes can be replaced by metal micro-beads. These non-physiological structures become coated with chromatin, and the system forms a bipolar spindle with the beads near its midplane (Heald et al. Reference Heald, Tournebize, Blank, Sandaltzopoulos, Becker, Hyman and Karsenti1996). The organization of the resulting MT array depends on the size of the chromatin-coated objects (Dinarina et al. Reference Dinarina, Pugieux, Corral, Loose, Spatz, Karsenti and Nedelec2009), but the noteworthy point is that a cohort of cytoplasmic activities can lead to a metaphase structure without centrosome-mediated initiation of MTs and without any specialized MTs connecting to kinetochores. Apparently the materials present in frog oocyte extracts can form a bipolar spindle simply by MT polymerization, cross-linking, and fiber rearrangement.
This acentrosomal pathway is not specific to egg cells. Most of the players in oocyte spindle formation are found in somatic mammalian cells, and extracts from cultured human cells can reproduce many of the activities described above (Chakravarty et al. Reference Chakravarty, Howard and Compton2004; Gaglio et al. Reference Gaglio, Dionne and Compton1997). Work with extracts from mitotic mammalian cells has also identified contributions from motor enzymes that are either minus-end directed (a kinesin-14 called HSET) or plus-end directed (a kinesin-5 called Eg5) (Gaglio et al. Reference Gaglio, Saredi, Bingham, Hasbani, Gill, Schroer and Compton1996). It follows that centrosome-independent pathways may contribute to spindle formation, even when centrosomes are present. This possibility is supported by the observation that centrioles can be eliminated from Drosophila by a loss-of-function mutation, yet a fly will form, albeit without cilia or flagella and with somewhat disorganized mitoses (Basto et al. Reference Basto, Lau, Vinogradova, Gardiol, Woods, Khodjakov and Raff2006). Centrosomes can also be ablated from cultured cells by laser irradiation, and again, spindles will form (Khodjakov et al. Reference Khodjakov, Cole, Oakley and Rieder2000). It is intriguing, though, that gradients of Ran-GTP are not essential for all kinds of acentrosomal spindle formation. The S-2 cell line cultured from Drosophila can form spindles when centrosome formation is blocked, as expected from the above. In this system, however, experiments with RNAi have shown that components of the Ran-GTP pathway can also be knocked down, and spindles will still form and function (personal communication, Sara Pereira, Institute for Molecular and Cell Biology, University of Porto, Portugal).
Thus, current evidence supports the view that cells can drive toward metaphase by multiple routes. The presence of convergent or overlapping pathways will reappear as we treat additional aspects of spindle function; apparently an important process, such as chromosome segregation, is not left to a single mechanism. In the context of spindle formation this redundancy suggests that the 2-fold symmetric organization of spindle components lies at a minimum on a multidimensional energy landscape. Theoretical treatments of this problem are presented and discussed below.
Acentrosomal spindles are also found in higher plants. The literature contains many careful descriptions of spindle formation in these cells, but these do not yet provide experimental details like that mentioned above. Among the best-studied plant spindles are those formed in endosperm tissue of the African Blood Lilly, Scadoxus multiflorus ssp. katherinae. Form-birefringence and fluorescent tubulin have been used to localize MTs in living cells, and labeled tubulin antibodies have localized MTs in fixed material (De Mey et al. Reference De Mey, Lambert, Bajer, Moeremans and De Brabander1982). All methods reveal a sheath of MTs that assembles during prophase around the still-patent nuclear envelope. As prophase continues, the MT cylinder disappears and is replaced by MTs running roughly parallel to the axis of the former cylinder. The latter MTs emerge from areas on opposite sides of the nucleus. Simultaneously, the nuclear envelope breaks down, and the spindle proper forms (Inoue & Bajer, Reference Inoue and Bajer1961; Smirnova & Bajer, Reference Smirnova and Bajer1994) (Fig. 5b). The prophase cylinder anticipates the spindle axis, but it seems to have little to do with spindle formation proper; the nucleus-invading MTs are the principal structural intermediate in the formation of these barrel-shaped spindles.
Plants contain γ-tubulin (Liu et al. Reference Liu, Marc, Joshi and Palevitz1993; Murata et al. Reference Murata, Sonobe, Baskin, Hyodo, Hasezawa, Nagata, Horio and Hasebe2005), though accurate protein localization in these species has been plagued by cross-reacting material, putting the specificity of immunolocalization into question; γ-tubulin seems to be distributed through much of an already-formed plant spindle; it is not obviously concentrated at the poles before spindle formation begins. Plants also contain a gene that appears to be orthologous to TPX2 (Vos et al. Reference Vos, Pieuchot, Evrard, Janski, Bergdoll, De Ronde, Perez, Sardon, Vernos and Schmit2008), so the Ran-GTP pathway may play a role in the regulation of plant spindle formation. Moreover, at least some plant chromosomes can initiate MTs, as cited above in the paper by Pease, where spindle fibers grew from kinetochores after release from treatment by high pressure.
As in animal cells, plant spindles need a kinesin-5 to form and maintain a bipolar spindle. They also use a minus-end-directed kinesin-14 to help focus MT minus-ends at the spindle poles (Bannigan et al. Reference Bannigan, Lizotte-Waniewski, Riley and Baskin2008). Given this information, it seems that acentrosomal spindle formation in plants is more like centrosomal spindle formation in animal cells than is the acentosomal spindle formation in oocytes.
2.5 Additional factors in spindle MT initiation and organization
An additional mechanism for the initiation of spindle MTs has recently been discovered. Augmin is a protein complex that binds a γ-TuRC to the wall of a preexisting MT, facilitating the initiation of new MTs alongside old ones (Goshima et al. Reference Goshima, Mayer, Zhang, Stuurman and Vale2008). This activity was first found in fruit flies, but has now been detected in a wide range of cells. One might imagine that augmin would produce a branched MT organization, analogous to that described for actin microfilaments in the cell cortex, where the Arp2/3 complex provides a mechanically analogous initiation for these protein polymers. Branched MTs are rarely seen by electron microscopy, so there is probably a release step that follows the initiation of a new MT by augmin. Note, however, that some plant spindles contain regions where MT organization resembles a ‘fir tree’ (Bajer & Mole-Bajer, Reference Bajer and Mole-Bajer1986), which may be a result of augmin or augmin-like activity. Such activity is clearly important for spindle action, because augmin knockdowns produce small, ineffective spindles (Uehara & Goshima, Reference Uehara and Goshima2010). Only why the augmin-initiated MTs make a more effective spindle is not yet clear. It may be that the accurate segregation of many chromosomes requires more MTs than can form from each centrosome, or that the MT density achieved by centrosome initiation alone is not great enough to drive chromosome motion to the metaphase plate (see below).
2.6 Other fibrous components of the mitotic spindle
Studies on spindle structure and chemistry have focused on MTs since their discovery in the early 1960s. However, other fibrous materials have also been reported as spindle components and may come to be seen as important in spindle function. Spindle actin was identified by several investigators, but it seems likely that these results were misleading; a study that used phalloidin and DNAase 1 to localize both fibrous and soluble actin, respectively, found that spindles contained only the latter (Barak et al. Reference Barak, Nothnagel, Demarco and Webb1981). Thus, on current evidence, actin is unlikely to play a significant role in bulk spindle function. Note, however, that some drugs thought to block actin function have an impact on chromosome–spindle interaction in some systems (Snyder & Cohen, Reference Snyder and Cohen1995). This case is still open, because there is not yet sufficient evidence to build a model for actin's role in spindle function.
The NuMA protein is a 236 kDa coiled-coil protein discovered in the 1980s. It redistributes from the nucleoplasm during interphase to the polar regions of the mitotic spindle during mitosis (Compton & Cleveland, Reference Compton and Cleveland1994). As described above, it contributes to the ability of dynein to organize MTs into aster-like arrays in vitro. Its contribution to spindle function depends upon extensive ADP ribosylation (Chang et al. Reference Chang, Coughlin and Mitchison2005), but its precise mechanical role is not yet defined.
Six other fibrous proteins have been found in spindles: chromator, skeletor, megator, EAST, titin, and lamin-B. In spindles of Drosophila embryos the first four of these assume the shape of the spindle and persist in that arrangement after spindle MTs have been dissolved experimentally (Qi et al. Reference Qi, Rath, Wang, Xu, Ding, Zhang, Blacketer, Paddy, Girton, Johansen and Johansen2004). Titin, the micrometer-long muscle protein, has been found in the spindles of insect spermatocytes (Fabian et al. Reference Fabian, Xia, Venkitaramani, Johansen, Johansen, Andrew and Forer2007). Lamin-B, a component of the nuclear lamina, helps spindles to form in frog-egg extracts, and it requires RanGTP, to do so (Tsai et al. Reference Tsai, Wang, Heidinger, Shumaker, Adam, Goldman and Zheng2006). Moreover, some proteins that spend interphase in association with nuclear pore complexes (and may therefore interact with lamin-B) are important for aspects of kinetochore function (Rasala et al. Reference Rasala, Orjalo, Shen, Briggs and Forbes2006). Special regions of the spindle, such as the ‘midbody’ that forms at the spindle equator in late anaphase, have also been thought to include a matrix component that contributes to their form and function (Kapoor & Mitchison, Reference Kapoor and Mitchison2001). Thus, there is a repertoire of protein components that may be important for spindle formation, at least in some cells.
At this stage in the history of understanding spindle function, the roles of all these non-MT proteins are hard to pin down. If spindles were to contain a fabric other than MTs, be it fibers or clusters of membrane components, these could be of great importance to spindle mechanics, e.g. by serving as a framework that binds the tails of MT-dependent motors. These enzymes could now interact mechanically with MTs and push them in directions defined by MT polarity. Such forces would be proportional to MT length, a property that would be of great value in getting prometaphase chromosomes to the spindle equator, as discussed below. It is therefore important for students of this subject to keep an open mind about the mitotic roles of structural proteins other than those directly associated with MTs. Given the lack of detail now available, however, these materials will not be considered further here.
2.7 Factors controlling spindle size
Cells range widely in size, and spindles are commonly scaled appropriately. A metaphase spindle in a yeast cell is only slightly longer than 1 μm, and it contains only a few dozen MTs; the spindle in a frog zygote is ~40 μm long and contains uncounted thousands of MTs. How does a cell know the appropriate size for its spindle? Some aspects of this problem are undoubtedly rooted in the amounts of various spindle proteins synthesized before mitosis, but more subtle and interesting aspects of the problem are now being uncovered. For example, spindles of related frog species can differ ~3-fold in size. When extracts are made from these different eggs, the spindles formed in vitro are similar in size to the ones formed in vivo. When such extracts are mixed, spindles of intermediate sizes are formed, suggesting the presence of control factors in the isolated ooplasm (Brown et al. Reference Brown, Blower, Maresca, Grammer, Harland and Heald2007). Certainly, MAPs can alter the mean length of MT populations, both positively and negatively, and spindle organizing proteins, such as TPX, are also important (Bird & Hyman, Reference Bird and Hyman2008; Greenan et al. Reference Greenan, Brangwynne, Jaensch, Gharakhani, Julicher and Hyman2010). How cells define spindle length, when more is involved than simply the mean MT length, is an interesting unsolved problem (for reviews, see Cai et al. Reference Cai, Weaver, Ems-Mcclung and Walczak2009b; Dumont & Mitchison, Reference Dumont and Mitchison2009a; Goshima & Scholey, Reference Goshima and Scholey2010).
2.8 In vitro systems and mathematical models for mitotic spindle formation
It is well established that MTs can be organized into astral arrays simply by adding a single type of motor enzyme to a sample of Taxol-stabilized MTs. Brain kinesin-1 induces large asters in which MT plus-ends are gathered at the center of the array (Urrutia et al. Reference Urrutia, Mcniven, Albanesi, Murphy and Kachar1991). Such rearrangements obviously require that kinesin binds at least two MTs, but in that experiment the mechanism for such coupling was unknown. More recently, asters have been formed by mixing MTs with artificial motors containing several kinesin heads, bound together by streptavidin–biotin linkages (Nedelec et al. Reference Nedelec, Surrey, Maggs and Leibler1997).
Networks of interconnected asters can form from MTs mixed with plus- and minus-end-directed motor enzymes (Surrey et al. Reference Surrey, Nedelec, Leibler and Karsenti2001). These structures showed an important difference from simple asters in that many MTs ran in approximately parallel bundles from one ‘spindle pole’ to another. In the MT bundles, polymers associated with opposite poles ran antiparallel to one another.
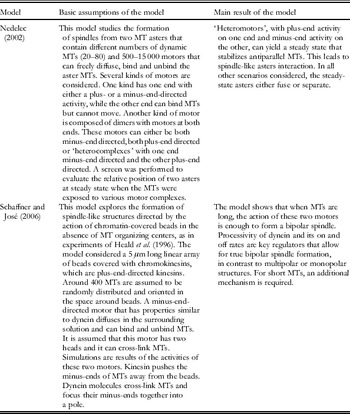
Although many processes are involved in spindle formation, these studies suggested that its essence can be realized by relatively simple mechanisms based on the action of one or a few motor protein. Such work has defined a question that has driven most of the theoretical research in this area: what components are necessary and sufficient to form a spindle-like structure from MTs? Several mathematical models have been based simply on MTs and plus- or minus-end-directed motors. In these approaches, MTs are usually represented as linear, infinitely thin, polar objects that behave mechanically like inextensible elastic rods with known flexural rigidity (Nedelec, Reference Nedelec2002). A plus- or a minus-end-directed motor is modeled as an extensible molecule with motor heads on either one or both its ends. It is free to diffuse, then bind and move along the MTs. Binding and unbinding are stochastic events governed by probabilities. Many thousands of motors are usually allowed to work simultaneously. Motor complexes with both motor heads bound exert forces on the MTs according to Hooke's law, i.e. the amount of force they generate is proportional to the extent of molecule stretching. When a head is bound, it moves along the MT at a velocity that depends inversely on the force that opposes its movement, and the relationship is usually considered to be linear, dropping to zero at the ‘stall force’.
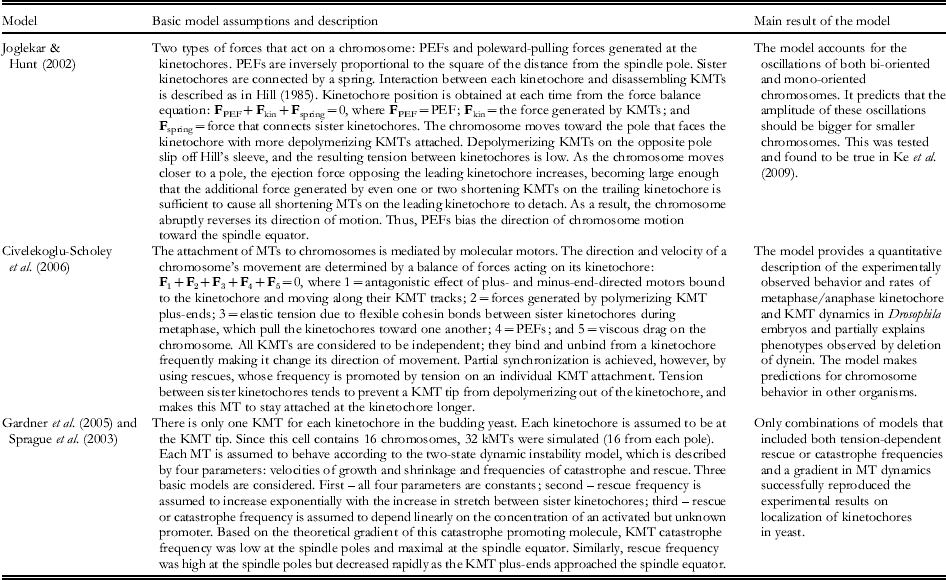
In Table 1, we summarize two important models that exemplify the formation of spindle-like structures by two distinct processes: from two MT asters (Nedelec, Reference Nedelec2002) or from randomly distributed MTs interacting with an array of beads covered with plus-end-directed motors (Schaffner & Jose, Reference Schaffner and Jose2006).
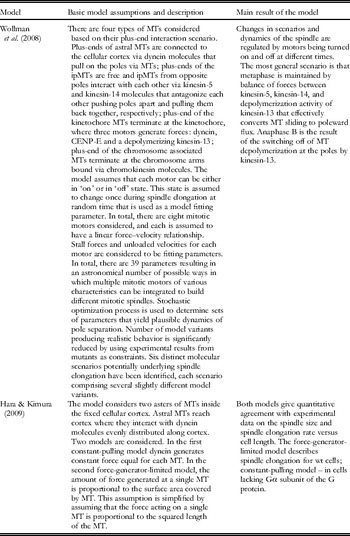
Two basic models demonstrating distinct mechanisms of spindle formation due to activities of molecular motors

The first model presents a simple and elegant mechanism for spindle formation, but it requires a ‘heteromotor’ – a protein with plus-end-directed motor activity at one end and minus-end-directed activity at the other. Such an enzyme has not yet been found in nature. Many cells contain kinesin-5s that cross-link MTs and slide them relative to one another, but both motor heads are plus-end-directed. Interestingly, however, recent research suggests that the directionality of Cin8, a yeast kinesin-5, will change when the motor is working at low density (Roostalu et al. Reference Roostalu, Hentrich, Bieling, Telley, Schiebel and Surrey2011). This capability has not yet been incorporated into a model for spindle formation.
Civelekoglu-Scholey et al. (Reference Civelekoglu-Scholey, Tao, Brust-Mascher, Wollman and Scholey2010a,b) have found that a steady-state spindle length can be maintained with known motor enzymes by opposing the activities of kinesin-5s and kinesin-14s. This result expands on Nedelec (Reference Nedelec2002), although stable spindle lengths were found at steady state within only a narrow, albeit physiological, range of motor concentrations, and the MTs had to be very dynamic. Such a regime might have been overlooked in Nedelec's work, since they also considered forces due to MT bending that are not considered in Civelekoglu-Scholey et al. (Reference Civelekoglu-Scholey, Tao, Brust-Mascher, Wollman and Scholey2010a,b). The range of motor concentrations that is successful in defining a stable spindle can be extended by adding an elastic matrix that surrounds the spindle, e.g. one that might come from one of the spindle-matrix components mentioned above.
The two papers in Table 1 are good examples of models in which a single mechanism of spindle formation is extensively characterized by computer simulations, based on reasonable premises and initial conditions. They describe plausible mechanisms for spindle formation in vivo, but as mentioned earlier, a cell is likely to use several mechanisms at one time. This complexity may provide accuracy, reliability and robustness for such an important process. A model that incorporates several mechanisms has not yet been created, but obviously models based on single mechanisms are a necessary first step: one needs to know how the separate parts of a system will function before modeling the complexity of the whole machine.
More models for spindle formation have recently been developed (Burbank et al. Reference Burbank, Mitchison and Fisher2007; Channels et al. Reference Channels, Nedelec, Zheng and Iglesias2008; Loughlin et al. Reference Loughlin, Heald and Nedelec2010). These improve our understanding of details in the mechanisms outlined above, but in our opinion, they do not add significant new insight into the mechanisms for spindle formation. For a review of these papers, see Mogilner & Craig (Reference Mogilner and Craig2010).
Available models do not, however, address the roles of other components in spindle assembly. An important question for future work is the extent to which chromosomes and kinetochore MTs contribute to the organization of a bipolar structure. Perhaps the stabilization of MTs by kinetochores would make the presence of the speculative ‘heteromotor’ unnecessary. This kind of question can be addressed mathematically; it is a good example of the ways in which further theoretical work could make a significant contribution to spindle research. An important next step for the theoretical approach to spindle formation should involve the development of more complex models that helped us to evaluate the contributions of each component to success in the overall process.
3. Attaching chromosomes to spindle MTs
3.1 Introduction
There are diverse pathways by which the MTs of a forming spindle can get access to condensing chromosomes. When centrosomes are present, they commonly lie near the nucleus, so as the envelope disperses, the MTs naturally encounter the chromosomes; attachment can ensue. In ‘closed’ spindles, which form within a nuclear envelope, the passage of soluble spindle components through the nuclear pores and their subsequent assembly within the nucleus makes spindle–chromosome interaction inevitable. In cells without centrosomes, the chromosomes participate in MT initiation, so interaction of some kind is immediate. The key to understanding chromosome–MT interaction, then, is not to see how interaction happens but to learn how sister kinetochores bind to MT associated with sister poles. We start on this question with spindles that employ centrosomes, and then tackle other systems.
3.2 Random encounters
Centrosome-initiated MTs radiated from these two foci, so some of their plus-ends inevitably enter the chromosome mass. Some dynamically unstable MTs will therefore encounter kinetochores by chance, allowing an attachment that can develop into a stable, kinetochore–MT connection without any significant chromosome motion. There is considerable cell biological evidence that MTs end on kinetochores are stabilized by this interaction. For example, KMTs are more stable than other spindle MTs to subunit dilution or to treatment with cold. Moreover, the t 1/2 for spindle MTs in general is ~30 s (Saxton et al. Reference Saxton, Stemple, Leslie, Salmon, Zavortink and McIntosh1984), while that for KMTs is >200 s (Gorbsky et al. Reference Gorbsky, Sammak and Borisy1988). Thus, the latter will naturally persist while other MTs continue rapid turnover, leading to a gradual selection of MTs that are kinetochore-bound. Experiments with isolated chromosomes have shown that the affinity of mammalian kinetochores is greatest for MT plus-ends (Huitorel & Kirschner, Reference Huitorel and Kirschner1988), so this attachment is in some sense a minimum energy configuration. In short, chromosomes ‘select’ the MTs that happen to encounter their kinetochores by chance (Kirschner & Mitchison, Reference Kirschner and Mitchison1986).
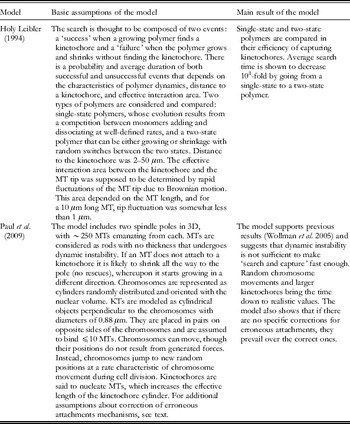
This insightful idea is widely accepted in principle, but a close look at its predictions has identified problems. Quantitative analysis predicts that the time required for dynamically unstable MTs to associate correctly with all kinetochores (92 in a human cell, more in some species, and less in others) exceeds the duration of prometaphase, suggesting that other mechanisms are at work (Holy & Leibler, Reference Holy and Leibler1994). These issues are discussed more thoroughly below, but one uncertainty in such work is that one does not know the functional size of a kinetochore. Electron microscopy reveals that kinetochores on chromosomes not yet attached to the spindle include a ‘corona’ of fibers, the composition of which is not yet identified, that extends from the obvious kinetochore (McEwen et al. Reference McEwen, Hsieh, Mattheyses and Rieder1998). This specialization probably increases the functional size of a kinetochore and increases the probability of kinetochore–MT interaction. Another ameliorating factor is the previously mentioned initiation of MTs by kinetochores, a phenomenon that has now been seen in yeast (Tanaka et al. Reference Tanaka, Mukae, Dewar, Van Breugel, James, Prescott, Antony and Tanaka2005), mammals (Maiato et al. Reference Maiato, Rieder and Khodjakov2004), and elsewhere. These MTs may further extend the function of the corona. There are, however, unanswered questions about how the polarities of kinetochore-initiated MTs conform to the pattern of MT polarity seen in fully formed spindles: plus MT ends at kinetochores (Euteneuer & McIntosh, Reference Euteneuer and McIntosh1981). In vitro the MTs that grow at kinetochores are poorly organized (Witt et al. Reference Witt, Ris and Borisy1980). In vivo the polarity of kinetochore-initiated MTs in fruit flies are normal (Maiato et al. Reference Maiato, Rieder and Khodjakov2004), but in budding yeast they are opposite (Kitamura et al. Reference Kitamura, Tanaka, Komoto, Kitamura, Antony and Tanaka2010). How these MTs interact with centrosome-initiated MTs has not yet been determined, nor is it known whether they become part of the metaphase kinetochore–centrosome connection or are simply transient structures. Nonetheless, one can imagine that either polarity of MT may accelerate the association of kinetochores with centrosome-initiated MTs.
3.3 Chromosome repositioning to increase the probability of MT encounters
The kinematics of unusual chromosomes during their attachment to the spindle is revealing about additional pathways for the chromosome attachment process. While most chromosomes in both vertebrates and plants become attached to the spindle at or near the places where they lay at the time of spindle MT initiation, a few chromosomes move poleward at speeds that exceed the rate of anaphase by >10-fold. This rapid movement appears to be the result of one kinetochore interacting with the walls of spindle MTs, rather than with their ends (Alexander & Rieder, Reference Alexander and Rieder1991). In animal cells the motion is probably driven by the motor enzyme dynein (Yang et al. Reference Yang, Tulu, Wadsworth and Rieder2007b), while in budding yeast it is a result of a kinesin-14 (Tanaka et al. Reference Tanaka, Mukae, Dewar, Van Breugel, James, Prescott, Antony and Tanaka2005). Such motility is most commonly seen with chromosomes that failed to form a bipolar or ‘amphitelic’ attachment at the onset of spindle formation, or that lay by chance at a significant distance from the spindle as it formed. It appears to be a process by which cells can bring these errant chromosomes to a place where there are many short MTs growing and shortening by dynamic instability, an environment that makes proper, end-on attachments to kinetochores more likely.
If kinetochore–MT attachment is initially with the MT wall, the chromosome will commonly change to the geometry that is more common in true metaphase: MTs ending at the kinetochore. This transition has not yet been studied well, but it probably involves the replacement of most lateral connections by end-on ones, given the dynamism of spindle MT plus-ends and the greater strength of kinetochore bonds to MT plus-ends. It may also involve the plus-end-directed motor activity that is characteristic of most kinetochores, an action that should facilitate the formation of kinetochore–MT plus-end connections. One can imagine that MT severing activities are also involved, but none of the relevant AAA ATPases has yet been localized to kinetochores. Thus, there is an important transition in the formation of proper chromosome attachments that remains to be fully understood. While some chromosomes move normally in anaphase when their kinetochores appear still to be associated with the walls of at least some MTs, end-on attachment is generally preferred. Recent descriptive work is elucidating the necessary transition by showing that individual chromosomes are not stably attached to the spindle until late prometaphase (Magidson et al. Reference Magidson, O'Connell, Lončarek, Paul, Mogilner and Khodjakov2011).
3.4 Attaching sister kinetochores to sister spindle poles
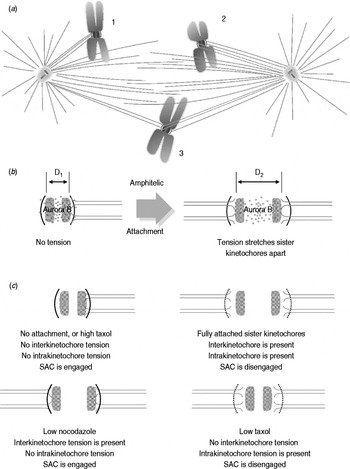
An important problem in the formation of proper chromosome–spindle connections is the establishment of ‘amphitelic’ attachment, i.e. the association of sister kinetochores with sister poles (compare Figs 2a and 6a). Careful observation has shown that attachment errors are common in early prometaphase, but most such mistakes are corrected by the time of anaphase onset. Three kinds of incorrect attachments have been identified: (1) monotelic, in which only one kinetochore has become associated with MTs, and those MTs all come from a single spindle pole; (2) syntelic, in which both kinetochores are attached to MTs associated with a single pole; and (3) merotelic, in which one kinetochore is associated with MTs from both spindle poles. Since incorrect chromosome attachment can lead to chromosome loss, a serious medical issue, the mechanisms of error correction are a subject of intense current study; they are now being reviewed on their own quite frequently (Gregan et al. Reference Gregan, Polakova, Zhang, Tolic-Norrelykke and Cimini2011; Matos & Maiato, Reference Matos and Maiato2011), so they will not be treated here in detail. Nonetheless, we can say that proper amphitelic attachments are favored by several redundant mechanisms; all may participate in achieving this essential state, perhaps with different importance in different types of cells.
(a) Kinetochores on mitotic chromosomes commonly face in opposite directions, thanks to the processes of chromosome replication and condensation; this places sister kinetochores back-to-back (Figs 2a and 3a). If one kinetochore is associated with MTs from the east pole, its sister is likely to become associated with MTs from the west.
(b) MT–kinetochore attachments are initially unstable, but when they come under tension, their stability increases. This was first demonstrated experimentally by micromanipulation of large meiotic chromosomes in grasshopper spermatocytes (Nicklas et al. Reference Nicklas, Kubai and Hays1982) and has been confirmed by a variety of less direct experiments in other systems. For example, when metaphase spindle MTs are stabilized and elongated by the addition of Taxol, some of the chromosomes detach from the spindle (De Brabander et al. Reference De Brabander, Geuens, Nuydens, Willebrords, Aerts, Demey and McIntosh1986).
Tension on sister kinetochores is a result of each MT's kinetochore attachment site experiencing a pole-directed force as soon as MT binding has occurred. Evidence for this force is seen both in the afore-mentioned migration of a monotelic chromosome toward the pole to which it is attached and in the stretching apart of sister kinetochores of amphitelic chromosomes (Nicklas, Reference Nicklas1997). A dramatic example of stabilization associated with stretching is seen in the attachment of chromosomes to pole-initiated MTs in diatoms; here chromosomes are commonly monotelically attached in early prometaphase, at which time they move irregularly toward and away from the pole to which they are attached. As soon as amphitele is achieved, each chromosome becomes so stretched that its kinetochores reach the spindle poles while the chromosome arms are still at the metaphase plate (Pickett-Heaps et al. Reference Pickett-Heaps, Tippit and Leslie1980). Experimental evidence for pole-directed forces is also seen in the response of a metaphase chromosome to micro-beam ablation of one of its kinetochores; the chromosome immediately starts moving toward the pole attached to the unirradiated kinetochore (McNeill & Berns, Reference McNeill and Berns1981). Thus, an amphitelic chromosome, which is properly attached to the spindle, is under tension; monotelic or syntelic attachments should experience less of this kinetochore-associated force. The proper arrangement of chromosomes is selected for, not directed, because improper connections are unstable while the right ones persist (Kirschner & Mitchison, Reference Kirschner and Mitchison1986).
Forming correct chromosome–spindle interactions. (a) Diagram of chromosomes that are incorrectly connected to the spindle by three different arrangements: (1) monotele, (2) syntele, and (3) merotele. (b) Model for a mechanism by which tension at the centromere might reduce the access of Aurora B kinase to substrates important for kinetochore-MT attachment (after Tanaka et al. Reference Tanaka, Rachidi, Janke, Pereira, Galova, Schiebel, Stark and Nasmyth2002). Chromosome strain in response to tension moves MT attachment sites out of the region affected by Aurora kinase activity (stippling). Each kinetochore is shown as a layered structure: the dark arc represents the outer kinetochore and shaded bar represents the inner. (c) Situations where inter- and intra- kinetochore tension can be independently controlled in vivo indicated how the SAC might sense tension within a single kinetochore and not across sister kinetochores. Kinetochores are shown in (b).

The correction of monotelic errors seems to be simply a matter of time. As long as the cell does not start anaphase too soon, the unattached kinetochore is likely to encounter dynamic MTs growing from the opposite pole and make the connections that will establish amphitele. Correction of syntele, on the other hand, requires the release of MTs associated with one or the other of the two kinetochores. The lack of tension at the kinetochores offers a plausible explanation for this instability, but now we must answer two questions: how is tension generated, and how does it promote stability? Tension generation is discussed in our section on anaphase, but one part of the mechanism has a simple, plausible solution: kinetochores bind minus-end-directed motors, like dynein in vertebrates and a kinesin-14 in fungi. These enzymes probably interact with MT walls and pull the attached kinetochore poleward, as is seen during the poleward motion of mono-oriented chromosomes in early promotaphase. If a chromosome makes an amphitelic attachment, it is pulled toward both poles at once, generating tension at the kinetochore; in monotele or syntele there is no obvious antagonistic force.
How does such tension increase the stability of MT binding? A priori, one might expect the opposite effect, since tension should make it easier for thermal motions to break the MT-kinetochore bond. The true mechanism(s) for tension-induced stability is not yet known, but several plausible ideas have been proposed. For example, if minus-end-directed motors associated with one kinetochore are trying to walk toward one pole, but motors on the sister kinetochore are walking toward the opposite pole, the motors will stretch the centromere and ultimately stall. It is easy to imagine that this will leave the enzymes in a transition state from which their MT dissociation rate is low. Thus, strain-dependent off-rate constants could contribute stability to the kinetochore–KMT connection (McIntosh et al. Reference McIntosh, Grishchuk and West2002).
A second plausible mechanism for tension-induced stability is based on the assumption that KMTs are attached to the kinetochore by their plus-ends, so chromosome motion is coupled to tubulin polymerization and depolymerization. In vitro a catastrophe, which initiates rapid MT shortening, is accompanied by outward flaring of the strands of tubulin from which the MT wall is composed, the ‘protofilaments’ (Mandelkow et al. Reference Mandelkow, Mandelkow and Milligan1991). The bent configuration of tubulin is associated with its having GDP bound, while GTP promotes a straighter tubulin dimer and hence straighter protofilaments (Wang & Nogales, Reference Wang and Nogales2005). If GDP tubulin must bend into its lower energy structure to manifest its high rate of MT dissociation, then anything that keeps protofilaments from bending will promote MT stability. A kinetochore–MT attachment to protofilaments would allow tension to inhibit protofilament bending and thus to inhibit tubulin depolymerization (Grishchuk, Reference Grishchuk2009).
Another mechanism that contributes to the instability of syntelic attachment is based on the protein kinase, aurora-B, which is localized in the vicinity of the centromere. Its substrates include proteins that help bind KMTs to kinetochores, such as the hetero–tetrameric complex, Ndc80. Protein phosphorylation by aurora-B reduces the affinity of this (DeLuca et al. Reference Deluca, Gall, Ciferri, Cimini, Musacchio and Salmon2006) and related proteins to the negatively charged surface of a MT, loosening the kinetochore–KMT connection, thereby giving the chromosome another chance to find MTs that are associated with the right pole. Indeed cells deficient in this kinase make a higher-than normal number of errors in chromosome attachment, while the stability of kinetochore–KMT attachments is enhanced by at least one protein phosphatase, PP1 (Francisco et al. Reference Francisco, Wang and Chan1994). How, then, are these activities regulated so only inappropriate connections are released? A clever model has suggested that the tension of a bipolar attachment pulls the MT-binding substrates away from aurora kinase, allowing the phosphatase to increase connection stability (Lampson & Cheeseman, Reference Lampson and Cheeseman2011; Tanaka et al. Reference Tanaka, Rachidi, Janke, Pereira, Galova, Schiebel, Stark and Nasmyth2002) (Fig. 6b). Direct evidence for this proposal has been obtained by fluorescence resonance energy transfer (FRET) (Fuller et al. Reference Fuller, Lampson, Foley, Rosasco-Nitcher, Le, Tobelmann, Brautigan, Stukenberg and Kapoor2008). It is noteworthy, however, that careful microscopy has shown that the strain important for a chromosome being ready for segregation is not an increased distance between sister kinetochores, which is comparatively easy to measure; it is strain within a kinetochore that tells the cell that this chromosome is properly attached (Khodjakov & Pines, Reference Khodjakov and Pines2010; Maresca & Salmon, Reference Maresca and Salmon2010) (Fig. 6c).
Regardless of mechanism, all these corrections and retrials take time. A few species get extra time by starting to establish bipolar spindle attachments during S-phase. Careful microscopy of budding yeast nuclei has shown that during G1, the centromeres are all close to the cell's single, nuclear envelope-associated centrosome. As DNA replication begins, they are released seriatim into the nucleoplasm, probably as the centromeric DNA of that chromosome is replicated (Kitamura et al. Reference Kitamura, Tanaka, Kitamura and Tanaka2007). At about this time, the centrosomes also duplicate, providing the two MT-initiating structures that will become the spindle poles. Attachment of the sister kinetochores that form on the duplicated centromeres can now occur with MTs growing from the two centrosomes, and they have the rest of the cell cycle to get it right.
In budding yeast as well as in cells that do not start chromosome attachment until prophase (usually hours after DNA is replicated) there is a control mechanism called the SAC, which detects unattached kinetochores and signals to delay anaphase onset until proper attachment has been achieved (Hoyt et al. Reference Hoyt, Totis and Roberts1991; Li & Murray, Reference Li and Murray1991). This function is discussed below.
Correction of merotelic attachments is more problematic because tension between multiple MT attachments is within a kinetochore, not across the centromere (from one kinetochore to its sister). These errors lead to one chromatid being pulled in two directions at anaphase, which can leave that chromosome near the spindle equator as other chromosomes segregate, so these errors too must be corrected. Again aurora B kinase is involved (Cimini et al. Reference Cimini, Wan, Hirel and Salmon2006), but just how these corrections are achieved is still uncertain. One possibility is that tension within the plane of a kinetochore activates or inactivates factors different from tension perpendicular to the kinetochore's plane (McIntosh & Hering, Reference McIntosh and Hering1991), allowing the necessary activities to loosen the KMT–kinetochore connection, offering another chance for correct attachments.
3.5 Molecular constituents of kinetochore/spindle interaction
Our knowledge of the molecules involved in establishing a proper kinetochore–MT connection has grown tremendously in the last several years. Many kinetochore components have been identified by fruitful combinations of genetics, immunology, and proteomics with molecular and cellular biology. This field is now so big that it requires a review of its own, and indeed there are many fine papers that catalogue the protein components of kinetochores in different organisms. An exhaustive list of even the reviews would take a lot of space. Here we draw attention to readable compendia on budding yeast (McAinsh et al. Reference McAinsh, Tytell and Sorger2003) and vertebrates (Walczak & Heald, Reference Walczak and Heald2008; Wan et al. Reference Wan, O'Quinn, Pierce, Joglekar, Gall, Deluca, Carroll, Liu, Yen, McEwen, Stukenberg, Desai and Salmon2009; Welburn & Cheeseman, Reference Welburn and Cheeseman2008).
In short, a kinetochore is built upon special DNA, the centromere, which is defined in part by an AT-rich nucleotide composition (albeit, in budding yeast there is a specific centromere sequence, and in other organisms there are DNA sequences that turn up frequently). Some organisms show clear evidence that the DNA in this region is modified, e.g. by methylation, leading to a mark upon the DNA that is inheritable (an ‘epigenetic’ trait). This genetic locus becomes wound around nucleosomes that contain a centromere-specific isoform of histone H3, commonly called centromere protein A (CENP-A). The loading of these nucleosomes occurs during S-phase and requires a special set of protein factors (Cleveland et al. Reference Cleveland, Mao and Sullivan2003). Chromatin that contains CENP-A can, in turn, bind additional proteins that form the ‘inner centromere’, a platform that in turn binds yet more protein complexes to form MT-binding sites. The latter include motor enzymes: kinesins that walk toward the MT plus-end (a kinesin-7 called CENP-E in mammals and one or two kinesin-8s in both mammals and yeasts), one or more kinesin that promotes MT depolymerization (kinesin-13s in mammals, a kinesin-14 in yeasts, as well as kinesin-8s in both yeasts and mammals), and motors that walk toward the MT minus-end (cytoplasmic dynein 1 in vertebrates and kinesin-14s in yeasts). When dynein is present, it is accompanied by dynactin and bound to the kinetochore through a chain of additional cofactors.
There are also at least three kinetochore protein complexes that bind MTs but are not motors: the highly conserved Ndc80 complex, which is sometimes joined by KNL1 and other proteins to form the ‘KMN network’ (Cheeseman et al. Reference Cheeseman, Hori, Fukagawa and Desai2008). Mammalian kinetochores contain the SCA complex of three MT-binding proteins (Welburn et al. Reference Welburn, Grishchuk, Backer, Wilson-Kubalek, Yates and Cheeseman2009) as well as the long fibrous protein CENP-F (also known as mitosin) (Feng et al. Reference Feng, Huang and Yen2006). In yeasts there is a hetero-decameric protein complex, called Dam1 or DASH, which can oligomerize into rings or partial rings on the MT surface (Miranda et al. Reference Miranda, De Wulf, Sorger and Harrison2005; Westermann et al. Reference Westermann, Wang, Avila-Sakar, Drubin, Nogales and Barnes2006).
Kinetochores also accumulate most of the proteins that associate with the plus-ends of growing MTs, the Tip-Associated Proteins or ‘TIPs’ (EB1, Klp170, CLASP, XMAP215, also known as Tog, etc.). These are kinetochore associated only when MTs are present, so they are probably best regarded as a special class. However, some EB1-associated proteins may be of particular importance for the formation of stable kinetochore–MT connections, e.g. the formin mDia3, which binds MTs in a phosphorylation-sensitive manner (Cheng et al. Reference Cheng, Zhang, Ahmad, Rozier, Yu, Deng and Mao2011). The presence of this actin ‘polymerase’ at kinetochores is particularly intriguing, given that XMAP215 has been shown to serve as a MT polymerase with an activity on tubulin that is analogous to formin's activity on actin (Brouhard et al. Reference Brouhard, Stear, Noetzel, Al-Bassam, Kinoshita, Harrison, Howard and Hyman2008; Widlund et al. Reference Widlund, Stear, Pozniakovsky, Zanic, Reber, Brouhard, Hyman and Howard2011). Finally, kinetochores bind several enzymes that regulate the phosphorylation of other proteins: the Aurora B kinase and its co-factors, several kinases that participate in the SAC (Mad1, Bub1, BubR1/Mad3, and MPS1), and some critically important phosphatases (PP1, PP2A).
3.6 Chromosome attachment to spindles without centrosomes
As described above, acentrosomal spindle formation in higher plants resembles the same process in centrosomal spindles, so the processes of chromosome attachment are probably quite similar too. There is not, however, enough information about these events to treat them independently here. Spindle formation in vertebrate oocytes, on the other hand, is clearly distinct, and issues of kinetochore–MT interaction must be addressed.
The RanGTP exchange factor, RCC1 appears to be associated with the entirety of a chromosome (Carazo-Salas et al. Reference Carazo-Salas, Guarguaglini, Gruss, Segref, Karsenti and Mattaj1999), suggesting that Ran-mediated MT formation will occur all over every chromosome. How, then, do MTs become associated with kinetochores to make functional spindle attachments? This question has not yet been answered by students of this pathway. One way to think about the problem, though, is to assume that additional properties of the kinetochore bias the location of MT initiation or subsequent chromosome binding. For example, the localization of aurora B kinase to the centromere may activate special processes there, and indeed there is evidence that a gradient in aurora B activity spreads out over the chromosome for surprising distances (Welburn et al. Reference Welburn, Vleugel, Liu, Yates, Lampson, Fukagawa and Cheeseman2010). Another possibility can be developed from the fact that kinetochores have a higher affinity for MT plus-ends than other MT parts (Huitorel & Kirschner, Reference Huitorel and Kirschner1988), so short MTs that grow from initiation all over the chromosomes may be captured at the kinetochore as they diffuse locally. There is ample evidence that MTs bound to kinetochores by their plus-ends can elongate by the addition of tubulin at the kinetochore, accompanied by a motion of the MT away from the kinetochore, both in vivo (Mitchison & Salmon, Reference Mitchison and Salmon1992) and in vitro (Mitchison & Kirschner, Reference Mitchison and Kirschner1985). If this process is even slightly faster than normal MT growth, it will make KMTs grow in preference to other MTs. The kinetochore-distal ends of these polymers may then be clustered by the same minus-end-directed motors known to be important for the bunching of other MTs to form asters.
Two problems in evaluating this and related proposals are the size of the spindles that form in frog ooplasm, both in vivo and in vitro (which makes detailed microscopy difficult) and the lack of an obvious kinetochore structure on chromosomes condensed in these extracts. Nonetheless, there are many students of this system, so we can hope that the necessary information will soon be forthcoming.
3.7 Models for chromosome attachment
There are two important aspects of MT–kinetochore attachment that can be analyzed mathematically: (1) how to attach all kinetochores to MT within a reasonable time and (2) how to make these attachments amphitelic. As discussed above, a successful idea of how the tips of MTs growing from centrosomes might find randomly distributed kinetochores was introduced by Kirschner & Mitchison (Reference Kirschner and Mitchison1986); they called it ‘search-and-capture’, reviewed in O'Connell & Khodjakov (Reference O'Connell and Khodjakov2007). This idea has been analyzed quantitatively, as summarized in Table 2. Dynamically instable MTs are indeed effective in searching for kinetochores, compared to polymers with a single-state dynamic; rapid transitions between periods of growth and shortening reduce search-and-capture times 1000-fold (Holy & Leibler, Reference Holy and Leibler1994). However, this work left an important question open: can this mechanism provide realistic times of attachment for tens of kinetochores distributed through 3D space? This question has now been addressed (Paul et al. Reference Paul, Wollman, Silkworth, Nardi, Cimini and Mogilner2009; Wollman et al. Reference Wollman, Cytrynbaum, Jones, Meyer, Scholey and Mogilner2005). The more recent of these models presents an advanced version of the earlier one, and it is summarized in Table 2. With some added model features search-and-capture works for a realistic number of chromosomes within an appropriate amount of time, so this result might be considered well established.
Two Models for Kinetochore Capture. One demonstrates efficiency of the ‘search-and-capture’ while the second one uses it together with additional features to explore mechanisms that provide efficient Kinetochore Capture in a cell

It is worth noting, however, that both these analyses have focused on kinetochore interactions with MT ends. Electron microscopy of prometaphase spindles in organisms with obvious kinetochores has shown that initial kinetochore–MT interactions are more commonly with MT walls (Roos, Reference Roos1973). Moreover, the most thorough study of a single kinetochore's attachment to spindle MTs in vivo found lateral attachment as the first stage in the process (Alexander & Rieder, Reference Alexander and Rieder1991). If the average length of dynamically unstable, centrosome-initiated MTs is greater than the average kinetochore–centrosome distance, then many MTs will present their sides to the randomly oriented kinetochores, greatly increasing the interaction surfaces that a kinetochore and its corona might encounter. This consideration will reduce the predicted time for attachment of all kinetochores to randomly growing, dynamically unstable MTs and may reduce the apparent need for additional mechanisms, such as the features added in Paul et al. (Reference Paul, Wollman, Silkworth, Nardi, Cimini and Mogilner2009) .
Paul et al. address the important issue of correcting errors in chromosome–spindle attachment. They assumed that syntelic attachments dissolve within seconds, following initial capture by sister kinetochores of MTs from the same pole. Amphitelic attachments, on the other hand, were postulated to be secured and able to block further captures. This mechanism improved the number of correct attachments, but the number of merotelic attachments remained great. Two possibilities for further correction were considered. First, merotelic attachments were dissolved over time, just like syntelic attachments. That brought the number of incorrect attachments down significantly, but it increased the requisite time. A second suggestion was that following capture of one MT, the chromosome rotates so the kinetochore with one MT attached now faces the pole from which that MT grew. Now its sister faces away from that pole. Moreover, chromosome arms and kinetochores were presumed to be impermeable to MTs, which impeded future attachments of the rotated kinetochore to MTs associated with the pole away from which it had turned. This mechanism proved efficient in eliminating merotelic attachments. Together with the rapid dissolution of syntelic attachments, this hypothesis brought correct capture of all kinetochores to a realistic time.
As described above, the correction of syntelic attachments depends on aurora B and is sensitive to tension at the kinetochores (Lampson & Cheeseman, Reference Lampson and Cheeseman2011). This tension in turn depends of the number of the MTs attached per kinetochores. A fair estimate of the time required to correct all syntelic attachments will require developing a mathematical model that includes an aurora B-dependent mechanism. Whether this mechanism can explain the dissolution of syntelic attachments within seconds, as suggested in Paul et al. is an important question that should be addressed. Correcting merotelic attachments is even more complex. Chromosomes do not appear to be impermeable to MTs, as suggested in Paul et al. Reference Paul, Wollman, Silkworth, Nardi, Cimini and Mogilner2009; MTs can clearly penetrate chromosome arms (McIntosh & Landis, Reference McIntosh and Landis1971), though the frequency of this event is unknown and penetration of kinetochores occurs only under non-physiological conditions (Euteneuer & McIntosh, Reference Euteneuer and McIntosh1981). This issue requires further experimental and theoretical investigation.
4. Getting prometaphase chromosomes to the spindle equator
4.1 Introduction
Most mitotic cells take the time (and expend the energy) to cluster their soon-to-be-segregated chromosome on the spindle equator before starting anaphase, the process called ‘congression’. Given that precision is all important for successful mitosis, putting all the moving objects on the same starting line makes sense. Budding yeast has been said to lack these motions (Straight et al. Reference Straight, Marshall, Sedat and Murray1997), but here chromosome stretch and motility are sufficient that the initial observation may not be right (Goshima & Yanagida, Reference Goshima and Yanagida2001). Congression is certainly common, even if not universal. Indeed, a metaphase condition will evolve over time, even with unusual meiotic chromosomes that contain an imbalance of kinetochores (Nicklas & Arana, Reference Nicklas and Arana1992), suggesting that the gathering of chromosomes on the spindle midplane has adaptive value. Here, we consider both descriptive and experimental evidence about how congression works, and then we describe models that have been proposed to explain it.
4.2 Descriptions of chromosome congression
Many chromosomes are situated about midway between the poles as the spindle begins to form, so little or no congression is necessary. Chromosomes that are not near the midplane when they become bioriented undergo a series of motions that ultimately result in their displacement to the spindle equator, producing the metaphase configuration. This is the essence of congression. These motions are along, not across nearby spindle MTs, so a bioriented chromosome is always moving one kinetochore toward the pole it faces while the sister kinetochore is moving away. Since there are pole-directed forces acting on each kinetochore, one could imagine that congression results from an imbalanced tug-of-war in which the kinetochore more distant from its pole can pull harder than its sister, leading to the metaphase condition. Early models for congression were built on just this hypothesis (Ostergren, Reference Ostergren1945, Reference Ostergren1951, Reference Ostergren1961), but careful observations in a variety of natural and experimental conditions have shown that this appealing idea is not sufficient to account for the available data.
When an amphitelic chromosome is moving, it must be experiencing an imbalance in non-viscous forces; this could result from inequality in either pulling or pushing, making it difficult to interpret observations in vivo. However, mono-oriented chromosomes on either a monopolar or a bipolar spindle also display motions toward and away from the pole with which they are associated, demonstrating that a single pole can both pull and push. Presumably, the poleward (P) or antipoleward (AP) motions of chromosomes are the result of imbalance in these forces. A hint about these forces comes from a very simple observation; when near one pole or on a monopolar spindle, chromosomes acquire a distinctive shape; while moving P, the centromere leads and the chromosome arms lag behind (Ostergren & Bajer, Reference Ostergren and Bajer1961), a structure consistent with the previously described pull at the centromere. While moving AP, however, this chromosome shape is largely maintained; the chromosome arms lead, suggesting that they are responding to a push (Rieder & Salmon, Reference Rieder and Salmon1994).
The complexity of prometaphase chromosome motions demonstrates, however, that a simple balance of pushing and pulling is not sufficient to explain congression. In many cell types, prometaphase chromosomes oscillate, a process called ‘directional instability’ (Skibbens et al. Reference Skibbens, Skeen and Salmon1993): both kinetochores switch within a very few minutes between P and AP motions. The rates of these movements are approximately constant (~1 μm/min) and depend neither on the direction of movement nor on the position in the spindle. Net displacement to the spindle midplane is achieved by changes in the durations of P and AP movements that bias chromosome position toward the equator (Ke et al. Reference Ke, Cheng and Hunt2009; Waters et al. Reference Waters, Skibbens and Salmon1996). A recent, more quantitative analysis of prometaphase chromosome oscillations in human cells shows that the speeds of oscillation and of fluctuations in sister kinetochore separation during late prometaphase and metaphase are set by MT depolymerases, e.g. a kinesin-13, whereas the periods of these motions depend on the stiffness of the mechanical linkage between sisters. Metaphase plates become thinner as cells progress toward anaphase as a result of reduced oscillation speed at a relatively constant oscillation period (Jaqaman et al. Reference Jaqaman, King, Amaro, Winter, Dorn, Elliott, Mchedlishvili, Mcclelland, Porter, Posch, Toso, Danuser, McAinsh, Meraldi and Swedlow2010).
The cohesin links between sister chromatids are stiff, but chromatin itself can be stretched; its elastic modulus in grasshopper spermatocytes is 4.3×10² Pa (Nicklas, Reference Nicklas1983). Chromatin deformation can therefore be used as a measure of tension at kinetochores and an internal standard for mitotic forces (Nicklas, Reference Nicklas1988). Subsequent work has defined the mechanical properties of chromatin even better (Poirier et al. Reference Poirier, Eroglu, Chatenay and Marko2000). The distance between sister kinetochores during congression is greater than that seen on a resting chromosome (Waters et al. Reference Waters, Skibbens and Salmon1996), indicating that oscillating sister kinetochores are under tension most of the time. The distance between sister kinetochores on mono-oriented chromosomes is again greater than that seen on unattached chromosomes, albeit to a lesser extent than with bi-oriented chromosomes. The tension on a monotelic or syntelic chromosome cannot be generated by forces on opposing kinetochores, confirming that there are other forces acting on chromosomes.
Chromosome motion during congression is coupled to the dynamics of the KMTs. In mammalian cells there are >6 MTs per kinetochore and in some plants the number of KMTs exceeds 100 (Jensen & Bajer, Reference Jensen and Bajer1973). The switch-in direction of chromosome direction implies that all these KMTs reverse their polymerization states essentially simultaneously. Moreover, when a chromosome shows directional instability, the KMTs attached to sister kinetochores must also be coordinated, so the switch from polymerization to depolymerization on one kinetochore is matched by the opposite change on its sister (Skibbens et al. Reference Skibbens, Skeen and Salmon1993). The regulation of these switches of MT dynamics is an important problem that remains poorly understood.
4.3 Perturbations of congression reveal the forces that drive the process
Ostergren suggested that the forces pulling on chromosomes were proportional to spindle fiber length (MTs were unknown at the time) (Ostergren, Reference Ostergren1945). With the discovery of spindle MTs, this idea was reformulated in terms of the length and numbers of MTs attached to each kinetochore. Experiments with grasshopper spermatocytes in meiosis undertook to change these parameters, either by making multivalent chromosomes (Hays et al. Reference Hays, Wise and Salmon1982) or by irradiating one side of a chromosome with a focused laser beam (Hays & Salmon, Reference Hays and Salmon1990). The results showed that when the number of KMTs changed, the chromosome shifted to a new equilibrium position with more short MTs balancing a few longer ones – direct support for Ostergren's hypothesis.
Data now available show, however, that this hypothesis is not sufficient to account for congression. A model based only on poleward pulling forces predicts that chromosomes on monopolar spindles should move in close to the pole. However, chromosomes on monopolar spindles behave much like those on a bipolar spindle: after a chromosome has moved close to the single pole, it switches its direction and starts moving AP (Cassimeris et al. Reference Cassimeris, Rieder and Salmon1994), confirming that a single pole can exert AP forces. Moreover, chromosomes on a monopolar spindle oscillate about a position a few micrometers from the pole, with the chromosome arms projecting away from the pole (Rieder et al. Reference Rieder, Davison, Jensen, Cassimeris and Salmon1986). To characterize these pushing forces, Rieder et al. cut the arms of mono-oriented chromosomes with a laser micro-beam. The arms (chromosome fragments that lacked centromeres) moved AP to the periphery of the cell, while the centromere-containing fragment moved closer to the pole. These AP movements required non-KMTs (Ault et al. Reference Ault, Demarco, Salmon and Rieder1991) and are said to result from ‘polar ejection forces’ (PEFs). The strength of PEFs, and thus the steady-state position of a monotelic chromosome relative to the pole, seems to depend on the density of the non-KMTs (Cassimeris et al. Reference Cassimeris, Rieder and Salmon1994). Electron microscopy of spindle cross-sections indicates that MT density is largest near the poles and decreases toward the spindle midplane (McIntosh & Landis, Reference McIntosh and Landis1971), so AP forces probably depend on position along the spindle axis. This provides an attractive mechanism for chromosome positioning at the spindle equator.
Two mechanisms for PEFs are currently considered. Growing MTs can generate pushing forces of up to 5 pN per MT by rectifying Brownian fluctuations (Laan & Dogterom, Reference Laan and Dogterom2010). Dynamically unstable, pole-initiated MTs could therefore push on chromosomes, simply by growing into the chromatin. Another possible mechanism is based on the action of kinesins that interact with chromatin. There are two of these ‘chromokinesin’: a kinesin-4 and ‘Kid’, which is a kinesin-10. These plus-end-directed, MT-dependent motor proteins associate with chromosome arms (Antonio et al. Reference Antonio, Ferby, Wilhelm, Jones, Karsenti, Nebreda and Vernos2000; Wang & Adler, Reference Wang and Adler1995) and could obviously engage with spindle MTs to generate forces pushing away from a nearby pole.
One PEF induced by a chromokinesin has been better characterized (Brouhard & Hunt, Reference Brouhard and Hunt2005). In these in vitro experiments, Kid contributed to MT binding with chromosome arms, resulting in ATP-dependent movement of MTs relative to chromosomes. The forces generated by Kid were 2–3 pN per MT, and the movements showed a peak velocity of 3.6±2.4 μm/min. These movements included frequent stalls and backward slippages, behaviors consistent with experiments in which Kid–MT interactions were characterized directly (no chromosomes present) by optical trapping (Yajima et al. Reference Yajima, Edamatsu, Watai-Nishii, Tokai-Nishizumi, Yamamoto and Toyoshima2003).
The sufficiency of chromokinesins for generating PEFs and the ability of these forces to explain congression have been examined by several kinds of experiments. When Kid was depleted from extracts of frog eggs and spindles were induced, the chromosome arms became disorganized and stretched along the length of the entire spindle, suggesting that PEFs were significantly reduced (Antonio et al. Reference Antonio, Ferby, Wilhelm, Jones, Karsenti, Nebreda and Vernos2000; Funabiki & Murray, Reference Funabiki and Murray2000). Nonetheless, the chromosomes congressed. Similar results were obtained in cultured human cells; when Kid was depleted by RNAi (Tokai-Nishizumi et al. Reference Tokai-Nishizumi, Ohsugi, Suzuki and Yamamoto2005) or inactivated by the microinjection of antibodies (Levesque & Compton, Reference Levesque and Compton2001); chromosome arms became misaligned, but congression and cell cycle progression were unaffected. Interestingly, however, chromosome oscillations were suppressed.
To find out whether pushing forces can be generated at kinetochores distinct from chromosome arms, congressing chromosomes have been severed between sister kinetochores (Khodjakov & Rieder, Reference Khodjakov and Rieder1996). If the cutting was done when the chromosome was close to the spindle equator, the P moving kinetochore always continued its motion, while its AP moving sister always stopped, suggesting that it was not experiencing a push. However, when a similar experiment was carried out on a prometaphase chromosome situated <3 μm from the pole, the AP moving kinetochore could either stop and switch to moving P, or it could continue moving AP. These results suggest that the behavior of kinetochores depends, in significant ways, on the density of MTs in their environment.
The observations summarized above have led to a hypothesis in which congression occurs as a result of both P and AP forces applied to chromosomes from both poles (Rieder & Salmon, Reference Rieder and Salmon1998). Each kinetochore is presumed to be connected to MTs from only one pole, and these are postulated to generate position-independent pulling forces. Sister kinetochores are attached to sister poles, so the pulling forces normally balance. AP forces (the PEFs) are exerted on the whole chromosome, and since these depend on the number of interactions with MT from each pole, they are position dependent and drive congression. This mechanism can explain congression in many organisms and under many conditions, but the situation in vivo appears to be even more complex, so there may be additional pathways by which chromosomes can congress.
As an example of this complexity, a kinetochore-localized kinesin-7, CENP-E, has been identified as another factor important for congression. Immunodepletion of CENP-E-arrested cells in mitosis, and eventually they died by apoptosis (Schaar et al. Reference Schaar, Chan, Maddox, Salmon and Yen1997). These cells contained some chromosomes that lay near the poles, having failed either to congress or to establish bipolar connections. Chromosomes that did biorient in these cells oscillated, but some of these failed to align on the metaphase plate, suggesting that CENP-E plays a role in congression (Putkey et al. Reference Putkey, Cramer, Morphew, Silk, Johnson, McIntosh and Cleveland2002; Wood et al. Reference Wood, Sakowicz, Goldstein and Cleveland1997). The majority of chromosomes did, however, congress properly, so CENP-E cannot be essential for the process.
It has recently been shown that even bi-orientation is not essential for congression. Chromosomes with a mature attachment to only one pole can attach laterally to the KMTs of other chromosomes and move to the spindle equator by sliding along these fibers (Kapoor et al. Reference Kapoor, Lampson, Hergert, Cameron, Cimini, Salmon, McEwen and Khodjakov2006). Notably, when CENP-E was depleted by RNAi only 15% of such chromosomes reached the equator, versus 73% in control cells; apparently CENP-E is the driver for this novel congression pathway.
4.4 Models for chromosome congression
Aspects of congression would be easy to understand if KMTs generated pole-directed forces proportional to their length and number, and several models have been suggested how this might be accomplished. For all such models, one must postulate that KMTs can lose subunits at or near the spindle poles, but since the minus-ends of at least some KMTs are uncapped by metaphase (O'Toole et al. Reference O'Toole, McDonald, Mantler, McIntosh, Hyman and Muller-Reichert2003), this proposal is plausible.
In addition, a motor must interact with KMTs along their lengths and push on some sort of support, e.g. spindle membranes or a matrix component. By this hypothesis a plus-end-directed motor whose head binds any spindle MT and whose tail binds the secondary structural component would exert a net pole-directed force on each kinetochore that is proportional to the length and number of its associated KMTs. Now the spindle equator would be a minimum energy position for the chromosomes. An alternative to this idea can be based on hypothetical interactions between KMTs and non-KMTs. Since these two MT classes in a half-spindle are parallel, generating forces through their interaction might seem to be impossible by symmetry (McIntosh et al. Reference McIntosh, Hepler and Van Wie1969). However, spindle MTs almost certainly resemble cytoplasmic MTs in being built with a lattice that includes a singularity (Mandelkow et al. Reference Mandelkow, Schultheiss, Rapp, Muller and Mandelkow1986). The ‘seam’ that runs along the MT wall in vivo (McIntosh et al. Reference McIntosh, Morphew, Grissom, Gilbert and Hoenger2009) gives them a sidedness that would allow force generation between parallel MTs, just as it happens between adjacent doublet MTs in a cilium or flagellum. In this hypothesis, a minus-end-directed motor specialized for this task would bind by its tail to the seam on KMTs, treating them as cargo; non-KMTs would serve as the substrate upon which the motor walks. Such a force-generating mechanism would again pull each KMT poleward with a force proportional to its length. The preference of this motor's tail for KMTs could be explained simply if the on-rate for its binding were slow: KMTs are more stable than non-KMTs, so only the former would persist long enough to bind a meaningful population of motor tails.
The difficulty of finding a single hypothesis that explains all evidence about congression has led to the suggestion that kinetochores are somehow ‘smart’, i.e. can sense chromosome position and adjust KMT state accordingly (Mitchison, Reference Mitchison1989a). Smart kinetochores might sense spatial gradients of either MT dynamics (Gardner et al. Reference Gardner, Bouck, Paliulis, Meehl, O'Toole, Haase, Soubry, Joglekar, Winey, Salmon, Bloom and Odde2008) or of some unknown factor. Mathematical approaches have been used extensively to try to understand either such ‘intelligence’ or the mechanisms that drive chromosomes to the metaphase plate.
First principles suggest that chromosome motion will be determined by a balance of the applied forces, implying that changes in the direction of movement and/or an alignment of chromosomes at the spindle equator will require either a spatially dependent force or a spatially dependent regulator of force generating activity. Table 3 presents three different approaches to this problem, summarizing our current understanding of the problem. Each of these models presents a simple mechanism that can explain aspects of chromosome oscillations and positioning during prometaphase. Their biggest value is that they give us a quantitative understanding of how each mechanism can contribute to chromosome congression. For a recent review of the first two models, see Vladimirou et al. (Reference Vladimirou, Harry, Burroughs and McAinsh2011).
Three Models showing different mechanisms responsible for Chromosome Congression
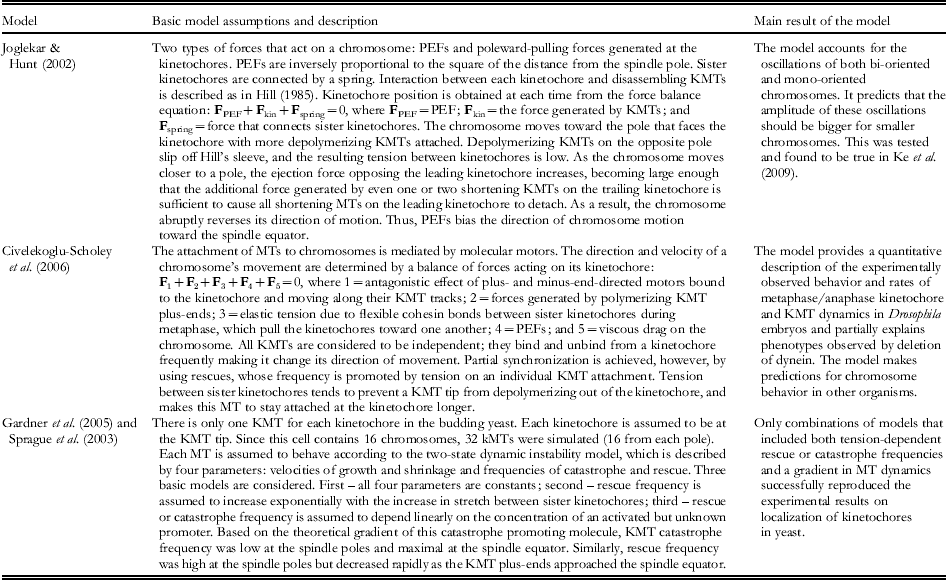
In cells, however, it is likely that these and other mechanisms work together (Kops et al. Reference Kops, Saurin and Meraldi2010). The evidence cited above shows the complexity of the phenomenology to be explained. Thus, models based on a single mechanistic premise are unlikely to survive. As with models for spindle formation, they represent a good place to start, but further work will be required to make them realistic. An advantage of the experiments in silico is that they allow one to switch pathways on and off or to alter spindle parameters, so one can see exactly how such changes affect the result. Further mathematical modeling should allow distinctions to be made between these and other possibilities, although it will require building more complex models that include more players and mechanisms.
5. Biophysical properties of the metaphase mitotic spindle
5.1 Introduction
As chromosomes attach and congress, the spindle approaches the 2-fold symmetric structure seen in textbooks. The onset of true metaphase is not well defined, given chromosome oscillations throughout prometaphase, but since chromosome alignment is pretty good in late prometaphase, and cells look ready for anaphase, such stages are generally called ‘metaphase’. This period is sufficiently constant in structure that it has provided the material for many experimental studies.
5.2 Stability of the spindle to physical perturbation
As early as the 1950s, spindles were known to be labile, because cell lysis led to their rapid dissolution. Efforts to stabilize spindles for study in a cell-free environment have gone through several phases, beginning with Mazia's pioneering work with sulfhydryl reagents, passing through the use of glycols and other water-miscible solutes (Rebhun et al. Reference Rebhun, Jemiolo, Ivy, Mellon and Nath1975), then on to the use of conditions that promote the polymerization of purified tubulin in vitro (Weisenberg & Rosenfeld, Reference Weisenberg and Rosenfeld1975). All these stabilized spindles were biochemically complex and physiologically quite inert, incapable of most of the functions that would have provided assays for the significance of their individual components. Nonetheless, several potentially interesting MAPs were found, for example (Murphy, Reference Murphy1980), and the use of Taxol as a stabilizer of MTs at high dilution led to more (Kuriyama, Reference Kuriyama1986). However, the complexity of these spindles was too great for the then-available methods for protein separation and characterization.
Spindle properties in vivo were studied to more effect. With polarization optics, the number and/or density of spindle MTs could be measured, as reviewed in Inoue & Salmon (Reference Inoue and Salmon1995), so the effects of environmental changes could be assessed quantitatively. Reductions in temperature or increases in hydrostatic pressure reduced spindle birefringence, supporting the idea that the fibrous components of spindles were stabilized by hydrophobic bonds. The data on spindle birefringence as a function of temperature were interpreted with two models for spindle assembly: one very simple but hard to reconcile with the polymerization reactions that probably accounted for spindle fiber formation (Inoue et al. Reference Inoue, Fuseler, Salmon and Ellis1975), and one based on condensation–polymerization, the then-accepted mechanism for tubulin polymerization (Salmon, Reference Salmon1975). These innovative studies provided a flavor of biophysical analysis and helped the community to pay attention to the energies and reaction parameters that are certainly important for spindle behavior in vivo, but they were frustrated by the complexity of the system they were trying to analyze with comparatively simple tools. For example, either pressure or lowered temperature could have been affecting the ionic composition of cytoplasm, inducing MT dissolution by an indirect pathway.
Early studies of spindle reformation after dissolution by high hydrostatic pressure (hundreds of bar) did provide convincing evidence that spindle fiber growth in plant cells was controlled at least in part by kinetochores (Pease, Reference Pease1946). Work with hydrostatic pressure also demonstrated that different parts of a given spindle (and different stages during spindle action) were differentially resistant to dissolution by such treatments: the MTs of the ‘midbody’ that forms in the spindle midzone during late anaphase were highly resistant to dissolution by pressure (Salmon et al. Reference Salmon, Goode, Maugel and Bonar1976). This work showed that spindle MT dynamics were a moving target, varying from place to place in the spindle and changing as mitosis proceeded.
The lability of spindle MTs in vivo was analyzed in an informative way by the use of colchicine, a tubulin-binding drug that blocks MT assembly. Rapid application of colchicine to a metaphase spindle with subsequent analysis of spindle birefringence gave the first direct evidence that spindle MT turnover is exceptionally fast (Salmon et al. Reference Salmon, Mckeel and Hays1984). Birefringence decreased within seconds of drug addition, suggesting that metaphase MTs were turning over at a remarkably high rate. This observation was confirmed and extended by studies that used fluorescent tubulin injected into living cells, followed by fluorescence photobleaching (NB: this method is commonly called fluorescence recovery after photobleaching (FRAP), but this is a misnomer; the fluorescence does not recover, it redistributes). With this assay, spindle MT turnover t 1/2 was ~30 s in mitosis and >120 s in interphase (Saxton et al. Reference Saxton, Stemple, Leslie, Salmon, Zavortink and McIntosh1984). These rates were so much faster than could be explained by the then-accepted ideas of MT assembly through condensation–polymerization that something was clearly wrong in the way spindles were being considered. The discovery of MT dynamic instability resolved this conundrum and provided a sensible way to think about spindle MT dynamics in vivo (Mitchison & Kirschner, Reference Mitchison and Kirschner1984).
5.3 Spindle dynamics as seen by local perturbations
Many investigators have recognized the value of probes that would disturb or report on the behavior of a local region within the spindle, rather than the spindle as a whole. Initial work used microbeams of ultraviolet light to reduce spindle birefringence in a small fraction of the spindle's volume (Forer, Reference Forer1965). The ensuing processes of birefringence recovery were complex and led to diverse and conflicting interpretations. A brief summary is that areas of reduced birefringence were generally repaired in a polar fashion with fibers growing into the perturbed area from the side near the kinetochores, more evidence for growth of MTs at or near the kinetochores, as seen after perturbation by high pressure.
UV microbeaming was re-instituted for a study of the mechanics of metaphase spindles in diatoms. Here, clear evidence showed that the non-KMTs that form a bundle running between the spindle poles provided mechanical support that held the spindle poles apart: irradiation of one side of the interpolar spindle led to spindle collapse, with the structure folding around its weakened side (Leslie & Pickett-Heaps, Reference Leslie and Pickett-Heaps1983). Thus, in at least some cells the pole-directed forces that act on chromosomes have a reaction counterpart in forces that act on the poles to pull them toward the metaphase plate. However, renewed efforts with this method to understand the dynamics of kinetochore MTs in bigger spindles has continued to yield complex and often contradictory results (Spurck et al. Reference Spurck, Forer and Pickett-Heaps1997). It seems likely that the distributions of resistive forces in large and small spindles are different, a problem that deserves further work.
Local spindle perturbations by micro-irradiation of non-MT spindle parts has produced more consistent results and provided insight into several aspects of spindle behavior. As mentioned above, the tension acting on each metaphase kinetochore was demonstrated by ultraviolet irradiation: a chromosome with one irradiated kinetochore moved toward the pole connected to the unirradiated kinetochore. This result was confirmed by laser irradiation of kinetochores (Skibbens et al. Reference Skibbens, Rieder and Salmon1995), and tension throughout the centromere was demonstrated by laser ablation of the chromatin between sister kinetochores; this treatment allowed both kinetochores to move poleward in metaphase, as if anaphase had already begun.
Local perturbations of spindles containing fluorescent tubulin have also revealed interesting aspects of spindle MT behavior. The MTs in a kinetochore-associated fiber turn over faster during metaphase than after anaphase has started (Gorbsky & Borisy, Reference Gorbsky and Borisy1989; Zhai et al. Reference Zhai, Kronebusch and Borisy1995). Moreover, a zone of reduced fluorescence, generated by microirradiation of metaphase KMTs, stayed in place as the chromosomes moved in anaphase, suggesting that MT dynamics at kinetochores are important for chromosome motion (Gorbsky et al. Reference Gorbsky, Sammak and Borisy1987). This result was questionable at the time, because tubulin conjugated directly to a fluorophore, such as rhodamine or fluorescein, makes MTs photolabile (Vigers et al. Reference Vigers, Coue and McIntosh1988). Several alternative approaches have, however, confirmed the finding. For example, tubulin labeled with a photoactivatable fluorophore will form spindles in vivo and can then be activated locally, so the position of the resulting zone of fluorescence can be followed over time (Mitchison, Reference Mitchison1989b). These results confirmed the rapid turnover of non-KMTs and showed that tubulin adds to metaphase KMTs at the kinetochores. Newly added subunits migrate toward the spindle poles at about 1 μm/min, a motion called ‘flux’. Moreover, a spindle can be cut with a microneedle, and MT dynamics at the kinetochore continue unperturbed (Nicklas, Reference Nicklas1989), confirming the importance of kinetochores for coupling KMT dynamics to chromosome motion.
5.4 Spindle dynamics as seen by global studies with specific reagents or tools
The special character of KMTs seems to result simply from their interaction with kinetochores, posing the question, what aspect of kinetochore structure/function can have such a marked influence on MT behavior? The formation of bundles of KMTs, known as K-fibers, depends on Ndc80, a heterotetrameric kinetochore protein complex. Knockdown of any subunit in the Ndc80 complex inhibits end-on MTs attachments and the formation of well-defined K-fibers, which results in severe defects in chromosome congression (DeLuca et al. Reference Deluca, Gall, Ciferri, Cimini, Musacchio and Salmon2006). For example, in cells whose Nuf2 subunit was knocked down, the chromosomes congressed properly in only 25% of the cells (Cai et al. Reference Cai, O'Connell, Khodjakov and Walczak2009a). But the complexity of the situation in vivo is demonstrated by the fact that when both Nuf2 and HSET (a spindle-localized kinesin-14) were knocked down at the same time, the number of cells with bi-oriented and congressed chromosomes increased to 75%. The movement of these chromosomes to the spindle equator seemed to occur by kinetochores sliding along bundles of MTs. Recent work also implicates the long, α-helical coiled-coil kinetochore protein, CENP-F (mitosin), in the formation of a stable kinetochore-MT association; knock-down by RNAi again leads to instability in chromosome attachment to the spindle (Yang et al. Reference Yang, Guo, Chen, Ding, Du and Zhu2005).
Information about the dynamics of all spindle MTs has recently been extended by using highly sensitive cameras with sufficient signal-to-noise ratio to observe spots containing only a few fluorophores per resolution element. With such a device one can follow the behavior of MTs that are sparsely labeled and appear speckled (Waterman-Storer et al. Reference Waterman-Storer, Desai, Bulinski and Salmon1998). This method allows the motions of many MTs to be followed simultaneously, demonstrating that metaphase MTs are continuously in motion, even when the spindle itself appears stable (Vallotton et al. Reference Vallotton, Ponti, Waterman-Storer, Salmon and Danuser2003; Yang et al. Reference Yang, Houghtaling, Gaetz, Liu, Danuser and Kapoor2007a). Thus, tubulin is added at the pole-distal end of each MT and is removed at or near the pole; probably every spindle MT is in flux toward the pole nearest its minus-end, albeit non-KMTs in most animal spindle turn over so fast at their dynamically unstable plus-ends that their flux is hard to see.
Speckle imaging of fruit fly spindles in which various motor enzymes have been inactivated by mutation or antibody injections has demonstrated that flux depends on the activity of kinesin-13s operating to promote MT depolymerization at or near the spindle poles (Rogers et al. Reference Rogers, Rogers, Schwimmer, Ems-Mcclung, Walczak, Vale, Scholey and Sharp2004). It seems, therefore, that flux is driven at least in part by ATP-dependent, enzymatically facilitated MT depolymerization. Other studies suggest that kinesin-5 acting in the spindle mid-region contributes to spindle MT flux in at least some systems (Brust-Mascher et al. Reference Brust-Mascher, Civelekoglu-Scholey, Kwon, Mogilner and Scholey2004). Thus, kinematics show spindle MTs to be dynamic in a polar manner, and experiments suggest that this is not simply MT ‘treadmilling’, i.e. the polymerization of tubulin at one MT end and its depolymerization at the other, as occurring in vitro (Margolis & Wilson, Reference Margolis and Wilson1981). It is a more ‘active’ process in which ATP is consumed to make the metaphase spindle into a bipolar treadmill. It must be added, however, that flux is not universal: in yeasts where the minus-ends of all spindle MTs appear to be capped by a γ-tubulin complex, flux has not been observed. Thus, it is not necessary for mitosis. Moreover, the details of flux can be surprisingly complex; in spindles formed in frog egg extracts without chromosomes the speed of MT flux is a function of position along the spindle axis (Yang et al. Reference Yang, Cameron, Maddox, Salmon and Danuser2008). This observation demands that such spindles are made from MTs that are short relative to the distance from pole-to-pole. Hypotheses for the role of flux in spindle function are considered below.
5.5 Mechanical properties of spindles
A growing spindle can elongate in spite of a force applied to impede pole separation (Hays, Reference Hays1985). The magnitude of this force has been hard to measure, given the technical difficulties of the observations, but the existence of an elongation force demonstrates that a spindle is a mechanical entity, even though it is composed of so many individual parts. However, even a metaphase spindle, which has a steady state length, is dynamic, as seen in its responses to mechanical perturbations with a micro-needle (e.g. Nicklas et al. Reference Nicklas, Kubai and Hays1982).
More recent work has extended the earlier observations. When a spindle is flattened, its structure rearranges to accommodate the perturbation and retain 2-fold symmetry (Itabashi et al. Reference Itabashi, Takagi, Shimamoto, Inoe, Kuwana, Shimoyama, Gaetz, Kapoor and Ishiwata2009). Spindles are visco-elastic for small perturbations but respond with plastic deformation to bigger ones. They are mechanically anisotropic, as suggested by their structure: axial compliance is about 10-fold less than that in orthogonal directions. The application of 4 nN will induce spindle shortening of about 1 μm. Apparently, spindle MTs will shorten in response to compressive forces, but we must also conclude that these MTs are interconnected to form a mechanical unit (Shimamoto et al. Reference Shimamoto, Maeda, Ishiwata, Libchaber and Kapoor2011).
Both the chemistry and structure of MT–MT connections in spindles are still poorly understood. There are certainly bridges between spindle MTs (Hepler et al. Reference Hepler, McIntosh and Cleland1970), and in later mitosis the MT cross-linking protein Ase1 plays an essential role in maintaining connections between MTs growing from the two spindle poles (Zhu & Jiang, Reference Zhu and Jiang2005). MT neighbor density analyses show that the relative positions of MT cross-sections are not random, even in metaphase (Mastronarde et al. Reference Mastronarde, McDonald, Ding and McIntosh1993), but the molecules that connect spindle MTs are still elusive. They are likely to be important for both the structure and mechanics of spindles, because they will help define the ease with which one spindle MT can move relative to its neighbors, a property of great importance in the motion of MT-attached chromosomes. For a thoughtful discussion on spindle fiber ‘friction’ and its role in the spindle ‘force map’, see Dumont & Mitchison (Reference Dumont, Mitchison, Goldman and Ostap2011).
Micromanipulation of chromosomes in living cells has made certain properties of spindle linkages clear: KMTs are well attached to kinetochores, albeit these connections can be broken with a firm micro-needle (Nicklas & Gordon, Reference Nicklas and Gordon1985). The force required to pull a chromosome off its KMTs increases throughout prometaphase (Nicklas & Ward, Reference Nicklas and Ward1994). KMTs are also tethered at or near the spindle pole, so a chromosome can easily be moved across the spindle, with its fiber pivoting at the pole. It is easy to push a mono-oriented chromosome closer to the pole to which it is connected, presumably by deforming its KMTs, but pulling it farther away from the pole is hard (Begg & Ellis, Reference Begg and Ellis1979). Increasing the pole-to-kinetochore distance probably requires the addition of new tubulin subunits, a comparatively slow plastic deformation.
5.6 Summary and Conclusions
The metaphase spindle is a dynamic, multi-order steady state. Dynamically unstable MTs are turning over remarkably fast at their plus-ends, allowing pole-associated MTs to explore the volume surrounding each centrosome. MTs that associate with kinetochores or anything else that slows their rate of turnover (e.g. interactions with MTs from the opposite pole) are in flux toward the spindle pole, with net tubulin addition at the pole-distal ends and net loss at or near the poles. Tubulin depolymerization at the poles is probably facilitated, if not driven, by ATP-dependent motors that modulate MT dynamics in their vicinity. Thus, metaphase spindles behave as mechanically coherent, 2-fold symmetric treadmills in which MTs are constantly migrating toward both spindle poles.
6. Biophysical aspects of spindle control
6.1 Introduction
The principal job of the spindle is clear: accurate segregation of the duplicated chromosomes. The timing and position/orientation of mitosis are, however, important issues that are subject to control. These kinds of regulation bring to our attention the biophysical problems of a cell sensing its progression through the growth and division cycle and of its perceiving how its spindle is oriented relative to organism-based coordinates.
When the spindle should act is a two-part question: (1) when should the whole process of cell division begin and (2) when is it right to start anaphase. Mitosis must not begin until after the chromosomes have been duplicated and the cell has accumulated enough material to provide the gift of macromolecules that will allow subsequent cell generations to thrive. These issues of cell-cycle control are well studied; for a brief, insightful review, see Nurse (Reference Nurse2002). However, the act of chromosome segregation is like a Rubicon for cell-cycle progression; once this boundary has been crossed, there is no turning back; this decision too must be regulated. The mechanism controlling anaphase onset is the SAC; this mechanism too has been extensively studied and reviewed, although its details are not yet well understood. Below, we sketch only the biophysical issues of anaphase control. Placement and orientation of spindles also present some biophysical issues, and these are described next.
6.2 Timing of anaphase onset
The processes of chromosome attachment and bi-orientation seem to work by selection: the correct (biologically advantageous) structures are stable while others are not. Thus, getting the last chromosome properly attached may take time. It therefore makes sense for improperly attached chromosomes to delay anaphase onset. The event of properly attaching the last chromosome could, in principle, remove this inhibitory signal and initiate the mitotic step that is irrevocable. With such a mechanism there would be no need for a sophisticated process to count the chromosomes already attached (McIntosh, Reference McIntosh1991).
Careful, descriptive work has provided support for this idea: while the duration of prometaphase in cultured mammalian cells is variable, the time between bi-orientation of the last chromosome and the onset of anaphase is comparatively precise (Rieder et al. Reference Rieder, Schultz, Cole and Sluder1994). Genetic screens have identified proteins that can delay anaphase onset when a proper chromosome attachment has not yet occurred (Hoyt et al. Reference Hoyt, Totis and Roberts1991; Li & Murray, Reference Li and Murray1991). Much of the subsequent work has shown that many of these proteins are kinetochore associated, making it comparatively easy for them to monitor the state of chromosome attachment. Thus, an SAC that assesses chromosome attachment and terminates a wait-anaphase signal as soon as that chromosome is ‘on board’ is now the widely accepted view of this kind of spindle regulation.
The pathway for SAC action is understood in principle: kinetochores on unattached chromosomes activate a protein complex that exchanges rapidly between kinetochore and cytoplasm (Howell et al. Reference Howell, Hoffman, Fang, Murray and Salmon2000); it provides a short-lived, diffusible signal that inhibits the trigger for chromosome segregation. As long as one chromosome remains unattached, this signal is continuously renewed, and anaphase is delayed. Interestingly, however, the diffusion of this signal appears to be confined to the spindle, because when two spindles inhabit the same cell, their SACs are independent (Rieder et al. Reference Rieder, Khodjakov, Paliulis, Fortier, Cole and Sluder1997).
The anaphase trigger is a protease, commonly called ‘separase’; it degrades the cohesion links between sister chromatids, allowing them to initiate anaphase motions (Wirth et al. Reference Wirth, Wutz, Kudo, Desdouets, Zetterberg, Taghybeeglu, Seznec, Ducos, Ricci, Firnberg, Peters and Nasmyth2006). A diffusible, kinetochore-activated inhibitor of this protease keeps the cell in metaphase until the last chromosome is attached, whereupon activation of the inhibitor stops, residual inhibitor degrades, proteolytic activity turns on, and anaphase can start, as reviewed in Ciliberto & Shah (Reference Ciliberto and Shah2009), Nezi & Musacchio (Reference Nezi and Musacchio2009) and Varetti & Musacchio (Reference Varetti and Musacchio2008). The two key unanswered questions here are: how does a single chromosome emit a signal strong enough to influence the entire spindle, and how does proper chromosome attachment attenuate this signal, keeping the separase inhibitor active?
The issue of signal strength cannot be approached until we know more about the chemistry by which the signal works, so it will not be discussed here. Two proposals for the relationship between chromosome attachment and signal attenuation have captured the attention of the field and merit description: (1) tension at a bi-oriented kinetochore turns off the ability of that kinetochore to activate the inhibitor (McIntosh, Reference McIntosh1991) and (2) the presence of KMTs bound at kinetochores is all that is needed to turn the activation off (Khodjakov & Pines, Reference Khodjakov and Pines2010; Yang et al. Reference Yang, Kenny, Brito and Rieder2009). Early evidence favored the tension hypothesis; the experimental application of tension to a mono-oriented chromosome allowed anaphase to begin (Li & Nicklas, Reference Li and Nicklas1995; Maresca & Salmon, Reference Maresca and Salmon2010), but subsequent work has provided support for the MT occupation hypothesis (Varetti & Musacchio, Reference Varetti and Musacchio2008). Since tension promotes the stability of KMT attachment, however, it tends to increase the number of KMTs, so distinguishing between these hypotheses is not easy, and the issue remains unsolved. Indeed, there are indications that the SAC includes two pathways, one that is silenced by tension and the other by MT occupancy (Skoufias et al. Reference Skoufias, Andreassen, Lacroix, Wilson and Margolis2001). In either case the mechanism that silences the ‘wait-anaphase’ signal involves strain at the kinetochore, be it due to the binding of additional MT ends or to the stresses that they apply.
Recent evidence suggests that the device that responds to this strain is the outer region of the kinetochore itself, not some part of the connection between sister chromatids (Maresca & Salmon, Reference Maresca and Salmon2010), so a fascinating problem in biological mechanics remains to be solved. A clue about mechanism may lie in the fact that mammalian cells show a distinct sharpening of the metaphase plate just before anaphase starts. This might reflect a change in spindle action as part of the anaphase trigger. Work that will sort this problem out is underway in several laboratories.
6.3 Control of spindle position
Spindle placement within the cell defines where the cell will divide during cytokinesis and thus the relative sizes of its daughters. In higher plants a cell will live where it is born (although its size and shape can change), so the position of cleavage at cytokinesis is critical for organism morphogenesis. In animals cell placement is less important, because daughter cells can move.
In both plants and animals the most common position of the spindle is at the cell's center, so daughter cells are of very similar sizes; the variation in volume is usually only a few percent and probably reflects the limited precision of the spindle positioning system. In some cells, however, the spindle moves toward one side of the cell before anaphase begins and cytokinesis produces cells of markedly different size. For example, the division of some embryonic cells is asymmetric, and the daughter cells differ in both size and developmental fate. The possibility of a correlation between size and fate has fascinated biologists for years and led to ideas about how physical asymmetry might be coupled to biological asymmetry. In some cases, factors that reside in the cytoplasm of this ‘mother’ cell have been shown to move to one end of the cell before division, so asymmetry in size is accompanied by asymmetry in the cytoplasmic gift that the two daughter cells inherit (Ciosk et al. Reference Ciosk, Depalma and Priess2006). These cases are of biological importance to our understanding of embryonic differentiation.
The molecular mechanisms that establish an asymmetric cell division are just beginning to be understood. There are proteins resident in the cell cortex (the gelatinous layer just inside the plasma membrane) whose positions correlate with the asymmetry of the subsequent division and are probably causal for it. These include the products of the ‘Par’ genes, which were discovered through the phenotypes of their loss of function alleles in embryonic cell divisions of worms and flies (Kemphues et al. Reference Kemphues, Priess, Morton and Cheng1988). They affect the distribution of actin and related proteins in the cell cortex, and this in turn leads to mitotic asters of different sizes, causing the spindle to shift from is customary position at the cell's center (Munro et al. Reference Munro, Nance and Priess2004).
In some plant cells, like the ones that divide to produce the cells that form the pores in a leaf (the ‘stomata’), the cell's nucleus migrates many micrometers from a central position to establish the site of future cell division (Pickett-Heaps, Reference Pickett-Heaps1969). Thus, the mechanisms that link physical and biological asymmetry at cell division are probably numerous. All such mechanisms seem to involve interactions between the spindle and the cell cortex with ensuing spindle motions. Exactly how these fascinating processes work are important problems for future work.
6.4 Control of spindle orientation
The orientation of the spindle can also be significant, both in animals and plants. For example, the spindles that form in many stem cells show consistent orientations relative to nearby markers, like a basement membrane. When the spindle axis is perpendicular to this surface, the division tends to be asymmetric and ‘differentiative’; such behavior is characteristic of cells whose divisions gives rise to one daughter that will grow and divide again while the second daughter will specialize to perform essential functions for the organisms. When the division axis is parallel to the nearby surface, mitosis is generally symmetric or ‘multiplicative’, meaning that it simply increases the number of cells present (Siller & Doe, Reference Siller and Doe2009).
In plant cells the orientation of the spindle axis is particularly important because cell walls and cell–cell adhesion block subsequent cell motion; cell division is therefore a major mechanism in plant morphogenesis (Rasmussen et al. Reference Rasmussen, Humphries and Smith2011). The mechanisms that allow a cell's neighborhood to convey information through the plasma membrane to the cytoskeleton and turn the spindle appropriately are still mysterious; they comprise additional fascinating subjects for future work.
7. Chromosome segregation at anaphase
7.1 Introduction
Anaphase is the most dramatic stage of mitosis because all the chromosomes segregate with approximate synchrony. While their speeds are slow, a time-lapse recording reveals a biological phenomenon that is truly breathtaking (see, e.g. the videos available at http://www.cellimagelibrary.org/images?basic_video=true&k=mitosis&simple_search=Search). Ironically, despite the attention that anaphase has received for >120 years, we still do not know how it works. Even the descriptions of this mitotic stage are complex, now that we can look not just at the chromosomes but at the spindle fibers themselves. This section will therefore review the relevant processes in stages, starting with kinematics and moving on to the experiments and theories that tell us something about spindle mechanics.
7.2 The kinematics of anaphase spindle components
Chromosome segregation in most organisms begins with a rather abrupt transition that is initiated by the proteolytic severing of cohesion links between sister chromatids. The ensuing separation of duplicate chromatids is sufficiently synchronous that most of the chromosomes begin their anaphase motions within seconds of one another. This precision is important for the accuracy of chromosome segregation, since a lack of synchrony would produce lagging chromosomes that might then be excluded from the nuclei that subsequently form.
Within a given cell the speed of each anaphase chromosome is rather constant. Occasionally, anaphase chromosome movements falter, so a detailed analysis shows some similarity to the oscillations of prometaphase, suggesting that the complex behaviors of earlier mitosis are still possible. However, continuous motion at a constant speed is more common. Big chromosomes move at about the same speed as small ones, so viscous drag cannot be rate limiting for speed (Nicklas, Reference Nicklas1965). It is common, however, for the chromosomes on the spindle's periphery to move a little faster than those near the spindle axis, particularly in cells with focused spindle poles. The leading edge of each chromosome set therefore becomes cup-like as it approaches the pole.
As chromosomes come near the poles, they often become slow, but at about this time the poles commonly begin separating, so the chromosome motion relative to cell-fixed coordinates continues at an essentially constant speed. The movement of chromosomes to poles and the increasing separation of the poles are called anaphases A and B, respectively; both contribute to chromosome segregation. Their timing and extent can differ considerably from one cell type to another. In many vertebrate cells the anaphases are of approximately equal extents, and in these cases, A commonly precedes B. An image of anaphase chromosomes in a typical mammalian cell is shown in Fig. 7. In many fungi with elongated cells, metaphase spindles are short, so anaphase A is brief in both time and distance. Anaphase B, on the other hand, is many times longer, leading to a final separation of the nascent nuclei that can be >15 times the length of the metaphase spindle. Since daughter nuclei often reform during this motion, its later stages have been called ‘anaphase C’. We think this additional term is unnecessary, since the mechanism for late-stage nuclear motion appears to be the same as earlier spindle elongation.
The morphology of anaphase. Electron micrograph of a mammalian cell in anaphase, showing spindle MTs during chromosome separation. This cell has also already started anaphase B. A 250-nm-thick slice from a plastic-embedded PtK1 cell that was lysed in the presence of an equilibrium mixture of tubulin and MTs, then fixed with aldehydes and OsO4, followed by staining with uranyl acetate and lead citrate and imaging in a high-voltage electron microscope. Courtesy of Mary Morphew, University of Colorado.

The kinematics of anaphase MTs is more complex than that of the chromosomes and poles, so it must be considered in parts, depending on the connections formed by the MTs under consideration. KMTs shorten to allow anaphase A. Initial work on vertebrate cells, based on a variety of methods, including the labeled tubulins described above, showed that anaphase KMTs lose subunits at their kinetochores; the term, ‘Pacman’ anaphase, was introduced to connote KMTs being consumed at their kinetochores (Mitchison et al. Reference Mitchison, Evans, Schulze and Kirschner1986).
The advent of speckle imaging, based on MTs unevenly labeled with fluorescent tubulin, has allowed a much more thorough assessment of anaphase MT movements. The site of anaphase KMT depolymerization is variable, both with time in any given cell and from one cell type to another. In mammals, initial KMT shortening is ~3/4 at the kinetochores, but in late anaphase A it becomes more rapid at the poles than at the kinetochores (Yang et al. Reference Yang, Cameron, Maddox, Salmon and Danuser2008). In blastomeres of the nematode, C. elegans, there is essentially no KMT subunit loss at the kinetochores, and almost all of anaphase is achieved by spindle elongation (Labbe et al. Reference Labbe, Mccarthy and Goldstein2004). In spermatocytes of the crane fly, Nephrotoma, the KMTs are actually adding tubulin at the kinetochores as they shorten during anaphase A, thanks to comparatively rapid depolymerization at the poles (LaFountain et al. Reference Lafountain, Cohan, Siegel and Lafountain2004). Thus, an understanding of anaphase must recognize these different strategies and accept that biological variation is significant.
The anaphase kinematics of spindle MTs that do not end on kinetochores (non-KMTs) is very different. In cells with centrosomes, e.g. most animal cells and protozoans, some non-KMTs form asters. These retain the rapid dynamic instability of metaphase, but during anaphase they commonly grow, becoming so long that they extend to the cell cortex. In animal cells these MTs somehow instruct the cytokinetic machinery where to form the furrow that will divide the cell during cytokinesis.
Other non-KMTs extend into the body of the spindle. The subset of these MTs that is shorter than ~1/2 the metaphase spindle length retains rapid dynamics. The longer non-KMTs pass the chromosomes (or occasionally penetrate them) and interact with their counterparts from the opposite pole; these ‘interpolar’ MTs (ipMTs) become stable at or shortly after the onset of anaphase (Saxton & McIntosh, Reference Saxton and McIntosh1987) and form a mechanical framework that connects the two spindle poles (McIntosh & Landis, Reference McIntosh and Landis1971). In some cells there is also an anaphase initiation of new MTs immediately behind the now-separated chromosomes (Uehara & Goshima, Reference Uehara and Goshima2010). These contribute to the number and distribution of MT in the spindle ‘interzone’, i.e. the region between the separating chromosomes. In plant cells these interzonal MTs are of particular importance because they form the ‘phragmoplast’, an array of interdigitating, antiparallel MTs that gathers Golgi-derived vesicles at the cell's midplane. These vesicles fuse to build a large, flat, membranous compartment that grows in the plane perpendicular to the spindle axis, forming the ‘cell plate’, which ultimately fuses with the plasma membrane, effecting plant cell cytokinesis (Segui-Simarro et al. Reference Segui-Simarro, Austin, White and Staehelin2004).
As anaphase proceeds, ipMT bundles in most cells become obvious by either light or electron microscopy. In many small spindles, however, one or more bundles of ipMTs is evident even before anaphase onset; in diatoms, for example, the interpolar bundle is very prominent, even in prometaphase (McDonald et al. Reference McDonald, Pickett-Heaps, McIntosh and Tippit1977). In a few cells (e.g. nematode blastomeres) such bundles are not apparent, even in late anaphase; the distance between spindle poles increases with no detectable connection between them.
As the spindle lengthens in anaphase B, the ipMTs in most cells also elongate. Micro-injection and photobleaching experiments indicate that tubulin adds to the pole-distal ends of these MTs (Masuda et al. Reference Masuda, Hirano, Yanagida and Cande1990; Saxton & McIntosh, Reference Saxton and McIntosh1987). One might think that pole-distal polymerization would simply increase the extent of ipMT overlap, but these elongating polymers slide relative to one another, so their increasing length simply enables them to slide farther without separating into unconnected sets. Mechanisms for this sliding elongation are discussed below.
7.3 Responses of anaphase A to experimental perturbations and their implications for mechanism
Many organisms, e.g. plants and insects, will grow at a wide range of temperatures, permitting a study of temperature effects on the speed of chromosome motion: the rate of anaphase A increases by a factor of 2–3 with each 10°C increase in temperature (Schaap & Forer, Reference Schaap and Forer1979). While chromosome speeds at a given temperature differ among organisms, the extent of temperature dependence is quite consistent. These data have been used to estimate the activation energy of the rate-limiting step for anaphase (assuming that it is the same at all temperatures). The average value is 17 kcal/mol consistent with the not surprising statement that chromosome speed is regulated by an enzyme.
Using an innovative form of local perturbation, Nicklas studied the effects of local temperatures on the kinetics of spindle-dependent process. Grasshopper spermatocytes were maintained on a microscope in a cool room (~17°C) but exposed to the tip of a tiny Nichrome wire that allowed local heating in chosen parts of the spindle (Nicklas, Reference Nicklas1979). The shape and magnitude of the resulting temperature gradients were assessed by several criteria, allowing confident statements about temperatures in different parts of the same spindle. Spindle birefringence responded to these gradients as expected, yielding more signal in the warmer half-spindle during both metaphase and anaphase. Surprisingly, however, the rates of anaphase in the two half-spindles were essentially the same and were defined by the temperature in the spindle interzone. If MT dynamics in these spindles resembles those in crane flies, where flux toward the poles is the major mechanism for anaphase A, then these results are compatible with the hypothesis that flux is driven by sliding motors in the zone of MT overlap (Margolis & Wilson, Reference Margolis and Wilson1981; McIntosh et al. Reference McIntosh, Hepler and Van Wie1969), and anaphase A is a result of a frictional drag between these ipMTs and the KMTs, coupled with MT depolymerization at the spindle poles.
Treatments with drugs that inhibit tubulin polymerization have not revealed any change in the rate of anaphase A, but the addition of Taxol, which stabilizes MTs and drives tubulin polymerization, can cause anaphase chromosomes to back up, suggesting that KMT depolymerization is mechanically important for anaphase A (Bajer et al. Reference Bajer, Cypher, Mole-Bajer and Howard1982).
There have been several waves of efforts to make experimental models for anaphase, based on isolated spindles or lysed mitotic cells. Conditions were then sought that would induce anaphase-like motions. Using buffers that supported tubulin polymerization in vitro, several laboratories have described quite robust spindle elongation in vitro. Lysis of comparatively stable spindles allowed the demonstration that ATP was needed for ipMT sliding (McDonald et al. Reference McDonald, Pfister, Masuda, Wordeman, Staiger and Cande1986), but informative work on anaphase A was more difficult. Some studies of lysed cells found that ATP supported chromosome-to-pole motion (Hogan et al. Reference Hogan, Wein, Wordeman, Scholey, Sawin and Cande1993), but another study obtained similar motions without ATP, simply by the addition of Ca2+, which is known to depolymerize MTs in vitro. This result was interpreted to mean that the role of ATP was simply to keep KMTs labile, perhaps by phosphorylating an MAP (Spurck & Pickett-Heaps, Reference Spurck and Pickett-Heaps1987).
More extensive and reliable chromosome motion was achieved with spindles assembled in cytoplasmic extracts of frog eggs (Murray et al. Reference Murray, Desai and Salmon1996), but even with this system, the only conclusion reached was that the speed of anaphase was similar to the speed of metaphase MT flux toward the spindle poles (Desai et al. Reference Desai, Maddox, Mitchison and Salmon1998). The complexity of all these ‘models’ has made more penetrating experiments difficult.
Genetic perturbations of spindles in vivo have provided a more informative experimental approach to mechanism, though it has taken the marriage of genetics with cell and molecular biology to get information about anaphase. Early work with mutant fungi was informative about the proteins necessary for spindle formation, as sketched above, but it helped less with anaphase, perhaps because no one has yet reported really tight, temperature-sensitive (TS) alleles of relevant mitotic components. Thus, if spindles are formed, they tended to work; if they did not form, the effect of a mutation on anaphase was not apparent.
Analogous work with fruit flies has been more informative, thanks to the better cytology of these larger spindles, the availability of some TS alleles, and the possibility of antibody micro-injection to work in parallel with conditional mutants. Even here, though, the data from different laboratories are not in good agreement. For example, one laboratory found that the perturbation of dynein after the spindles had formed slowed anaphase chromosome motion, suggesting that this minus-end-directed, kinetochore-associated motor plays a role in anaphase A (Sharp et al. Reference Sharp, Rogers and Scholey2000). Analogous effects on anaphase were obtained by RNAi of proteins like Rod, which are important for the binding of dynein to kinetochores (Yang et al. Reference Yang, Tulu, Wadsworth and Rieder2007b). On the other hand, some laboratories have found that while dynein is localized to kinetochores in early mitosis, it leaves those sites during prometaphase and is almost undetectable by late metaphase or anaphase (King et al. Reference King, Hays and Nicklas2000). Further, the disruption of dynein by other methods in other laboratories has failed to show any effect on anaphase (Goshima & Vale, Reference Goshima and Vale2003; Vorozhko et al. Reference Vorozhko, Emanuele, Kallio, Stukenberg and Gorbsky2008). Moreover, dynein is important for many cellular processes, so indirect effects from its perturbation cannot be excluded. This problem is compounded when the antigen probed by injected antibodies or the component knocked down was not dynein itself, but a protein like Rod that is important for the binding of dynein to kinetochores and other cargos as well. Thus, the case for dynein as a motor for anaphase A is still equivocal.
Certain fungi have, however, supported some quite definitive studies. The genetics of budding yeast are so well developed that students of this cell have built strains in which only one chromosome of 16 is marked for viewing by fluorescence microscopy, and the centromere of this chromosome is modified to be dysfunctional until external conditions are altered. After all the other chromosomes have progressed to a drug-induced metaphase arrest, activation of the centromere on the marked chromosome has allowed the study of a single kinetochore as it attaches to some hyper-elongated spindle MTs (Tanaka et al. Reference Tanaka, Mukae, Dewar, Van Breugel, James, Prescott, Antony and Tanaka2005). This work has provided clear evidence that a kinetochore-associated, minus-end-directed kinesin-14 (Kar3) contributes directly to chromosome-to-pole motion in this cell type. Many investigators now believe that kinetochore-localized, minus-end-directed motors drive anaphase A, at least in yeast.
In keeping with the adage that biology is never simple, however, there is convincing evidence in both fission and budding yeasts that kinetochore-localized, pole-directed motors are dispensable for normal rates of chromosome-to-pole motion (Grishchuk & McIntosh, Reference Grishchuk and McIntosh2006; Tanaka et al. Reference Tanaka, Kitamura, Kitamura and Tanaka2007). These results have led to a revival of the idea that MT dynamics might provide the machinery for mitotic movements. Consistent with this view, work in vitro has demonstrated that MT depolymerization can generate forces that are strong enough to drive anaphase A (Coue et al. Reference Coue, Lombillo and McIntosh1991; Grishchuk et al. Reference Grishchuk, Molodtsov, Ataullakhanov and McIntosh2005; Lombillo et al. Reference Lombillo, Nislow, Yen, Gelfand and McIntosh1995a). Recent work has identified and characterized several kinetochore-associated proteins that can couple MT shortening in vitro to the motion of a cargo against a load (Asbury et al. Reference Asbury, Gestaut, Powers, Franck and Davis2006; Efremov et al. Reference Efremov, Grishchuk, McIntosh and Ataullakhanov2007; Grishchuk et al. Reference Grishchuk, Efremov, Volkov, Spiridonov, Gudimchuk, Westermann, Drubin, Barnes, McIntosh and Ataullakhanov2008a).
These coupling proteins come in three classes: (1) those that oligomerize on an MT wall. This includes the Ska complex in mammals (Welburn et al. Reference Welburn, Grishchuk, Backer, Wilson-Kubalek, Yates and Cheeseman2009) and the Dam1 complex (Grishchuk et al. Reference Grishchuk, Spiridonov, Volkov, Efremov, Westermann, Drubin, Barnes, Ataullakhanov and McIntosh2008b) in fungi, which can even form rings around MTs (Miranda et al. Reference Miranda, De Wulf, Sorger and Harrison2005; Westermann et al. Reference Westermann, Wang, Avila-Sakar, Drubin, Nogales and Barnes2006); (2) fibrous protein complexes, like Ndc80 (McIntosh et al. Reference McIntosh, Grishchuk, Morphew, Efremov, Zhudenkov, Volkov, Cheeseman, Desai, Mastronarde and Ataullakhanov2008; Powers et al. Reference Powers, Franck, Gestaut, Cooper, Gracyzk, Wei, Wordeman, Davis and Asbury2009), which include one or more sites that can bind the MT lattice while another protein moiety binds components deeper in the kinetochore; and (3) motor enzymes, like a kinesin-7 or -8, which display an ATP-dependent, plus-end-directed motility on MT walls but can also follow the shortening end of a depolymerizing MT in an ATP-independent manner (Grissom et al. Reference Grissom, Fiedler, Grishchuk, Nicastro, West and McIntosh2009; Lombillo et al. Reference Lombillo, Stewart and McIntosh1995b). Thus, students of mitosis must take seriously the possibility that energy stored in tubulin polymers is an important factor in the development of forces for anaphase A (Grishchuk et al. Reference Grishchuk, McIntosh, Molodtsov, Ataullakhanov and Egelman2012; McIntosh et al. Reference McIntosh, Volkov, Ataullakhanov and Grishchuk2010).
7.4 Putting kinematics and experiments together to understand biological mechanism
Understanding mitotic motions is made even more complex by the fact that all kinetochores so far analyzed include an activity that can use ATP to enhance MT depolymerization. The most direct examples are the kinesin-13s, which localize to the inner kinetochore of mammalian chromosomes (Walczak et al. Reference Walczak, Mitchison and Desai1996; Wordeman, Reference Wordeman2005). Inactivation of these enzymes by mutation or RNAi causes chromosomes to slow down (Rogers et al. Reference Rogers, Rogers, Schwimmer, Ems-Mcclung, Walczak, Vale, Scholey and Sharp2004) or to lag behind their neighbors in anaphase (Maney et al. Reference Maney, Hunter, Wagenbach and Wordeman1998; Stout et al. Reference Stout, Rizk, Kline and Walczak2006).
Both mammalian and fungal kinetochores harbor a kinesin-8, a plus-end-directed motor that shortens MTs in vivo (Cottingham et al. Reference Cottingham, Gheber, Miller and Hoyt1999; West et al. Reference West, Malmstrom and McIntosh2002). The budding yeast kinesin-8 will also induce MT shortening in vitro (Gupta et al. Reference Gupta, Carvalho, Roof and Pellman2006), and some evidence suggests that the strength of this activity is proportional to MT length (Varga et al. Reference Varga, Helenius, Tanaka, Hyman, Tanaka and Howard2006). The kinesin-8 from fission yeast does not induce MT depolymerization in vitro but it increases the probability of MT catastrophe in vivo (Tischer et al. Reference Tischer, Brunner and Dogterom2009). Meanwhile, the evidence about mammalian kinesin-8 is conflicting (Mayr et al. Reference Mayr, Hummer, Bormann, Gruner, Adio, Woehlke and Mayer2007; Wordeman & Stumpff, Reference Wordeman and Stumpff2009).
Thus, the almost universal shortening of KMTs during anaphase A may not be due simply to solution conditions that favor tubulin depolymerization. ATP-dependent motor enzymes, instead of or in addition to solution conditions, may control anaphase tubulin depolymerization. This result is consistent with the temperature sensitivity of chromosome speeds in anaphase, which shows the high activation energy characteristic of enzyme action. Note also that the growth of non-KMTs during anaphase shows that mitotic cytoplasm at this time does not promote depolymerization of all MTs; kinetochores (and poles) must provide special depolymerizing environments, whether they depend on motor enzymes or not.
A recent advance holds promise of increasing our understanding of kinetochore–MT interaction: the study of isolated centromeres interacting with MTs in vitro (Akiyoshi et al. Reference Akiyoshi, Sarangapani, Powers, Nelson, Reichow, Arellano-Santoyo, Gonen, Ranish, Asbury and Biggins2010). Mini-chromosomes that contain little more DNA than the centromere itself have been isolated from budding yeast and attached to micro-beads that can be grasped and manipulated with a laser trap. Ongoing studies are probing the roles of specific kinetochore proteins in the properties of this interaction, including the ability of forces applied to the kinetochore to manipulate MT dynamics. This approach is likely to be fruitful in revealing the contributions of individual kinetochore components to mitotic chromosome behavior.
MT kinematics in anaphase A demonstrates that we must also consider tubulin depolymerization at the spindle poles. This phenomenon has not yet received the attention given to kinetochore-mediated MT shortening, but in the long run it may be just as important. Such motion probably does not occur in yeasts, where all spindle MTs are capped throughout mitosis (O'Toole et al. Reference O'Toole, Winey and McIntosh1999), suggesting that they do not depolymerize at the poles. Polar MT depolymerization definitely does occur in spindles from fruit flies, crane flies, mammals (see above), and probably in many other cells as well. Spindle poles contain both MT depolymerases, like the kinesin-13s, and plus-end-directed motor activities, as well as MT severing activities that could cut MTs loose from their γ-tubulin caps (Zhang et al. Reference Zhang, Rogers, Buster and Sharp2007). The evidence of such motions in anaphase is clear in some cells, but how the poles hold on to shortening MTs and help pull the chromosomes poleward remains to be discovered. This is likely to be a fruitful area for future biophysical work.
Given that some part of anaphase A is associated with MT shortening by depolymerization at the poles, there are two additional mechanical systems that must be considered: interactions among spindle MTs and between MTs and spindle matrix component(s), as mentioned in our discussion of congression. Considering first MT–MT interactions, anaphase A could result from forces generated between antiparallel ipMTs in the interzone, as suggested above: the motion of ipMTs could push on KMTs through passive MT–MT links. If coupled with MT depolymerization at the poles, anaphase A would ensue. Alternatively, anaphase A could result from force-producing interactions between KMTs and non-KMTs in the region between chromosomes and poles. The obvious question about such a mechanism is how would a motor, e.g. one that was minus-end directed, know that its cargo-binding end should associate with KMTs only? As discussed above in the section on prometaphase, KMTs are less dynamic than non-MTs. If the on-rate for tail binding by this motor were slow, it would be less likely to associate with the highly dynamic non-KMTs. The net mechanical effect would then be pole-directed forces on KMTs.
A second possibility, as with congression, is a plus-end-directed motor whose cargo-binding end interacts with spindle matrix. Now the tethered motor could push any spindle MT poleward by walking toward its plus-end. Until spindle matrix is better established and understood, however, this proposal must be viewed as highly speculative.
In summary, the anaphase motion of kinetochores along MTs may be driven in part by motor activity, in part by MT depolymerization, and in part by motors that bias MTs toward disassembly. All these factors must be considered in coming to grips not only with the biological variation of anaphase A but also with the time-dependent variation in the kinematics of chromosomes relative to KMTs.
7.5 Experimental perturbations of anaphase B and their implications for mechanism
IpMTs can contribute to anaphase B in either of two ways: (1) in diatoms, yeast and fruit flies the available evidence shows convincingly that the interpolar spindle forms a pushing engine; sliding motors, like kinesin-5, cross-bridge antiparallel MTs and push them poleward by walking toward the MT plus-ends (Fig. 4). The region where ipMTs overlap also contains Ase1, a protein of the PRC1 family that cross-links anti-parallel MTs without generating sliding forces (Janson et al. Reference Janson, Loughlin, Loiodice, Fu, Brunner, Nedelec and Tran2007). This activity helps maintain the mechanical stability of ipMT bundles, because its removal by mutation leads to a high frequency of broken spindles (Pellman et al. Reference Pellman, Bagget, Tu, Fink and Tu1995). Such MT cross-linking may also provide a resistance to sliding analogous to friction (Bormuth et al. Reference Bormuth, Varga, Howard and Schaffer2009), albeit the properties of this kind of protein bonding do not conform to some of the laws that describe macroscopic friction.
There is also evidence for minus-end-directed motor activity in the region of ipMT overlap (Hoyt et al. Reference Hoyt, He, Totis and Saunders1993; Sharp et al. Reference Sharp, Yu, Sisson, Sullivan and Scholey1999); these enzymes would provide a force antagonistic to the plus-end-directed sliding, pulling the sliding MTs back in the opposite direction. MT motion in anaphase B is therefore a result of a force balance (Brust-Mascher et al. Reference Brust-Mascher, Civelekoglu-Scholey, Kwon, Mogilner and Scholey2004; Cottingham et al. Reference Cottingham, Gheber, Miller and Hoyt1999). Additional evidence shows that the extent of anaphase B is usually greater than the initial extent of MT overlap, so MT polymerization by plus-end addition of tubulin is also involved in spindle elongation. This polymerization is likely to be permissive for motions of greater extent, not a cause for spindle elongation, because the interdigitating ipMTs have nothing for their plus-end growth to push against.
(2) A different function for ipMTs is seen in anaphase B of filamentous fungi. Here, experiments with UV micro-irradiation have shown that the interzone spindle works as a brake on the rate of spindle elongation (Aist et al. Reference Aist, Bayles, Tao and Berns1991); the dominant forces for the elongation of these spindles are pulls that come from dynein associated with the cell cortex, which interacts with astral MTs extending from the poles (Fink et al. Reference Fink, Schuchardt, Colombelli, Stelzer and Steinberg2006). An analogous scenario has been found in blastomeres of the nematode, C. elegans, where genetic perturbations of the interpolar spindle accelerate anaphase B. Here kinesin-5 works as a brake on spindle elongation (Saunders et al. Reference Saunders, Powers, Strome and Saxton2007), and anaphase B is again driven by outward pulling on astral MTs. One might imagine that such forces would again depend on dynein motors anchored at the cell cortex, but genetic evidence suggests that the pulling in these cells comes from a different mechanism (Schmidt et al. Reference Schmidt, Rose, Saxton and Strome2005).
In cells where astral MTs and cortical pulling provide the forces for anaphase B, does the interzone contribute anything important to the process? The slowing of spindle elongation by a resistance to sliding of the interzonal MTs might enhance mitotic precision, but ipMTs may also play a more important role. A variety of studies have shown that prior to cytokinesis the entire cell cortex is actin-rich and can presumably bind dynein. Though cortical pulling will always be radial, it is not otherwise oriented. The ipMTs may serve to steer the motions of the two half-spindles, so they move away from one another and cannot end up in the same daughter cell.
Cortex-based pulling is not a universal anaphase mechanism, since anaphase B is part of chromosome segregation by spindles formed in plant endosperm and egg extracts, where mechanically robust cortices do not exist. Once again, we find variation in just how a mitotic process is effected, but the result is the same: the two sets of separating chromosomes are moved far enough apart that cytokinesis will assure one complete set of sister chromosomes in each of the two sister cells.
7.6 The magnitude of anaphase forces on chromosomes
The force a spindle can exert on a single anaphase kinetochore has been measured by using calibrated micro-needles to deliver counter forces that affected the rate of pole-directed chromosome motion. The speed of anaphase A in a grasshopper spermatocyte spindle was unaffected by forces <100 pN, but above this value, chromosome speed dropped linearly to zero at a force of around 700 pN (Nicklas, Reference Nicklas1983). This is ~104 greater than would be necessary to overcome viscous drag on a chromosome moving at anaphase speeds through a medium with the viscosity of the spindle.
Structural studies on grasshopper spermatocytes have found about 15 KMTs per chromosome, so the measured anaphase force corresponds to ~47 pN/MT. A force of this magnitude could be generated by 8–10 ATP-dependent motor enzymes operating in parallel on each KMT, but it could also, in principle, be produced simply by MT depolymerization. Experimental work on forces generated by tubulin depolymerization in vitro has been interpreted to mean that a single MT can generate as much as ~50 pN (Grishchuk et al. Reference Grishchuk, Molodtsov, Ataullakhanov and McIntosh2005), the same order as the theoretical maximum, based on the idea that much of the energy from hydrolysis of tubulin-bound GTP is stored in the strain required to straighten a GDP-tubulin dimer so it will fit into the MT wall (Molodtsov et al. Reference Molodtsov, Grishchuk, Efremov, McIntosh and Ataullakhanov2005; Wang & Nogales, Reference Wang and Nogales2005). Not all workers agree with this interpretation, however, as discussed in the theory section below.
An alternative way of thinking about the generation of this high force can be built from the details of insect spindle function. KMTs in the spermatocytes of crane flies (which are distantly related to grasshoppers) are actually polymerizing at the kinetochore during anaphase A (LaFountain et al. Reference Lafountain, Cohan, Siegel and Lafountain2004). If the same should be true for grasshoppers, the motile force measured above was produced somewhere other than at the kinetochore (Dumont & Mitchison, Reference Dumont and Mitchison2009b). The measured force would then have been due to drag on KMTs as they move through the system that binds KMTs to kinetochores, not active force-production at the kinetochores themselves. Where, then, was this force generated? The effects of local heating on the rates of insect spermatocyte chromosome motion suggest that the motive force for anaphase A in these cells comes from the interzone (Nicklas, Reference Nicklas1979), consistent with the model mentioned above that forces for chromosome-to-pole motion may be generated by interdigitating ipMTs and conveyed to the KMTs through the ‘friction’ of passive cross-links.
Unfortunately, there are as yet no comparable measurements of anaphase forces in other systems, though it is generally assumed that all mitotic machines are capable of similar force production. Given that the rapid flux of anaphase KMTs in crane flies is unusual, there is a significant need for comparable measurements of stall forces on chromosomes in other systems to make sure that other spindles are as strong as the one that has been described. Regardless of mechanism, however, the presence of such a powerful force-generating system implies the existence of a governor that either limits force generation until chromosome speed is slowed or defines the rate of chromosome movement, even when the load is low. When MT-dependent motor enzymes were first proposed as an origin of mitotic forces, MT dynamics were suggested as the governor for movements (McIntosh et al. Reference McIntosh, Hepler and Van Wie1969). Now that tubulin depolymerization is being considered as a source for mitotic forces, this suggestion becomes more complex. Something other than viscous drag is clearly limiting the rate of chromosome motion, but both the chemistry and the physics of the regulatory device remain to be determined.
7.7 Mathematical models for anaphase
To initiate anaphase, sister chromatids are cut from one another by separase. The ensuing chromosome-to-pole motion is likely to be driven by a subset of the mechanisms that drove chromosomes during congression. In fact most of the models discussed in section D will produce anaphase A if sister chromatids are artificially cut in metaphase, a fortunate situation, since experimental severing of a metaphase chromosome does induce anaphase-like behavior in each chromatid. For mathematical formulations of these mechanisms, see Table 3 from section D. Note, however, that the anaphase kinematics presented above makes it clear that one must consider more than simply kinetochore-mediated force generation; pole-localized mechanical processes and perhaps action in the interzone are also relevant, so all existing models will need expansion to deal with the realities of biological diversity.
Spindle elongation (anaphase B) is driven by mechanisms different from those of anaphase A. Several groups are taking a mathematical approach to analyze the balance of forces described above (Civelekoglu-Scholey & Scholey, Reference Civelekoglu-Scholey and Scholey2010a,Reference Civelekoglu-Scholey, Tao, Brust-Mascher, Wollman and Scholeyb; Wollman et al. Reference Wollman, Civelekoglu-Scholey, Scholey and Mogilner2008). Key components for such work include asters that interact with each other and the cell cortex via molecular motors. Such motors exert pulling and pushing forces on spindle MTs, resulting in displacements of the spindle poles. One of the best-studied examples of these phenomena is found in Drosophila embryos. When these large, multinucleate cells enter mitosis, their peripheral region contains an almost cylindrical shell that harbors several hundred mitotic spindles, each ~10 μm long and located just under the cell surface. The cell cortex or other external factor cannot be limiting to the spindle elongation here, so the length of the spindle must be controlled by intrinsic, spindle-associated mechanisms, reviewed in Goshima & Scholey (Reference Goshima and Scholey2010). Here, as elsewhere, key roles are played by kinesin-5 and -14, molecules that cross-link and slide anti-parallel ipMTs at the spindle midzone, acting outward or inward, respectively (Peterman & Scholey, Reference Peterman and Scholey2009), although other factors, like MT flux, must contribute. For mathematical formulations of these models, see Table 4, which summarizes two models describing spindle elongation via two distinct mechanisms: one in which pole separation is driven mainly by the action of kinesins that cross-link ipMTs, and another where the key role is played by cortex-associated dyneins.
Two Models for Spindle Elongation with distinct mechanisms in different organisms

8. Perspective
This account of mitotic phenomenology is far from complete, but the examples chosen should serve to whet the appetite of any curious biophysicist. Mitosis contains many fascinating problems concerning the roles of nanomachines in biomechanics. The current accounts of spindle parts and the properties of these components provide many factual constraints on rigorous modeling efforts, and the data on spindle behavior under various experimental conditions provide a sound initial test-bed for many model predictions. At the same time, the mechanical properties of spindle components, like kinetochores and centrosomes, are beautiful subjects for advanced experimental work. We hope that this account will help draw new talent to the field and stimulate exciting work.
9. Acknowledgements
We thank Tom Hays, Claire Walczak, Tomo Tanaka, and Sophie Dumont for their careful readings of the manuscript and fruitful suggestions for its improvement. Mary Morphew and Eileen O'Toole provided images for Figs 3 and 7. The work from our laboratories described here was supported by grants from the NIH (GM033787) and ACS to JRM, from Civilian Research and Development Foundation (CGP2006B#2863) to JRM and FIA, and from the MBC, Russian Academy of Sciences to FIA.