

Introduction
At more than 2,000 species, ophiuroids constitute the largest extant echinoderm class (O'Hara et al., Reference O'Hara, Hugall, Thuy and Mousalli2014; Stöhr et al., Reference Stöhr, O'Hara and Thuy2017). In the fossil record, however, ophiuroids are relatively uncommon fossils, because they are weakly articulated, Type 1 echinoderms (Brett et al., Reference Brett, Moffat, Taylor, Waters and Maples1997) that rapidly disaggregated into hundreds of plates upon death. Moreover, because most of these plates are the hydrodynamic equivalents of sand, they are widely transported or further comminuted. Fossil ophiuroids first appear in the Lower Ordovician rocks of Europe (Thoral, Reference Thoral1935; Spencer, Reference Spencer1951), and perhaps > 100 fossil genera are known, mostly from individual specimens. Here, we report a new Late Mississippian ophiuroid species from limestones of the Ramey Creek Member of the Slade Formation (Ettensohn et al., Reference Ettensohn, Rice, Dever and Chesnut1984) in northeastern Kentucky, USA (Figs. 1–3), which extends the range of the genus. Although generally poorly preserved because of silicification, 39 individuals were collected, and from all of these individuals, it has been possible to piece together the most important parts of the organism's external morphology. With so many specimens, it has been possible to distinguish probable ophiuroid life stages and demonstrate relationships between average arm length, disk perimeter, and disk area. What makes the occurrence unique is the fact that the species was a part of four apparently contiguous, echinoderm-rich communities, which might be related to various environmental parameters. As a result, several environmental and ecological conditions are suggested that likely contributed to the species’ presence.
Location map of the Valley Stone Quarry in Carter County, Kentucky. The dashed area represents the approximate quarried area (0.17 km2) from which the 39 ophiuroid specimens were collected. Map after USGS (2016).

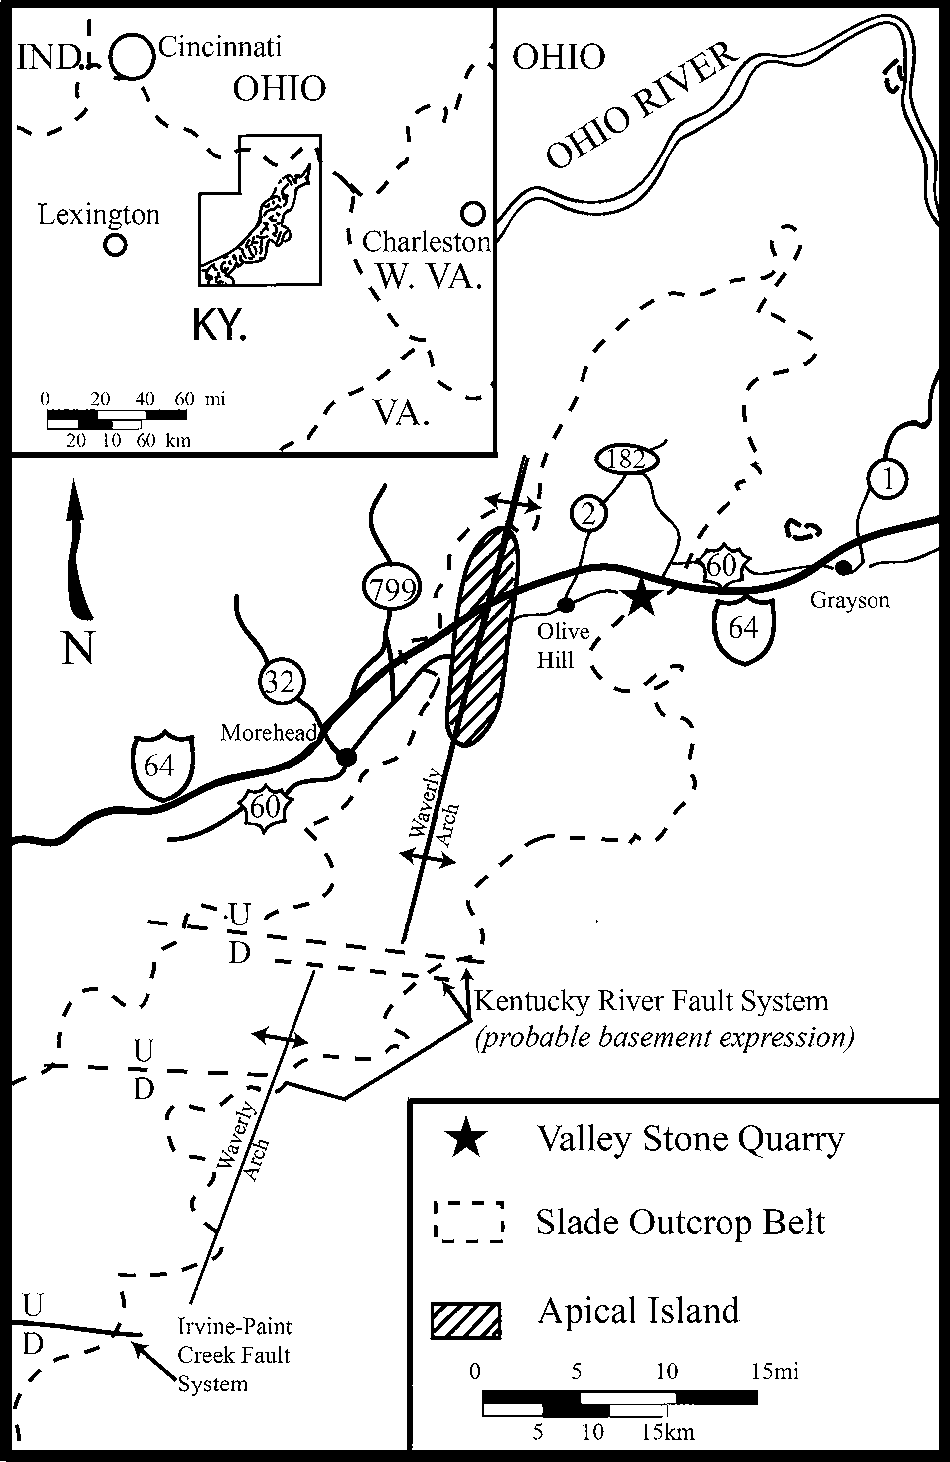
Map showing the Mississippian outcrop belt along the Cumberland Escarpment in northeastern Kentucky. The Valley Stone Quarry (black star) is located on the northern uplifted block of the Kentucky River Fault System (adapted from Ettensohn, Reference Ettensohn and Neathery1986).

Detailed stratigraphic section from the Valley Stone Quarry, Carter County, Kentucky study area. The Ramey Creek Member is the focus of this study. The thick calcarenite bed in the middle of the member represents a shallow-water shoal in the midst of deeper, basinal environments (see Fig. 4) (adapted from Lierman et al., Reference Lierman, Ettensohn and Mason2011).

Geologic setting
Thirty-nine ophiuroid specimens were collected by F.R. Ettensohn in the early 1970s from the former Olive Hill Ken-Mor Quarry locality, now known as the Valley Stone Quarry, in Carter County, Kentucky (Fig. 1); the quarry is now infilled and inaccessible. Samples from the Valley Stone Quarry include five different echinoderm classes along with several other invertebrate and vertebrate (class Chondrichthyes) phyla collected on 136 slabs. Chondrichthyian fossils include isolated teeth and dermal plates, which do not reflect entire organisms and could not be tallied in the same way as other fossil individuals.
The ophiuroids are included on 18 slabs along with several loose specimens. Most of the specimens are silicified and not well preserved, but preservation is good enough to measure disk and arm dimensions. In a few partially silicified specimens, preservation is sufficient to discern specific plate morphology. Sixteen of the specimens are preserved in ventral (oral) aspect and 23 in dorsal (aboral) aspect.
Overall, echinoderm-bearing rocks in the quarry were probably present across several facies in an area > 0.2 km2 (0.1 mi2) (Fig. 1). The specimens come from the Ramey Creek Member of the Slade Formation, which is an upper Middle (upper Osagean–Meramecian) to Upper (middle Chesterian) Mississippian (Viséan–Lower Serpukhovian), shallow-water carbonate unit, 55–65 m thick (Ettensohn et al., Reference Ettensohn, Rice, Dever and Chesnut1984; Ettensohn, Reference Ettensohn, Greb and Chesnut2009), deposited on the western margin of the Appalachian Basin, in what is today the Cumberland Escarpment outcrop belt in northeastern Kentucky (Fig. 2). The Ramey Creek Member occurs in the upper part of the Slade Formation (Fig. 3) and represents a shallow, open-marine setting on an eastward-dipping ramp in a late early to middle Chesterian (Gasperian–Hombergian; early Serpukhovian) transgressive sequence (Ettensohn, Reference Ettensohn and Roberts1981; Ettensohn et al., Reference Ettensohn, Johnson, Stewart, Solis, White and Smath2004) at ca. 328 Ma (Davydov et al., Reference Davydov, Korn, Schmitz, Gradstein, Ogg, Schmitz and Ogg2012). In this setting, deposition is interpreted to have occurred across an array of tide- and wave-influenced shoals and intervening basins, with modern analogs in the Persian Gulf (e.g., Kassler, Reference Kassler and Purser1973). Skeletal sands were deposited on the shoals, whereas calcareous mud and silt, as well as argillaceous muds, predominated in the deeper intervening basins (Ettensohn, Reference Ettensohn1975, Reference Ettensohn, Dever, Hoge, Hester and Ettensohn1977, Reference Ettensohn and Neathery1986). Argillaceous calcarenites and nodular calcilutites with interbedded shales and mudstones represent basinal deposition below wave and tidal influence, whereas well-washed, cross-bedded, skeletal calcarenites represent deposition on shoals near wave base or in storm-generated backflow currents from the shoals (Fig. 4). The lithofacies and features noted here are very similar to those storm-related lithofacies described by Aigner (Reference Aigner, Einsele and Seilacher1982) as proximal (shoals) and distal (basinal) tempestites in the Triassic, shallow-marine, upper Muschelkalk carbonates of Germany. Moreover, the area was present in a major storm belt during Mississippian time (Marsaglia and Klein, Reference Marsaglia and Klein1983).
Schematic reconstruction of the interpreted, shallow, open-marine, Ramey Creek environmental continuum that developed seaward of the Tygarts Creek sandbelt, based on lithologies at the Valley Stone Quarry (Fig. 3). Blue wavy line at top reflects sea level; the red dashed line reflects approximate normal wave base. Different colors represent different interpreted depositional environments for each lithofacies. Inset figures at the top show likely organism communities for each environment. Organism rank and abundance in the inset figures reflect species frequency of Harris (Reference Harris2018). Diagram in lower panel emphasizes organisms at a larger scale than the environments in which they lived.

At the Valley Stone Quarry locality, the Ramey Creek Member is 4.7 m thick and exhibits four lithofacies that reflect distinct depositional environments (Fig. 4). The coarse-grained calcarenite lithofacies represents shoal environments; the coarse-grained argillaceous calcarenites represent shoal-margin environments; the fine-grained calcarenites and interbedded calcilutites reflect transition areas into the basins; and the argillaceous calcilutite and shale lithofacies reflect the deeper basinal environments (Fig. 4) (Harris and Ettensohn, Reference Harris and Ettensohn2017; Harris, Reference Harris2018). Although these lithofacies typically occur in vertical sequence, based on Walther's Law, at any one time and place, these facies represented laterally juxtaposed environments (e.g., Boggs, Reference Boggs2006) as shown in Figure 4. Ophiuroid fossils occur across all lithofacies (Fig. 5).
Percentage occurrence of ophiuroids by depositional environments in the Ramey Creek Member of the Slade Formation at the Valley Stone Quarry. See Table 1 for the number of ophiuroids by life stage in each environment, and Table 6 for the total number of tallied fossil specimens per environment.

Materials and methods
Specimens were collected from loose quarry debris over a number of years, and many occur in large slabs. Slab lithologies were identified and placed into the appropriate Ramey Creek Member lithofacies, which were interpreted to represent four different, shallow, open-marine depositional environments based on lithology, fossils, and sedimentary features (Harris, Reference Harris2018). The ophiuroids and all associated fauna were identified to genus or species level and tallied by lithofacies; slab areas and specimen tallies, which totaled 1,894 specimens, were used to calculate ordinal measures of abundance and community density (Harris, Reference Harris2018). Important ophiuroid specimens were photographed using standard procedures, University of Kentucky numbers were assigned, and measurements of arm lengths and disk margins were made. These dimensional parameters were then statistically analyzed for significance, using F- and t-tests in Minitab Statistical Software 18 (Minitab, Inc., 2018). Minitab was also used to calculate means, standard deviations, confidence intervals, Pearson's r and r2, and regression lines in determining the relationships between average arm length, disk area, and disk perimeter (see Franzblau, Reference Franzblau1958; Triola, Reference Triola2018); Microsoft Excel was used to generate the pie chart (Fig. 5). Data and assumptions used for F- and t-tests are presented in Tables 1–5, and the terminology is based largely on Spencer and Wright (Reference Spencer, Wright and Moore1966).
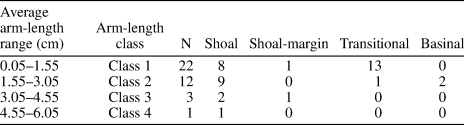
Arm-length ranges and classes, number of individuals (N) per class, and numbers of individuals per class per depositional environment for 38 specimens of Schoenaster carterensis n. sp. In one additional specimen, only the disk was preserved, so arm data were unavailable.

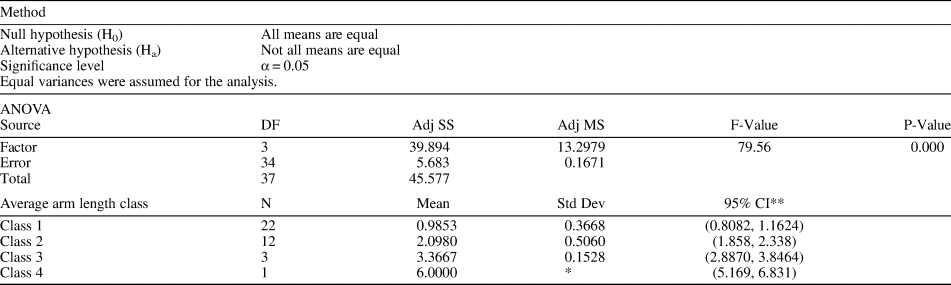
One-way analysis of variance (ANOVA): average arm length by class in Schoenaster carterensis n. sp. The ANOVA, generated by Minitab, was used for tests of hypotheses for analysis in this study. α = alpha (level of significance); Adj MS = adjusted mean squares; Adj SS = adjusted sum of squares; CI = confidence interval; DF = degrees of freedom; F-value = test statistic used to determine whether to reject null hypothesis; P-value = probability of obtaining a test statistic at least as extreme as the F-value (P ≤ α indicates that null hypothesis is rejected in favor of the alternative hypothesis); N = sample size; Std Dev = standard deviation; * = sample size not large enough to calculate StDev.

**Confidence-Interval (CI) Interpretations:
• 95% confident that population mean for Class 1 arm length is between 0.8082 cm and 1.1624 cm.
• 95% confident that the population mean for Class 2 arm length is between 1.858 cm and 2.338 cm.
• 95% confident that the population mean for Class 3 arm length is between 2.8870 cm and 3.8464 cm.
• 95% confident that the population mean for Class 4 arm length is between 5.169 cm and 6.831 cm.
Conclusion: P ≤ α, therefore, null hypothesis is rejected in favor of the alternative hypothesis, and sufficient evidence is present to support the claim that not all the population means are equal.
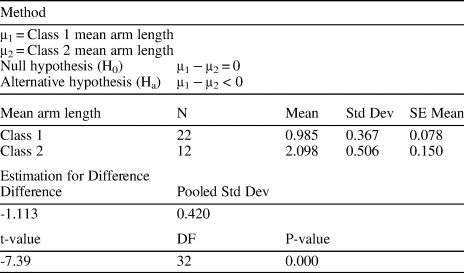
Two-sample t-test and CI: Mean Class 1 and Class 2 arm lengths. DF = degrees of freedom; N = sample size; P-value = probability of obtaining test statistics at least as extreme as the t-value; Pooled Std Dev = weighted average of StDev of each class; SE Mean = standard error of the mean; Std Dev = standard deviation; t-value = test statistic used to determine whether to reject the null hypothesis.

Conclusion: P ≤ α, therefore, the null hypothesis is rejected in favor of the alternative hypothesis, and it can be concluded that there is sufficient evidence to support the claim that the population mean arm length of Class 1 is less than the population mean arm length of Class 2.
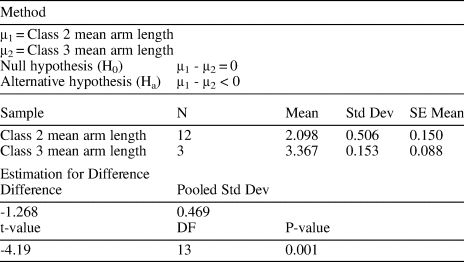
Two-sample t-test and CI: Mean Class 2 and Class 3 arm lengths. See Table 3 for abbreviations.

Conclusion: P ≤ α, therefore, the null hypothesis is rejected in favor of the alternative hypothesis, and it can be concluded that there is sufficient evidence to support the claim that the population mean arm length of Class 2 is less than the population mean arm length of Class 3.
Linear correlation coefficients (r), coefficients of determination (r2), and correlation interpretations (Franzblau, Reference Franzblau1958) for relationships noted in leftmost column.

Abbreviations
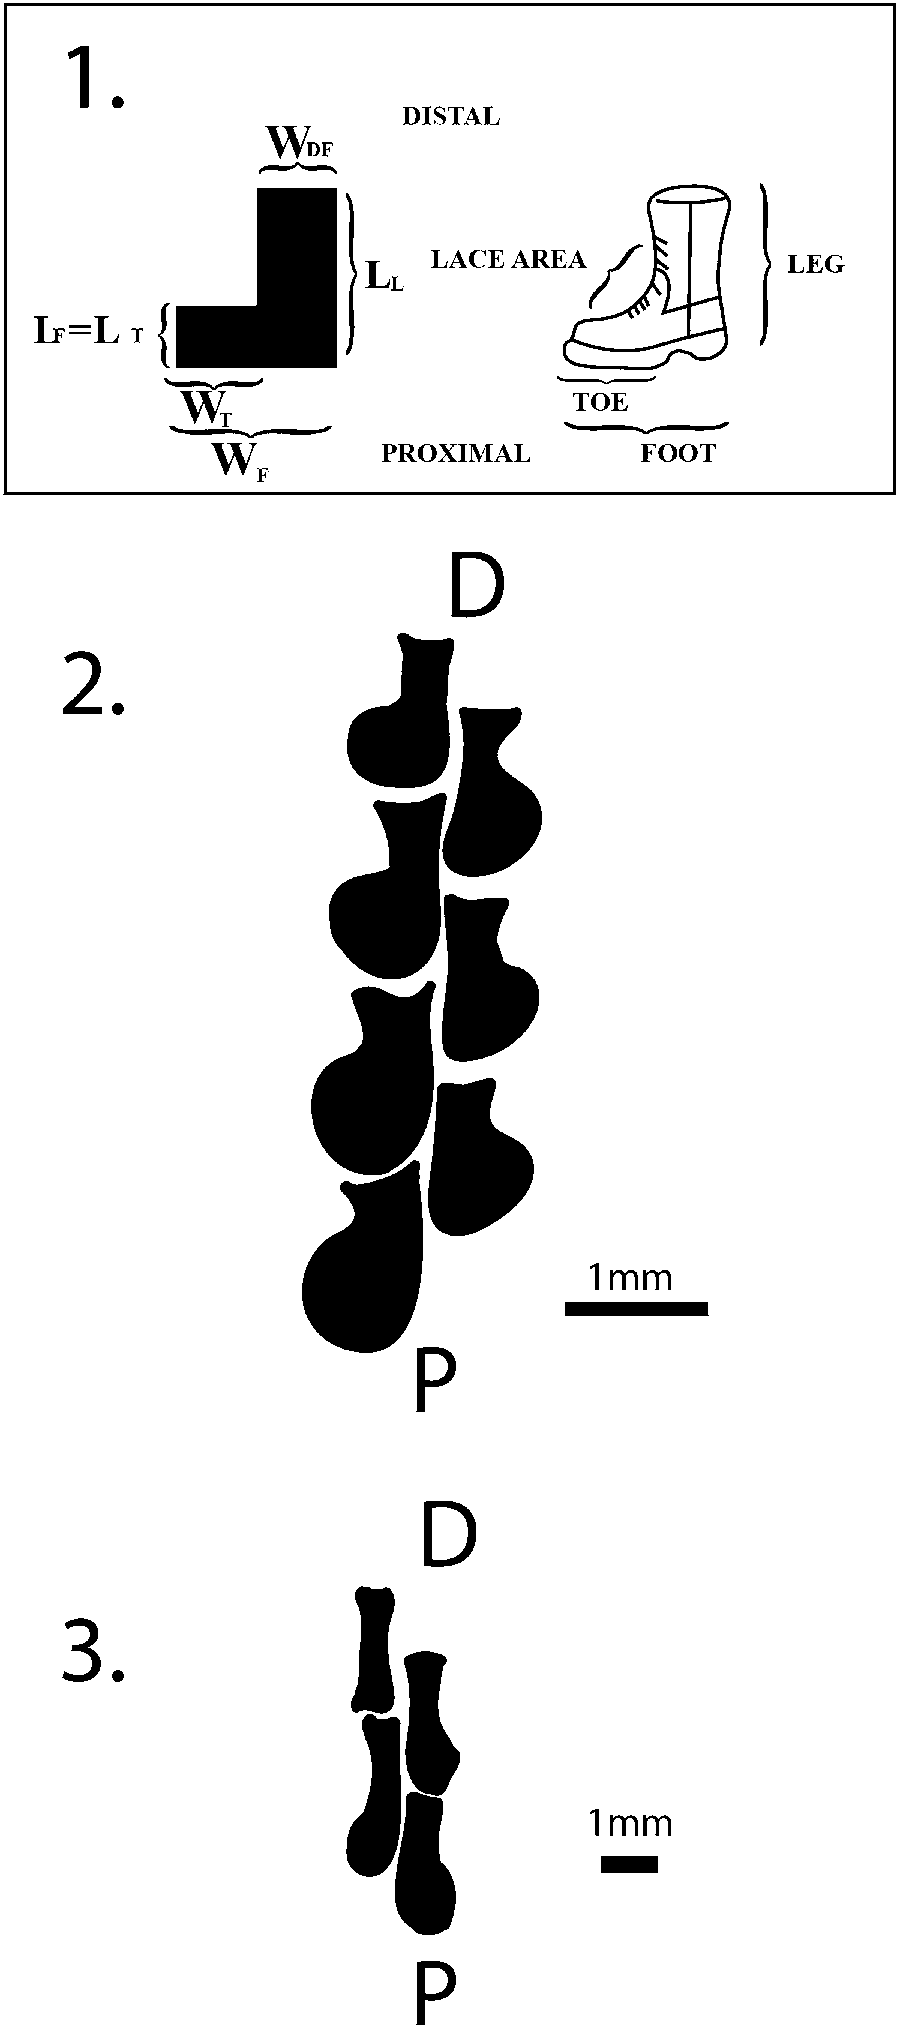
Amb (plural Ambb) = ambulacral; L (plural LL) = lateral; LF = height of ‘boot toe’ (Fig. 6); LL = height of ‘boot leg’ (Fig. 6); MAP (plural MAPP) = mouth-angle plate; M (plural MM) = marginal plate; WDF = width of ‘distal fitting’ (Fig. 6); WF = length of ‘boot foot’ (Fig. 6); WT = length of ‘boot toe’ (Fig. 6).
Terminology and dimensional measurements for the Ambb of Schoenaster carterensis n. sp.: (1) terminology for ‘boot-shaped,’ Schoenaster Ambb compared to parts of a ‘boot’ (adapted from Glass and Blake, Reference Glass and Blake2004); (2) sketch showing outline of proximal Ambb along a perradial suture in ventral view of S. carterensis n. sp. (see Fig. 7.3); (3) sketch in ventral view showing outline of distalmost, elongated Ambb from S. carterensis n. sp. (see Fig. 7.6).

Repository and institutional abbreviations
USNM S = Springer Collection, National Museum of Natural History (United States National Museum), Washington, DC; UK = Department of Earth & Environmental Sciences, University of Kentucky, Lexington. Of the 39 collected specimens, 10 were used in this study (UK 116000–116009).
Systematic paleontology
Phylum Echinodermata Bruguière, Reference Bruguière1791
Class Ophiuroidea Gray, Reference Gray1840
Order Oegophiurida Matsumoto, Reference Matsumoto1915
Suborder Lysophiurina Gregory, Reference Gregory1897
Family Encrinasteridae Schuchert, Reference Schuchert1914
Genus Schoenaster Meek and Worthen, Reference Meek and Worthen1860
- Reference Meek and Worthen1860
Palasterina (Schoenaster) Meek and Worthen, p. 449.
- Reference Meek and Worthen1866a
Schoenaster; Meek and Worthen, p. 277.
- Reference Schuchert1915
Schoenaster; Schuchert, p. 202.
- Reference Spencer1930
Encrinaster Haeckel, Reference Haeckel1866; Spencer, p. 418 (partim).
- Reference Kirk1942
unidentifiable asterozoan genus; Kirk, pl. 1, fig. 2.
- ?Reference Easton1943
Schoenaster?; Easton, p. 137.
- ?Reference Spencer, Wright and Moore1966
Euzonosoma Spencer, Reference Spencer1930; Spencer and Wright, p. U86 (partim).
- Reference Chesnut and Ettensohn1988
unidentifiable asterozoan genus; Chesnut and Ettensohn, p. 68, pl. 12, figs. 8, 9.
Type species
Palasterina (Schoenaster) fimbriata Meek and Worthen, Reference Meek and Worthen1860 from the Mississippian St. Louis Limestone of St. Clair County, Illinois.
Diagnosis
Individuals with stout, convex arms that taper uniformly to acute points; arms never petaloid. Margins of disk between rays concave with poorly organized plating. Ambb alternate and are L- or boot-shaped in ventral aspect with elongate ‘boot leg’ parallel to arm axis. LL (= adambulacrals) subventral with broad ventral faces, rectangular with adradial termination near Ambb, arranged with long axes directed obliquely outward, giving twisted-rope appearance after which the genus was named (Latin, schoenus = rope; Greek, aster = star; Meek and Worthen, Reference Meek and Worthen1860). Mouth frame robust. First and second pairs of Ambb do not overlap; dorsal lateral channelway on LL absent.
Occurrence
Early–middle Late Mississippian (Kinderhookian–middle Chester [Hombergian]; Tournaisian–early Serpukhovian). If the single arm specimen of Easton (Reference Easton1943) belongs in the genus Schoenaster, then the generic range is extended to late Chesterian (Elviran; late Serpukhovian) time.
Remarks
As originally designated, Meek and Worthen (Reference Meek and Worthen1860) placed their specimens in the asteroid genus Palasterina M'Coy, Reference M'Coy and Sedgwick1851, but the LL in their specimens were oriented obliquely to the Ambb, which differs from the perpendicular orientation of the Ambb in Palasterina. Hence, Meek and Worthen (Reference Meek and Worthen1860) created the subgenus Schoenaster to accommodate this difference. However, by 1866, Meek and Worthen (Reference Meek and Worthen1866a) thought that this difference and a few others were substantial enough to separate it as a distinct genus under the name Schoenaster. Although Schuchert (Reference Schuchert1915) recognized the genus and several species, Spencer (Reference Spencer1930) thought that the genus was unrecognizable and placed some Schoenaster species in Encrinaster Haeckel, Reference Haeckel1866, and others in Euzonosoma Spencer, Reference Spencer1930, based on the presence of ventral-surface spines and arm shape, respectively (Spencer and Wright, Reference Spencer, Wright and Moore1966). Jell (Reference Jell1997) resurrected the genus based on the absence of petaloid arms and assigned it to the Encrinasteridae. Harper and Morris (Reference Harper and Morris1978), Jell (Reference Jell1997), and Blake et al. (Reference Blake, Donovan and Harper2017) provided additional information on the history of the family Encrinasteridae and the genus Schoenaster. Schoenaster is currently placed in the suborder Lysophiurina based on alternating Ambb on either side of the perradial suture at the ambulacral midline (Figs. 6, 7.1–7.3, 7.5), and in the family Encrinasteridae based on the presence of wide, robust, transversely elongate, subventral LL (which are oriented obliquely on either side of the arm such that the LL give the appearance of a twisted rope; Fig. 7.1–7.3), transversely grooved ambulacrals, and ambulacrals that join interradial lateral surfaces of MAPP (Fig. 7.4) (Spencer and Wright, Reference Spencer, Wright and Moore1966; Jell, Reference Jell1997; Shackleton, Reference Shackleton2005).
Magnified views of Schoenaster carterensis n. sp. photographed in alcohol: (1–2) holotype, UK 116000: (1) parts of arm and disk in ventral aspect showing LL (blue arrow), termination of ambital framework plate against LL (yellow arrow), and stout, L-shaped Ambb on both sides of perradial suture (black arrows); LL on lower side of arm become smaller proximally and merge with disk plates; (2) central disk in ventral aspect showing five pairs of MAPP (black arrows), L- or ‘boot-shaped’ Ambb (yellow arrow), and ambital framework plates (red); (3–6) paratypes: (3) highly magnified view (UK 116002; distal at top) of a partial arm showing alternating Ambb (A) on either side of the perradial suture and LL on either side of ambulacral groove (one labelled L and outlined with yellow dashes); L- or ‘boot-shaped’ nature of Ambb is not apparent because of articulating LL overlying Ambb; dark areas are podial gaps shared with adjacent Ambb and LL; small pustules can be present on LL; red-brown to orange areas are silicified whereas white areas are still calcite; (4) magnified view (UK 116004; proximal at right) of an interray area in dorsal aspect showing Ambb from adjacent rays meeting in interray area to form MAPP; perradial sutures from adjacent arms labelled with white dashes; a few Ambb (A) outlined with yellow dashes; note that Ambb elongate proximally and show prong-shaped extensions abradially; the most proximal ‘prong’ on the most proximal Amb elongates proximally to form a MAP (M); two MAPP from adjacent rays are shown coming together to form one of the five, two-plate parts of the mouth frame (see Figs. 7.2, 8.1, 8.3); LL (L) at the top become smaller proximally and join small, irregular disk plates in the interray; (5) Ambb (A) in dorsal aspect (UK 116003) near beginning of the disk, showing ‘hourglass-like’ or chain-link shapes with abradial ‘prongs’; (6) magnified view (UK 116003; dorsal at right, ventral at left) of a folded arm; dorsal view to the right shows a normally shaped L (yellow arrow) and adjacent Ambb with ‘prongs’; ventral view to the left shows distalmost elongate Ambb (black arrow) and rounded distal LL (yellow arrow).

Compared with the type species, Schoenaster fimbriatus, specimens assigned to the genus in this study have the same dorsally convex, acutely tapering arms that are approximately equal in length to the diameter of the disk (Fig. 8.1, 8.2, 8.5, 8.6). Most importantly, however, the LL are adradially expanded and oriented obliquely to the ‘boot-shaped’ Ambb (Fig. 7.3), giving the typical rope-like appearance, and comprise the sides of the arms beyond the disk. As in the type species, the MM form a concave margin but are poorly organized and irregular in shape (Figs. 7.1, 7.2, 8.3). In contrast to the type species, specimens in this study have stouter plates and lack evidence of spines, although the absence of spines could reflect preservational conditions.
Schoenaster carterensis n. sp., paratypes: (1) ventral aspect (UK 116001) showing pentagonal disk with concave margins, tapering arms (blue arrow), and mouth-angle plates (black arrows); (2) entire ophiuroid in dorsal aspect (UK 116008) showing the tapering arms (black arrows); (3) disk with partial arms in dorsal aspect (UK 116005) showing small pustulose plates on dorsal surface of arms (black arrows), star-shaped mouth frame (blue arrow), and ambital framework plates (red arrow); (4) entire ophiuroid in dorsal aspect (UK 116009) showing arm folded under the disk (black arrow); submillimeter-sized spines can project from the sides of the arms; (5) entire ophiuroid in dorsal aspect (UK 116006) showing bosses (black arrows) and carinal ridges on arms (yellow arrows); (6) partial arm in dorsal aspect (UK 116005) photographed in alcohol showing small polygonal plates that comprise dorsal arm surface and subventral parts of a few lateral plates (black arrows). Scale (2, 4, 5) in mm and cm.

The truly defining characteristic of this genus is the obliquely oriented LL, which give a rope-like appearance, as was best noted by Schuchert (Reference Schuchert1915, pl. 19, fig. 7c, d) and Jell (Reference Jell1997, fig. 3). In other encrinasterid ophiuroids, the LL are oriented nearly perpendicular to the Ambb (e.g., Spencer and Wright, Reference Spencer, Wright and Moore1966, fig. 74). Inasmuch as all the currently known Schoenaster species show this character—if nothing else—the authors think that all currently known species are congeneric.
Kirk (Reference Kirk1942) illustrated an asterozoan specimen from a slab on which he identified the crinoid Ampelocrinus bernhardinae Kirk, Reference Kirk1942 (USNM S-4402B), but never identified the specimen. Chesnut and Ettensohn (Reference Chesnut and Ettensohn1988) also noted the same specimen as an unidentifiable asterozoan. However, Chesnut and Ettensohn (Reference Chesnut and Ettensohn1988) also described a similar specimen as an unidentifiable ophiuroid (UK 115583). Subsequent examination of both specimens shows that they have the same distally tapering arms and obliquely oriented LL that show the twisted-rope appearance characteristic of Schoenaster. Hence, the authors conclude that all of the unidentifiable asterozoan specimens illustrated by Kirk (Reference Kirk1942) and Chesnut and Ettensohn (Reference Chesnut and Ettensohn1988) belong to the genus Schoenaster. In the Chesnut and Ettensohn (Reference Chesnut and Ettensohn1988) specimens, the internal disk plates, however, are so disorganized that it is impossible to identify the species. Easton (Reference Easton1943) doubtfully identified part of one arm from the Pitkin Formation of Arkansas as an arm from the ‘asteroid’ Schoenaster. Although the arm tapers distally and shows a similar twisted-rope arrangement of the LL characteristic of Schoenaster, all of the disk and other arms are missing. Easton (Reference Easton1943) suggested that the specimen resembles S. montanus Raymond, Reference Raymond1912, which is discussed below; we questionably suggest that the specimen might reside in the genus Schoenaster. Similarly, Schuchert (Reference Schuchert1915) noted the occurrence of a small specimen that he questionably referred to the genus Schoenaster, indicating that it was most likely related to S. wachsmuthi Meek and Worthen, Reference Meek and Worthen1866b. The specimen has never been illustrated or described.
The combination of long, distally tapering arms and concave disk margins readily differentiate Schoenaster from other encrinasterid ophiuroids (Jell, Reference Jell1997). In particular, the genus can be differentiated from both Encrinaster and Euzonosoma, with which Spencer (Reference Spencer1930) and Spencer and Wright (Reference Spencer, Wright and Moore1966) synonymized it, based on its lack of petaloid arms and a well-developed, concave ambital framework, apparent lack of spines on ventral surface, and straight-sided blocky ambulacrals (see Shackleton, Reference Shackleton2005). The first pair of Ambb also does not override the second pair as in the encrinasterid genera Euzonosoma, Encrinaster, and Mastigactis Spencer, Reference Spencer1930 (see Blake et al., Reference Blake, Donovan and Harper2017). The encrinasterid Ophiocantabria Blake, Zamora, and García-Alcalde, Reference Blake, Zamora and García-Alcalde2015, in contrast, has a comparatively larger disk with fewer, better-developed MM, Ambb that are more rectangular than boot-shaped, and stouter pustulose plates throughout. Marginura Haude, Reference Haude1999, a Devonian encrinasterid, has a smaller disk composed of tiny polygonal plates and irregularly polygonal LL with club-shaped abradial expansions (see Jell and Theron, Reference Jell and Theron1999; Glass, Reference Glass2006a). At least some members of the encrinasterid genera Encrinaster, Ophiocantabria, and Crepidosoma Spencer, Reference Spencer1930, also each display a prominent longitudinal channelway on the dorsal surface of LL (Schöndorf, Reference Schöndorf1910; Blake et al., Reference Blake, Zamora and García-Alcalde2015, Reference Blake, Donovan and Harper2017), which is lacking in Schoenaster (Fig. 7.6). Ventral-surface spines can also be a distinguishing trait of Schoenaster, but their presence or absence probably depends on the preservational state of specimens.
Schoenaster carterensis new species
Figures 7–9
Sketch in dorsal view showing the organization and shape of Ambb (A) and MAPP along perradial sutures in adjacent arms (see Fig. 7.4). Inset diagram shows the approximate location of the sketch relative to the five arms of Schoenaster carterensis n. sp. In dorsal view, Ambb (A) bifurcate abradially into two ‘prongs.’ The arrangement of plates in the sketch and figure suggest that as MAPP are lost, the most proximal ‘prong’ on the next-most proximal Amb elongates to become a MAP. The sketch also shows how MAPP from adjacent rays form an interray pair of the mouth frame. At top, LL (L) are shown decreasing in size and merging with disk-interray plates. Sketch shows that several plates are slightly out-of-normal position. Dashed lines indicate uncertainty about plate boundaries.

Type specimens
Holotype, UK 116000; 9 paratypes, UK 116001–116009.
Diagnosis
Thick, stout, L-shaped Ambb in proximal parts of ventral arm surfaces, becoming irregularly rectangular distally. Ambital margins concave with poorly to moderately developed, wider-than-high MM. Dorsal surface of irregular, pustulose plates with raised, carinal ridge along midline of each ray, terminating in irregular boss above mouth frame on dorsal disk.
Occurrence
Ramey Creek Member of the Slade Formation, Upper Mississippian (middle Chesterian, Hombergian; Serpukhovian, Pendleian), Kentucky, USA (38°19′26.49″N, −83°07′27.55″W) (Figs. 1–3).
Description
Small to large, pentagonal individuals (Figs. 7.2, 8.1–8.5). Dorsal surface covered with mm-sized, tumid, pustulose, polygonal plates (Fig. 8.3, 8.5–8.6). Arms tapering uniformly to acute points (Fig. 8.1, 8.2, 8.4); in some specimens, arms folding back on themselves (Figs. 7.6, 8.4), but such flexibility could be a taphonomic overprint related to softening with onset of tissue decay; length of arms beyond the disk reflects approximately two-thirds of total arm length (Fig. 8.1–8.3) and ranges from 0.2–6.0 cm, averaging 1.7 cm. In well-preserved specimens, a carinal ridge, one-to-two-plates wide, extends along the midline of each ray and terminates in a prominent boss above the mouth frame on the dorsal surface (Fig. 8.5). Disk pentagonal and concave at ambitus (Figs. 7.1, 7.2, 8.1–8.5) with a perimeter that ranges from 0.5–6.5 cm, averaging 2.6 cm; sides range from 0.1–1.3 cm in length, averaging 0.6 cm. MM poorly to moderately differentiated (Figs. 7.1, 7.2, 8.3) and terminating against L series at approximately one-third the total arm length (Figs. 7.1, 7.2, 8.1); 8–14 MM per ambital side; MM polygonal, taller than wide, in line with each other, and smaller than inner disk plates with which they imbricate. Ambb and LL plates stout, robust (Fig. 7.3), changing shape along length of the arm; Ambb forming a biserial row with plates on either side of the perradial suture alternating by up to half of an Amb length (Figs. 6, 7.1–7.3); perradial suture straight or gently undulatory (Figs. 6, 7.2–7.5); 5–7 Ambb in disk on ventral surface. In ventral aspect, Ambb are L-, boot-, or stocking-shaped with an elongate boot leg (LL, Fig. 6) parallel to the arm axis, slightly longer than wide in medial parts of the arm and concave on the distal and abradial margins (Figs. 6, 7.2, 7.3). Using the terminology of Glass and Blake (Reference Glass and Blake2004), Glass (Reference Glass2006b, Reference Glassc), and Hunter et al. (Reference Hunter, Rushton and Stone2016) (Fig. 6), in the proximal arm, WF is wider than LF; LL is relatively long; top or proximal part of ‘boot’ is rounded to blocky; WDF is smaller than WF; central leg widening, forming a curved ‘ankle’ area that joins a blocky or rounded toe; distal end of WDF slightly concave; width of central ‘leg’ narrowing slightly distally; WT is slightly shorter than WDF; the abradial edge of ‘toe’ is generally curved; WT is approximately one-third of WF (Figs. 6.1, 6.2, 7.3); the ‘lace area’ is concave and continues toward the rounded or blocky ‘toe’ (Fig. 6.2). Distally, Ambb become irregularly rectangular and elongate in a distal-proximal direction such that LL is nearly four times longer than WF (Figs. 6.3, 7.6); distal Ambb are rounded and protuberant at both ends, but the proximal end is slightly larger (Fig. 6.3) and expands proximally to become the ‘toe of the boot.’ In dorsal aspect, proximal Ambb are very elongate, perpendicular to the perradial suture (Fig. 7.4), and shaped like ‘hourglasses’ that bifurcate into two ‘prongs’ on the abradial ends (Figs. 7.4–7.6, 9); relationships between MAPP and proximal Ambb (Figs. 7.4, 9) suggest that if the animal were to break or lose a MAP, the most proximal ‘prong’ on the next most proximal Amb will elongate and move proximally to become a new MAP (Figs. 7.4, 9); any MAP, along with a MAP from an adjacent ray, forms an interray pair of the mouth frame (Figs. 7.2, 7.4, 8.1, 8.3, 9). LL subventral (Fig. 8.6), robust with broad ventral faces, and rectangular with pointed adradial terminations (Fig. 7.3, 7.6, 7.7) that apparently imbricate across Ambb; LL arranged with their long axes directed obliquely outward (Fig 7.1, 7.3); distally, LL become elongate-oval to ‘apostrophe-shaped’ (Fig. 7.6, yellow arrow); proximally, LL become smaller and more irregularly shaped, appearing to merge with interradial disk plates (Figs. 7.1, 7.2, 7.4, 9). L-shape of the Ambb can be difficult to observe, because adjacent LL articulate with Ambb at the internal angle of the ‘L’ (Fig. 7.3). LL apparently functioned to close and protect components along the ambulacral midline, because all stages of open and closed ambulacral grooves are apparent (Fig. 7.1–7.3). Podial gap shared equally by adjacent Ambb and LL (Fig. 7.3, 7.6). Mouth frame formed from adjacent MAPP that join interradially (Figs. 7.2, 7.4, 8.1, 8.3, 9). Spines (Fig. 8.4) and pustules (Fig. 7.3) can be present on the ventral surface but recognizing them depends upon preservational state.
Etymology
The specific name carterensis comes from Carter County, Kentucky, where the specimens were found.
Remarks
This new species differs from the Meramecian (St. Louis) type, Schoenaster fimbriatus, which has very small delicate Ambb and less elongate squat LL, in its stout, thicker, almost rectangular Ambb and more elongate LL. In the type species, the ‘leg’ of the ‘boot’ is more constricted near its top to form a more defined, rounded podial basin than that present in S. carterensis n. sp. (Fig. 7.3). The new species also apparently lacks the ventral spines that characterize S. fimbriatus. The new species differs from the Osagean (Burlington) species, S. wachsmuthi, in that the latter has more ovoid and less oblique LL. Finally, the new species differs from the Kinderhookian species, S. legrandensis Miller and Gurley, Reference Miller and Gurley1888, in that the latter has nearly straight, narrow arms and oblong LL with rounded ends. Raymond (Reference Raymond1912) collected S. montanus from the Madison Limestone of southwestern Montana, which means that it could be Kinderhookian through Meramecian in age (Ballard et al., Reference Ballard, Bluemie and Gerhard1983). This species is known from one poorly preserved specimen but appears to differ from the new species in the presence of rounded LL and small arms. The genus Schoenaster was previously known only from Lower and Middle Mississippian (Kinderhookian–Meramecian) rocks, but the new occurrence described herein extends its range into the Upper Mississippian (Chesterian) section.
Although most Schoenaster species apparently have more delicate laterals than the species described here, S. carterensis n. sp. appears somewhat similar to the asteroid-like encrinasterid species Ophiocantabria elegans Blake, Zamora, and García-Alcalde, Reference Blake, Zamora and García-Alcalde2015. The new species is also asteroid-like and has laterals and ambulacrals that are very similar to those of O. elegans. The latter differs, however, in having petaloid arms, a more developed ambital framework, and a more complex mouth framework.
In this Schoenaster species, moreover, it seems almost certain that MAPP develop through elongation of proximal parts of the most proximal ambulacral plate in adjacent arm rays (Fig. 9).
Statistical comparison of dimensional parameters
Because ophiuroid fossils are generally rare, most descriptions are based on one or very few specimens. In this study, however, 39 specimens of Schoenaster carterensis n. sp. were available. Although detailed preservation is generally poor in most of these specimens, the original lengths and shapes of the arms and disks can still be measured, making it possible to interpret size classes and discern relationships between the arms and disks (Harris et al., Reference Harris, Ettensohn and Carnahan-Jarvis2019) (Fig. 10). Also, because arm length relative to disk size and the sharp demarcation of disk and arms were significant factors in the original separation of ophiuroids from asteroids (Forbes, Reference Forbes1841), the number of available specimens allows for a detailed statistical examination of these relationships.
Graphs showing linear correlations in Schoenaster carterensis n. sp. between: (1) average arm length and disk area; (2) average arm length and disk perimeter; (3) disk perimeter and disk area. One specimen lacks arms and another lacks the disk; these specimens were not used for analysis.

Size classes
The collection includes specimens of various disk and arm sizes, which, in both cases, range from relatively small to large. Although in some ophiuroid species, observations suggest that the animals increase in size with age (e.g., Zeleny, Reference Zeleny1903), little to no work deals with the specific relationships between ophiuroid arm length and age. Nonetheless, the specimens in the studied collection show a positive correlation between arm length and disk perimeter/disk area (Fig. 10.1–10.3), suggesting that as the ophiuroids grew in size (larger disk perimeters and disk areas), their arms lengthened proportionately. Hence, arm length is used to divide specimens into four arbitrary size classes, generally assuming that the longer the arm, the older the individual (Harris et al., Reference Harris, Ettensohn and Carnahan-Jarvis2019). Specimens were separated into groups of similar arm lengths by inspection, which resulted in four groupings. The specimen arm lengths ranged from 0.05–6.05 cm, a range that was divided into four even parts of 1.5 cm each, reflecting the initial groupings. These groups were subsequently assigned to classes (1–4; Table 1). To check the validity of arm-size classes, a one-way analysis of variance (ANOVA using F-test statistic) was performed (Table 2). At the level of significance of α = 0.05, the test showed a significant difference in average arm lengths, and therefore, it was concluded that those values come from populations having at least one mean different from all others (Table 2).
Using a level of significance of α = 0.05, t-tests were then performed on the average arm lengths between successive arm-size classes, and these tests showed that each class has a statistically smaller arm length than the next following class (Tables 3, 4). Testing was not done for Class 4 because this class contained only one individual.
Disk-arm relationships
Disk-arm relationships were subsequently determined for the 38 specimens (one specimen lacked the disk) in the studied collection. Arm length in this study was assumed to be the length of the arm beyond the disk, and using this dimension, relationships between arm length, disk perimeter, and disk area were calculated (Table 5). Disk sides were measured from the points where any two arms intersected the disk, and the values were averaged to get an average disk side for each individual. These values were then inserted into the geometric formulae for the perimeter and area of a pentagon. We initially began by attempting to correlate arm length with perimeter by arm-size classes, but a sufficient number of specimens (22) for meaningful correlation was only available for Class 1. By using the entire population of individuals, however, sufficient numbers were available to get meaningful correlations (Table 5). In comparing average arm length with disk perimeter (Fig. 10.1), the linear correlation coefficient (Pearson's r; Franzblau, Reference Franzblau1958; Triola, Reference Triola2018) was 0.656, indicating a marked degree of correlation between average arm length and disk perimeter. In fact, the coefficient of determination (r2) is 0.430, meaning that ~43% of the variation in disk perimeter can be explained by the linear relationship between average arm length and disk perimeter. Similarly, in comparing average arm length with disk area (Fig. 10.2), r = 0.649, again indicating a marked correlation, and r2 = 0.421, meaning that ~ 42% of the variation in disk area can be explained by the linear relationship between average arm length and disk area. As expected, comparison of disk perimeter with disk area (Fig. 10.3) showed an r value of 0.965, indicating a high level of correlation. Similarly, the related r2 value of 0.931 means that 93% of the variation in disk area can be explained by the linear relationship between perimeter and disk area, as would be expected mathematically in a pentagon. Hence, the high value for r2 indicates that one variable effectively controls the other. Glass (Reference Glass2006a) provided the only other morphometric data on encrinasterid ophiuroids based on large population sizes.
Preservation
Fossil ophiuroids in this study are preserved nearly intact with 64 other species (Table 6) along stylolitic bedding planes in cross-bedded skeletal calcarenites (Fig. 11.1) or on former hardground surfaces covered by calcilutites and shales (Fig. 11.2). Brachiopods, sponges, and crinoids are the most abundant associated fauna (Fig. 11; Table 6). Entire crinoid crowns, blastoid thecae, and echinoid tests occur intact, except that crinoids are typically ripped apart from their stems (Fig. 11), and delicate brachioles are absent from the blastoids. Entire size-class assemblages, from small to very large individuals (immature to sexually mature?), are present for crinoids and ophiuroids (Table 1), and on a few of the slabs, crinoids and ophiuroids lay on top of each other. Brachiopods are typically articulated but crushed; all sponges are also intact but crushed.
Large-scale views of typical bedding surfaces from the two major ophiuroid-bearing lithofacies (see Fig. 5); all ophiuroids are Schoenaster carterensis n. sp.: (1) stylolitic surface of bed, which might have represented a former firm ground, from the coarse-grained calcarenite lithofacies (shoal environment; see Fig. 4), showing nature of fossil preservation; preservation of all fossils in red chert; (2) hardground surface from the fine-grained calcarenite and interbedded calcilutite lithofacies (transitional environment; see Fig. 4), showing nature of fossil preservation; most fossils preserved in red chert; holes on surface are corrosion hollows partially infilled with shale. Blue arrows = juvenile specimens of Pentaramicrinus bimagniramus Burdick and Strimple, Reference Burdick and Stimple1973; orange arrow = brachiopod Anthracospirifer leidyi (Norwood and Pratton, Reference Norwood and Pratten1855); red arrows = ophiuroid Schoenaster carterensis n. sp. (specimen at upper red arrow hidden in shadows is paratype UK 116009); yellow arrows = poorly preserved and unidentified edrioasteroids encrusting surface; C = crinoid Cymbiocrinus grandis Kirk, Reference Kirk1944; CM = crinoid molds; O = ophiuroid Schoenaster carterensis n. sp. in dorsal aspect (paratype UK 116007); S = sponge Belemnospongia fascicularis (Ulrich, Reference Ulrich and Lindahl1890); T = crinoid Taxocrinus whitfieldi (Hall, Reference Hall1858).

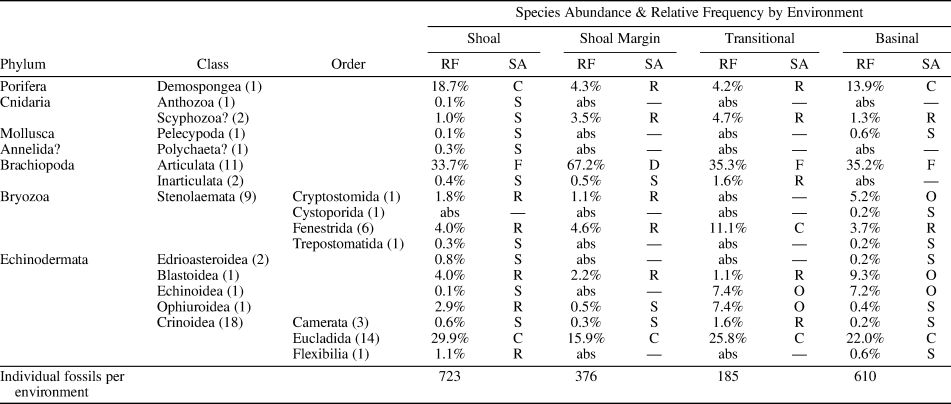
Relative frequency (RF) as a percentage of ophiuroids and accompanying fauna in each of the four Ramey Creek environments. SA = species abundance. The numbers in parentheses are the numbers of species per taxon. abs = absent; C = common, 10% < x ≤ 30%; D = dominant, > 50%; F = frequent, 30% < x ≤ 50%; O = occasional, 5% < x ≤ 10%; R = rare, 1% < x ≤ 5%; S = sporadic, ≤ 1% (abundance descriptors from Harris, Reference Harris2018); — = not applicable.

The modern taphonomy of ophiuroids provides mixed results about ophiuroid preservation. Meyer (Reference Meyer1971) indicated that ophiuroids completely disaggregate in 5–6 days (e.g., Meyer, Reference Meyer1971), whereas Allison (Reference Allison1990) reported that disarticulation only began after 11−48 days, and Brett et al. (Reference Brett, Moffat, Taylor, Waters and Maples1997) suggested that disarticulation could occur in a space of one day to two weeks. In contrast, Lewis (Reference Lewis1986, Reference Lewis1987), as well as Glass and Blake (Reference Glass and Blake2004), suggested that disarticulation rates varied among different species and for different environments. All of the above disaggregation rates are probably accurate for respective species and environments and provide generalizations that necessitate relatively rapid burial for high-quality ophiuroid preservation. Clearly, the specimens studied herein are all articulated, lack evidence of predation or disruption by bioturbation, and show no evidence of attempted escape. Hence, all that can be said about the specimens, as weakly articulated, Type 1 echinoderms (Brett et al., Reference Brett, Moffat, Taylor, Waters and Maples1997), is that their detailed preservation indicates rapid burial alive or immediately postmortem. Other sedimentological indicators already mentioned also allude to rapid burial related to storms. Hence, it is suggested that the community assemblages were ripped up and transported for short distances during storms before burial by migrating sands on the shoals or by mud fallout in the deeper basinal areas. Hence, these assemblages are burial assemblages (taphocoenoses) that might not reflect original community composition. Nonetheless, study of modern transported assemblages suggests that such assemblages can still provide strong signals of original community composition and environmental dynamics (Kidwell and Flessa, Reference Kidwell and Flessa1996; Kidwell, Reference Kidwell2001). Although it is clear that differences in the preservability of depositional settings, different organism hard-part construction, and the possibility of unpreserved benthic plants and animals might influence final assemblage composition (e.g., Arkle and Miller, Reference Arkle and Miller2018), species tallies (Table 6) are used to provide at least some indication of how the ophiuroids might have fit into respective community structures.
In a final stage of preservation, all fossils were partially or completely replaced with red chert (Figs. 7, 8, 11), which could reflect early diagenetic remobilization of silica from the many demosponges (e.g., Fig. 11.1) in all of the assemblages. Sources of opaline silica and organic matter on which the silica can nucleate are necessary for silicification (Müller, Reference Müller, Fairbridge and Jablonski1979; Butts and Briggs, Reference Butts, Briggs, Allison and Bottjer2011; Butts, Reference Butts, Laflamme, Schiffbauer and Darroch2014). The spongy, nonpervasive type of silicification (Butts and Briggs, Reference Butts, Briggs, Allison and Bottjer2011) that prevails in these echinoderms (Fig. 7.3) could reflect the limited distribution of remnant organic matter in the echinoderm stereom.
Paleoecology
Presently, ophiuroids are most common in coastal or littoral marine environments, but live at all depths on all sediment types, and as a group can be euryhaline, eurythermal, and eurybathic (e.g., Hyman, Reference Hyman1955; Fechter, Reference Fechter and Grizimek1972). Ophiuroids also exhibit a negative response to light and are positively stereotropic, seeking cover under various surfaces (e.g., Hyman, Reference Hyman1955).
The specimens in this study are interpreted to have lived in a series of subtropical, shallow, open-marine environments (Fig. 4) that occurred at ~20°S latitude (Boucot et al., Reference Boucot, Xu and Scotese2013) on the former Laurussian continent (Euramerica) before its collision with Gondwana in Pennsylvanian time. Lithologies, sedimentary structures, and fossils in the Ramey Creek Member suggest a network of shoals and intervening basinal areas (Ettensohn, Reference Ettensohn1975, Reference Ettensohn, Dever, Hoge, Hester and Ettensohn1977, Reference Ettensohn1980, Reference Ettensohn and Roberts1981) (Fig. 4) interpreted to have ranged in depth from approximately normal wave base (10 m) on the shoals to ~40 m in the basinal areas, based on modern analogs in the Persian Gulf (Kassler, Reference Kassler and Purser1973; Purser and Evans, Reference Purser, Evans and Purser1973). The occurrence of ophiuroids from this study in all lithofacies suggests that they were present in all Ramey Creek environments (Fig. 4) across all depths.
Despite its presence in all Ramey Creek environments, at 0.4–7.4% of the Ramey Creek fauna, the occurrence of Schoenaster carterensis n. sp. was only sporadic to rare (Table 6). The greatest number of ophiuroid specimens (20 individuals @ 54%; Table 1; Fig. 5) are present in the interpreted shoal lithofacies (Fig. 4; light blue), where articulate brachiopods, eucladid crinoids, and demosponges comprised ~ 81% of the 39 species in the fauna (see Fig. 11.1). Total faunal density for the shoal environments was ~ 997 individuals/m2 (Harris, Reference Harris2018; Harris et al., Reference Harris, Ettensohn and Carnahan-Jarvis2018). In particular, the articulate brachiopod Anthracospirifer leidyi (Norwood and Pratton, Reference Norwood and Pratten1855), the demosponge Belemnospongia fascicularis (Ulrich, Reference Ulrich and Lindahl1890), and the eucladid crinoid Pentaramicrinus bimagniramus Burdick and Strimple, Reference Burdick and Stimple1973 were the most abundant individuals on the shoals (Fig. 11.1), comprising ~51% of the shoal fauna (Harris, Reference Harris2018). Moreover, based on arm length, most of the ophiuroids were smaller, perhaps younger, individuals (Table 1).
Shoal-margin and basinal lithofacies (Fig. 4; yellow and purple, respectively), with totals of 29 and 49 species, respectively, produced only two ophiuroid specimens each (Table 1), comprising 5% each of the total ophiuroid count (Fig. 5) and 0.5% or less of the faunas from the two lithofacies (Table 6). In both settings, the articulate brachiopods, especially Composita subquadrata (Hall, Reference Hall1858) and Anthracospirifer leidyi, the demosponge Belemnospongia fascicularis, the eucladid crinoid Pentaramicrinus bimagniramus and the blastoid Pentremites elegans Lyon, Reference Lyon1860, were the most abundant associated faunal elements, comprising ~80–89% of the fauna at densities of 419 individuals/m2 and 1024 individual/m2, respectively.
The transitional lithofacies or depositional environment (Fig. 4; orange-brown), with 21 different species, represents a transition from shoal-margin to basinal environments. This environment, with a faunal density of 320 individuals/m2, produced the second greatest number of ophiuroid specimens (14 individuals or 36%; Table 1; Fig. 5), most of which were probably younger individuals (based on arm length; Table 1). Many of the ophiuroids in this environment occurred on hardgrounds (Fig. 11.2). Ophiuroids attained the greatest percentage of the fauna in this environment (7.4%; Table 6), wherein articulate brachiopods, fenestrate bryozoans, and eucladid crinoids composed nearly 72% of the remaining individuals (Table 6). In particular, the brachiopods, Anthracospirifer leidyi and Composita subquadrata, and the crinoid Pentaramicrinus bimagniramus were the three most abundant species, together comprising 47% of the fauna (Harris, Reference Harris2018; Harris et al., Reference Harris, Ettensohn and Carnahan-Jarvis2018).
Discussion
Schoenaster carterensis n. sp. is recognized based largely on the shape and size of its lateral and ambulacral plates, and its geographic occurrence is typical of most Schoenaster species. Based on its current distribution in the United States (Schuchert, Reference Schuchert1915), Schoenaster was a tropical to subtropical species apparently restricted to south-central Laurussia. With the exception of a species from Montana, all other species come from southern parts of Laurussia where illustrated species appear to show a progressive increase in the thickness and sturdiness of their ambulacrals with time. This apparent trend could culminate in the Chesterian form S. carterensis n. sp. and could reflect the decreasing depths and higher energies present on this part of Laurussia in later Mississippian time due to regional uplift related to the concurrence of Ouachita and Neoacadian far-field forces (Ettensohn, Reference Ettensohn, Zuppan and Keith1993; Zeng et al., Reference Zeng, Ettensohn and Wilhelm2013).
In contrast to most other fossil ophiuroid species, sufficient specimens of the new species are available that it has been possible to divide the specimens into statistically significant classes based on arm length as well as on the relationships between arm length, disk area, and perimeter. As indicated in Table 1, across all environments, the number of specimens in Class 1, with the smallest arm lengths, is nearly 1.5 times greater than the number of specimens in all the other arm-length classes. Moreover, if specimens in Classes 1 and 2 are grouped together, their numbers are nearly nine times greater in abundance than specimens in Classes 3 and 4. Assuming that specimens with smaller arms represent younger individuals, this distribution of interpreted arm-length classes would give a right- or positive-skewed size-frequency distribution that is typical of some marine invertebrates and probably reflects the interaction of high natality and juvenile mortality rates (Fagerstrom, Reference Fagerstrom1964), or simply the result of a spatfall event. The abundance of individuals with smaller arms and disks could merely reflect the fact that early death is typical of most animals, and that the ophiuroids in these communities represent small but relatively normal populations.
Sufficient specimens are also available to demonstrate both dorsal (Figs. 7.4–7.6, 8.2–8.6) and ventral (Figs. 7.1–7.3, 7.6, 8.1) aspects of the species, but perhaps more importantly, to show how the ambulacral and lateral plates change along the length of the arm.
As already noted, the 39 ophiuroid specimens were found across four lithofacies in the Ramey Creek Member (Figs. 4, 5), which have been interpreted to represent distinct depositional environments or habitat communities (Fig. 4) in the sense of Newell et al. (Reference Newell, Imbrie, Purdy and Thurber1959). Such communities reflect assemblages of organisms that probably had similar responses to certain physical parameters in their environments (e.g., Johnson, Reference Johnson, Imbrie and Newell1964; Patzkowsky and Holland, Reference Patzkowsky and Holland2012). Although two articulate brachiopods (Anthracospirifer leidyi and Composita subquadrata), a sponge (B. fascicularis), and a crinoid (Pentaramicrinus bimagniramus) predominated in each environment (see Table 6), overall diversity in the shoal, transitional, and basinal communities was high (Simpson's Index of Diversity = 0.9; the closer the index is to 1.0, the higher the diversity; Simpson, Reference Simpson1949). In the shoal-margin community, however, diversity was only somewhat high at 0.7 (Harris, Reference Harris2018; Harris et al., Reference Harris, Ettensohn and Carnahan-Jarvis2018). Despite the relatively high diversities of Ramey Creek communities, the ophiuroid Schoenaster carterensis n. sp. was apparently not a common member of the communities (see Table 6), although its relative abundance might merely reflect taphonomic factors unique to the different Ramey Creek environments.
The Ramey Creek environments with the highest numbers of ophiuroids were the shoal and transitional environments (Figs. 4, 5) with 21 and 14 individuals, respectively, and the ophiuroids’ increased numbers there might reflect the fact that in both environments, the substrata were firm to hard. The shoal environments apparently developed in high-energy conditions near or within normal wave base (Fig. 4) that facilitated carbonate lithification (Fursich, Reference Fursich1979). The presence of sessile suspension feeders and absence of burrowing or bore holes on these surfaces (Fig. 11.1) suggests that substrata were firm but were never exposed long enough to become full hardgrounds. During storms, organisms such as brachiopods, sponges, crinoids, and ophiuroids that lived on the shoals (Fig. 11.1) were ripped up, transported short distances, and then buried rapidly below migrating sand dunes. The shoal-margin environments exhibited lower diversity and very few ophiuroids; these environments were probably not very stable, because even normal wave processes would have continually sent fans of sand and skeletal debris down the gentle slopes. The transitional and basinal environments both exhibit high diversity and, although still within the storm wave base, were far enough removed from the shoals that these environments were not continually inundated by lobes of moving sand. Removed from most inundating sands, most transitional surfaces exhibit fixosessile suspension feeders such as edrioasteroids (Fig. 11.2) and corrosion pits, indicating that the surfaces were exposed long enough to become fully cemented, colonized, and eroded (Fursich, Reference Fursich1979), but trace fossils on these surfaces are absent. The stable hard surfaces, perhaps coated with various algae and organic debris, apparently attracted ophiuroids. In contrast, the more distal basinal environments apparently collected carbonate and argillaceous muds, which at the time were not compacted sufficiently to form firm grounds or hardgrounds (see Fursich, Reference Fursich1979). Many of the fossils found here, however, are very well preserved, having been completely engulfed in mud, suggesting that at times, mud fallout was intense. The rarity of ophiuroids in this environment (Fig. 5; Table 6) could reflect these soft bottoms or the fact that the bottoms did not support their feeding strategy, although soft bottoms in other Paleozoic settings do not seem to have precluded ophiuroids (e.g., Glass and Blake, Reference Glass and Blake2002, Reference Glass and Blake2004; Glass, Reference Glass2006a, Reference Glassb, Reference Glassc). More likely, however, the rarity of ophiuroids in the basinal setting might reflect taphonomic factors. Being Type 1 echinoderms (Brett et al., Reference Brett, Moffat, Taylor, Waters and Maples1997), preservation of these ophiuroids would have required rapid burial by thick storm deposits, and the rarity of ophiuroids there might merely reflect the rarity of storm-generated deposits in such settings. Hence, it was only during the largest of storm events that the basinal muds were stirred sufficiently to bury and preserve the ophiuroids intact. Otherwise, the ophiuroids disarticulated rapidly and entered the fossil record piecemeal.
These ophiuroids were apparently parts of tiered feeding communities (sensu Bottjer and Ausich, Reference Bottjer and Ausich1986), in which brachiopods, sponges, and ophiuroids occupied the surface tier, bryozoans and a few blastoids occupied a midlevel tier, and crinoids occupied the highest tier (Fig. 4). With the exception of the ophiuroids, nearly all of the other organisms were suspension feeders, but ophiuroid occurrences like this are typical (e.g., Twitchett et al., Reference Twitchett, Feinberg, O'Connor, Alverez and McCollum2005). Unlike modern ophiuroids with relatively small disks and long, slender, lightly constructed, serpentine arms capable of moving in all directions, Schoenaster carterensis n. sp. had a relatively large disk and ventrally flat, triangular, sturdily constructed arms with many small polygonal plates (Fig. 8) that would have limited their motion. These were asteroid-like arms that could move in a vertical plane (Figs. 7.6, 8.4), but probably lacked much lateral movement and certainly could not coil. Dean (Reference Dean1999) and Blake et al. (Reference Blake, Zamora and García-Alcalde2015) suggested that arms like this indicate feeding generalists that probably concentrated on surficial detritus feeding and chance carnivory. Such arms were also probably not conducive to suspension feeding or to burrowing (Dean, Reference Dean1999). Fechter (Reference Fechter and Grizimek1972) indicated that modern ophiuroids are commonly associated with sponges, and the abundant, small, spherical demosponges (< 2 cm in diameter) in some Ramey Creek environments (Table 6) might have provided feeding opportunities. In fact, sponge spicules from the same Mississippian species (Belemnospongia fascicularis) have been found in the stomach area of the asteroid Emphereaster missouriensis Blake and Elliott, Reference Blake and Elliott2003, suggesting that sponges might have been common food sources for asteroids and ophiuroids (Elliott, Reference Elliott2008). Hence, the joint occurrence of sponges and ophiuroids in the various Ramey Creek environments (Figs. 4, 11.1) might have been more than coincidental. Overall, however, Schoenaster carterensis n. sp. seems to have been the most important detritus feeder in the Ramey Creek environments, although in the transitional and basinal environments (Fig. 4), the similarly feeding echinoid, Archaeocidaris megastylus (Shumard, Reference Shumard1858), was also present.
Acknowledgments
We wish to thank editors J. Jin and B. Lefebvre, as well as D. Blake, F. Hotchkiss, and an anonymous reviewer, who helped improve the quality of the paper. We also want to acknowledge S. Moore (Studiospectre) who helped with paleoart and photo preparation, as well as L. Vietti (University of Wyoming) who helped with microphotography. Travel support was provided by the Department of Earth and Environmental Sciences, University of Kentucky.