1. Introduction
According to Organization for Economic Cooperation and Development (OECD) (2006) estimates, illegal fishing has contributed greatly to the world fisheries crisis. In developing coastal countries, where the majority of people depend on fishing and related activities, food security and sustainable livelihoods are seriously threatened (Pauly and Zeller, Reference Pauly and Zeller2003). In order to address illegal fishing, it is important to clearly understand and target the factors responsible for it. The factors identified in the literature include the risk of detection, the severity of punishment, the rate of time preference, other socioeconomic variables, and considerations of equity and fairness (see Furlong, Reference Furlong1991; Kuperan and Sutinen, Reference Kuperan and Sutinen1994; Hatcher et al., Reference Hatcher, Jaffry, Thébaud and Bennett2000; Chavez and Salgado, Reference Chavez and Salgado2005; Hatcher, Reference Hatcher2005; Akpalu, Reference Akpalu2008, Reference Akpalu2009, Reference Akpalu2010, Reference Akpalu2011a). The theoretical foundation of fishery crime models derives from Becker's (Reference Becker1968) theoretical construct, which views the potential criminal as a self-interested and rational economic agent who aims at maximizing expected utility from illegal fishing. Thus, the fisher engages in illegal fishing if the expected gains from violation outweigh the gains from legal fishing.
However, to the best of our knowledge, the question of whether violators and non-violators have inherently different catch potentials, all things being equal, has received very little attention. The only existing work in the fisheries economics literature relates technical efficiency to violation decisions (Akpalu, Reference Akpalu2011a). The current study extends the empirical literature by estimating counterfactual catch values of violators and non-violators, using an endogenous switching regression model (see Heckman, Reference Heckman2001), and by comparing the estimated expected counterfactual catch values of the violators to their reported average catch values when they did not violate the regulation.Footnote 1 Furthermore, we investigate factors that explain why some violators overstated or understated their counterfactual catch values relative to the estimated values. The traditional model of determinants of violation decision has also been estimated.
Data from an artisanal fishery in Ghana are used for the analysis, and the illegal fishing activity being considered is the use of light aggregation equipment. For the purpose of stock conservation, the Government of Ghana, through Sections 11 (1), (2) and (3) of the Fisheries Regulation 2010 (LI 1968) prohibits, among other methods, the use of light attraction, which involves shining light in the ocean to aggregate the stock for easy harvest. The method contributes to overfishing (Akpalu, Reference Akpalu2011b).
Thus the main hypothesis tested in this study is whether or not fishers with low fishing skills are more likely than those with high skills to violate fishing regulations. The results indicate that violators and non-violators have different fishing skills and therefore different catch potentials. Indeed, the illegal fishers would have obtained higher catch values than their counterparts (i.e., those who fish legally) had the non-violators fished illegally. Alternatively, those who fish legally would have obtained higher catch values than violators had the violators fished legally. Furthermore, violation decisions are influenced by the risk of detection, the age of the skipper, the fisher's perception of whether or not the regulation is right and the fisher's observance of religious norms. In addition to these factors, fishing experience, perceived fairness of the regulation and the number of the skipper's dependents all influence his judgment about counterfactual catch potentials.
The remainder of the manuscript is organized as follows. In section 2 we present our econometric model (i.e., endogenous switching regression model), while a description of the data from small-scale fishers surveyed in Ghana is given in section 3. Section 4 contains the empirical model of determinants of violation decision and catch-value function of violators and non-violators, as well as the estimation results of the models. Section 5 presents the conclusion that violators and non-violators have different catch potentials, and the policy implications of the findings. It is also important to note that, from this point on, ‘skipper’, ‘fisher’ and ‘vessel’ will be used interchangeably, while ‘catch’ refers to the value of catch measured in Ghanaian Cedis (GHS).
2. The econometric model
In order to determine the counterfactual catch potentials of fishing regulation violators and non-violators, we have used an endogenous switching regression model of violation decision and catch values. The model uses a probit regression in a first stage to determine the relationship between each violation decision and the possible determinants of supply of violation. The second-stage regression estimates the determinants of catch values for violators and non-violators, which are conditional on specific criterion function. With this model, it is not only possible to establish the factors that determine violation decisions, but to compute and compare actual and counterfactual catch values of violators and non-violators of the regulation. As noted earlier, the use of light attraction devices makes it possible to fish extensively for the entire year. This extended fishing capability is detrimental both to the biological processes of fish species and the spawning stock biomass. By comparing actual and counterfactual catch values, the contribution of illegal fishing to yield or stock depletion could be revealed and policies formulated accordingly. Thus, the switching regression model could help to determine the stock effect of illegal fishing.
To clarify the method, consider a situation where a fisher could violate the fishing regulation. Let
 $\hbox{A}_i^{\ast} \gt 0$
be a latent variable capturing the expected net benefits from violating the regulation. We specify the probit model of violation of the regulation as
 $$A_i^{\ast} = \hbox{Z}_i \alpha +\eta_i\ \hbox{with}\ A_i = \left\{\matrix{1& if \quad \hbox{A}_i^{\ast} \gt 0 \cr 0 & otherwise\comma \; } \right.$$
where A
i
is a binary variable which takes the value of 1 if the skipper chooses to violate and 0 otherwise; Z
i
is a vector of factors influencing the decision to violate; α is a vector of unknown parameters; and η
i
is an error term with mean zero and variance of
 $\sigma_{\eta}^2$
. Probit maximum likelihood estimation method is employed to estimate the parameters of equation (1). The decision to violate the regulation or not is influenced by catch potentials. Let the catch (production) function be
 $\hbox{y} = f\lpar \hbox{X}\rpar $
, where y is the value of catch and X is a vector of inputs. To estimate a separate regression function for each of the two situations, we specify the following production functions:
 $$\hbox{Regime 1}\, \lpar Violators\rpar \colon \hbox{y}_{1i} = \hbox{X}_{1i} \beta_1 + \varepsilon_{1i} \quad if A_i = 1$$
 $$\hbox{Regime 0}\, \lpar Non-Violators\rpar \colon \hbox{y}_{0i} = \hbox{X}_{0i} \beta_0 + \varepsilon_{0i} \quad if A_i = 0$$
where y
1i
and y
2i
are catch values of violators and non-violators, respectively, and β
k
(where k is an element of {0, 1}) is the vector of parameters to be estimated. The error terms in equations (1), (2) and (3) are assumed to have a triumvirate normal distribution with zero mean and covariant matrix ∑, (i.e.,
 $\lpar \eta\comma \; \varepsilon_1 \comma \; \varepsilon_0\rpar \sim N\lpar 0\comma \; \sum\rpar \rpar $
, with
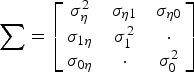 $\sum =\left[\matrix{\sigma_{\eta}^2 & \sigma_{\eta 1}& \sigma_{\eta 0}\cr \sigma_{1\eta} & \sigma_1^2 &\cdot \cr \sigma_{0 \eta} & \cdot &\sigma_0^2}\right]$
.
The notation
 $\sigma_{\eta}^2$
is the variance of the error term in the selection equation (1). Since the coefficients are estimable only up to a scale factor, an assumption of ση
2 = 1 is feasible (Lee, Reference Lee1978; Maddala, Reference Maddala1983). In addition, σ1
2 and σ0
2 are the variances of the error terms in the productivity functions (2a) and (2b); σ1η represents the covariance of η
i
and ɛ1i
; and σ0η is the covariance of η
i
and ɛ0i
. Note that y
1i
and y
0i
are not observed simultaneously, which implies that the covariance between ɛ1i
and ɛ0i
is not defined and is therefore indicated as dots in the covariance matrix. Since the error term of the selection equation (1) is correlated with the error terms of the productivity functions (2a) and (2b), the expected values of and ɛ0i
conditional on the sample selection are non-zero and are defined as
 $$E\left[\varepsilon_{1i} \mid A_i =1\right]= \sigma_{1 \eta} {\phi \lpar Z_i \alpha\rpar \over \Phi \lpar Z_i \alpha\rpar } = \sigma_{1\eta} \lambda_{1i\comma }$$
 $$E\left[\varepsilon_{0i} \mid A_i =0 \right]= \sigma_{0\eta} {\phi \lpar Z_i \alpha\rpar \over 1 - \Phi \lpar Z_i \alpha\rpar } = \sigma_{0\eta} \lambda_{0i\comma }$$
where ϕ (·) and Φ (·) are the standard normal probability density function and normal cumulative density function, respectively,
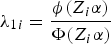 $\lambda_{1i} = {\phi \lpar Z_i \alpha\rpar \over \Phi \lpar Z_i \alpha\rpar }$
, and
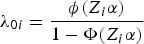 $\lambda_{0i} = {\phi \lpar Z_i \alpha\rpar \over 1 - \Phi \lpar Z_i \alpha\rpar }$
. It is noteworthy that if the estimated covariance
 $\hat{\sigma}_{1\eta}$
and
 $\hat{\sigma}_{0\eta}$
are statistically significant, then the decision to violate and the quantity of fish caught per period of time are correlated. This implies that there is evidence of endogenous switching and the null hypothesis indicating the absence of sample selectivity bias is rejected.
The study used the full information maximum likelihood (FIML) method to estimate the endogenous switching regression model. Using FIML to estimate an endogenous switching regression model is more efficient than the two-step least squares and maximum likelihood methods (Greene, Reference Greene2000; Lokshin and Sajaia, Reference Lokshin and Sajaia2004). The logarithmic likelihood function, given the previous assumptions regarding the distribution of the error terms, is
 $$\eqalign{\ln L_i & = \sum_{i = 1}^N \left\{A_i \left[\ln \phi \left({\varepsilon_{1i} \over \sigma_1} \right)- \ln \sigma_1 +\ln \Phi \left(\theta_{1i} \right)\right]\right. \cr &\quad \left. + \lpar 1 - A_i\rpar \left[\ln \phi \left({\varepsilon_{0i} \over \sigma_0} \right)- \ln \sigma_0 + \ln\lpar 1 - \Phi \lpar \theta_{0i}\rpar \rpar \right]\right\}}$$
where
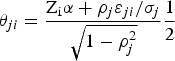 $\theta_{ji} = {\hbox{Z}_{\rm i} \alpha +\rho_{j} \varepsilon_{ji} /\sigma_{j} \over \sqrt{1 - \rho_{j}^2}} {1 \over 2}$
, with j = 0, 1, and ρ
j
denoting the correlation coefficient between the error term η
i
of the selection equation (1) and the error terms ɛ
ji
of equations (2a) and (2b), respectively.
2.1. Conditional expectations, treatment and heterogeneity effects
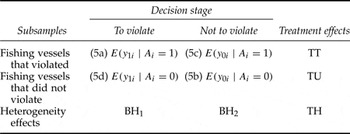
The endogenous switching regression model can be used to compare observed and counterfactual catch values. Thus, we could compare the expected catch value of the vessels that violated (i.e., 5a) with respect to fishing units that did not violate (i.e., 5b), and investigate the expected catch value in the counterfactual hypothetical case that the violating fishing unit did not violate (i.e., 5c) and in the case that the fishers did (i.e., 5d). The conditional expectations for catch in the four cases are presented in table 1 and defined as follows:
 $$E\lpar y_{1i} \mid A_i = 1\rpar = X_{1i} \beta_1 + \sigma_{1 \eta} \lambda_{1i}$$
 $$E\lpar y_{0i} \mid A_i = 0\rpar = X_{0i} \beta_0 + \sigma_{0 \eta} \lambda_{0i}$$
 $$E\lpar y_{0i} \mid A_i = 1\rpar = X_{1i} \beta_0 + \sigma_{0 \eta} \lambda_{1i}$$
 $$E\lpar y_{1i} \mid A_i = 0\rpar = X_{0i} \beta_1 +\sigma_{1 \eta} \lambda_{0i}$$
where equation (5a) is the expected catch value of a violator, given that he violated the regulation. Equation (5b) denotes the expected catch value of a non-violator, given that he did not violate the regulation, while equation (5c) is the expected catch value of a non-violator, given that he violated the regulation. Finally, equation (5d) is the expected catch value of a violator, given that he did not violate the regulation.
Conditional expectations, treatment and heterogeneity

Notes: (5a) and (5b) represent observed expected catch values per period of time, and (5c) and (5d) represent counterfactual catch values per period of time.
A i = 1 if the fisher violated; A i = 0 if fisher did not violate.
y 1i = quantity of fish caught if fisher violated.
y 0i = quantity of fish caught if fisher did not violate.
TT, the effect of the treatment (i.e., violation) on the treated group (i.e., fishers that violated); TU, the effect of the treatment (i.e., violation) on the untreated group (i.e., fishers that did not violate); BH i , the effect of base heterogeneity for fishers that violated (i = 1) and did not violate (i = 0); TH (TT–TU), i.e., transitional heterogeneity.
Cases (5a) and (5b) along the diagonal of table 1 represent the actual expectations observed in the sample. Cases (5c) and (5b) represent the counterfactual expected outcomes. Following Heckman et al. (Reference Heckman, Tobias and Vytlacil2001) and Di Falco et al. (Reference Di Falco, Veronesi and Yesuf2011), we also calculate the following effects:
 $$TT = E\lpar y_{1i} \mid {A_i} = 1\rpar - E\lpar y_{0i} \mid {A_i} = 1\rpar = X_{1i} \lpar \beta_1 - \beta_0\rpar + \lpar \sigma_{1\eta} -\sigma_{0\eta}\rpar \lambda_{1i}$$
 $$TU = E\lpar y_{1i} \mid {A_i} = 0\rpar - E\lpar y_{0i} \mid {A_i} 0\rpar = X_{0i} \lpar \beta_1 - \beta_0\rpar + \lpar \sigma_{1\eta} - \sigma_{0 \eta}\rpar \lambda_{0i.}$$
 $$BH_1 = E\lpar y_{1i} \mid {A_i} = 1\rpar - E\lpar y_{1i} \mid {A_i} = 0\rpar = \lpar X_{1i} - X_{0i}\rpar \beta_{1i} + \sigma_{1 \eta} \lpar \lambda_{1i} - \lambda_{0i}\rpar$$
 $$BH_0 = E\lpar y_{0i} \mid {A_i} = 1\rpar - E\lpar y_{0i} \mid {A_i} = 0\rpar = \lpar X_{1i} - X_{0i}\rpar \beta_{0i} + \sigma_{0 \eta} \lpar \lambda_{1i} - \lambda_{0i}\rpar$$
-
(i) The treatment ‘To violate’ on illegal fishing (TT) is the difference between (5a) and (5c), which is given by equation (6a);
-
(ii) The effect of the treatment on non-violation (TU), i.e., fishers who did not violate the regulation, is the difference between (5d) and (5b), which is given by equation (6b);
-
(iii) The effect of base heterogeneity of the illegal fishers is the difference between (5a) and (5d);
-
(iv) The effect of base heterogeneity of fishers who decided not to violate is the difference between (5c) and (5b);
-
(v) The transitional heterogeneity (TH) is obtained by comparing (TT) and (TU).
Thus, we seek to determine whether the effect of violating the regulation is smaller or larger for fishers who actually violated as well as those who did not violate, relative to their counterfactual case.
3. Data description
The artisanal fishery resources in Ghana are open access with some restrictions on gear, such as limiting mesh sizes to a minimum of one inch in stretched diagonal length, and a ban on using light aggregation equipment, explosives and poisons. Some of these regulations, including the light attraction regulation, are constantly violated, leading to rapid depletion of the nation's inshore capture fish stocks. Light fishing involves the use of artificial light – such as fire torches, pressure kerosene lamps, gaslight lamps, and battery- or generator-assisted incandescent lamps with the intensity of 220–440 V – at night, when the moon is out, to attract and aggregate fish. This makes it possible for more fish to be harvested regardless of the fisher's effort level. Thus, both adult and juvenile fish that spawn on coastal strips and other species that seasonally visit inshore areas for food are easily captured throughout the year with the aid of the light attraction. The capture of species outside of the major fishing season negatively impacts the biological processes of such species and the spawning stock biomass (Quartey and Bannerman, Reference Quartey and Bannerman2005; Akpalu, Reference Akpalu2009). The main objective of the light attraction regulation is for biological conservation. Currently, the artisanal marine sector constitutes 73 per cent of total catch values. Of this figure, 80 per cent comprises small pelagic fish species (Sarpong et al., Reference Sarpong, Quaatey and Harvey2005).
The data for the empirical analysis consist of 199 observations. They came from a 2010 random sampling survey of small-scale fishing vessel skippers, both in central Ghana's Elmina and Cape Coast, and in the western region of Axim.Footnote 2 The three towns are to the west of Accra, the capital of Ghana. The economies of these three areas rely heavily on fishing activities. A questionnaire was administered to each skipper during a face-to-face interview. Each fisher was asked about: the average daily value of his catch from the previous week's expedition; his fishing inputs such as boat size, crew size and fishing hours; his probability of violation detection; any expected fines due to these violations; and the subjective probability of using the illegal equipment if the respondent were made to take an oath before the sea god (Bosompo) never to engage in the illegal activity in the future.Footnote 3 A choice-based experimental question was also asked in order to estimate the rate of time preference for each respondent.
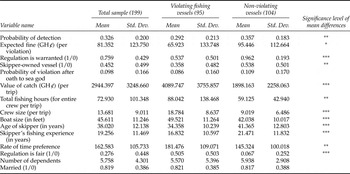
Following Akpalu (Reference Akpalu2008), a five-point scale of the probabilities was then employed to measure the risk of detection: very high (0.5 or more); high (around 0.25); quite possible (around 0.10); moderately low (around 0.05); and very low (0.01 or less). To determine the individual rate of time preference, we follow the design of Akpalu (Reference Akpalu2008). The respondents were asked to choose one of two hypothetical fishery projects. One project (A) would increase the skipper's income once by an amount (X) at the end of the month in which the data were collected, but the second (B) would double the amount (2X) in six months' time. After the respondent made his choice, he was asked to indicate the value for Project B that would make him indifferent between the two projects. This matching was used to calculate the instantaneous individual discount rate (see Akpalu, Reference Akpalu2008, for details). The respondent was further asked whether he fished with light attraction equipment during the previous week's fishing expedition.Footnote 4 To ensure the truth of the respondents' statements, approval for conducting the survey was sought from the chief fisherman, who is very highly respected by the fishers, and each respondent was assured that his responses would remain strictly confidential. The fishing community was also visited several times in order to establish trust, and some of the enumerators were recruited from the fishing communities. The descriptive statistics of the data are presented in table 2.
Descriptive statistics of variables used for the regressions
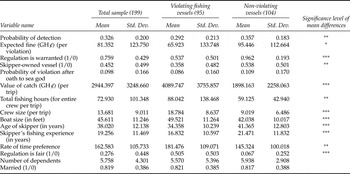
Notes: The exchange rate was approximately US$1.00 = GH¢ 1.40 at the time of data collection.
***implies the means of the corresponding variables for those violating the regulation and non-violators are significantly different at 1%;
**implies that the two mean values are significantly different at 5%;
*implies that the two mean values are significantly different at 10%.
Source: Primary data collected by the authors in 2010.
The sample was made of 48 per cent violators and 52 per cent non-violators. From table 2, the average value of catch per boat of violators, which is GH¢ 4,089.75 (US$ 2,921.25), was more than twice that of their counterparts who did not violate the regulation. However, the violators spent nearly 50 per cent more hours fishing and had over 100 per cent bigger crew size on average than non-violators. Second, while 54 per cent of the violators perceived the light attraction regulation to be warranted, the corresponding figure for non-violators was 96 per cent. Third, there was an approximately 9 per cent probability that illegal fishers would continue to violate after swearing an oath to the sea-god, while the corresponding figure for non-violators was approximately 11 per cent.
This finding is interesting as it indicates that if the fishers commit to violating a regulation, only a small proportion will continue to violate it after religious norms are invoked. Further, non-violators on average perceive the probability of detection to be slightly higher than violators, and the expected severity of punishment is perceived to be much higher among non-violators than their violating counterparts. Note that the expected fine is the product of probability of detection and the penalty, which consists of seizure of the light equipment and 25 penalty units (GHS 100).Footnote 5 The violators also have a significantly higher rate of time preference or are more impatient than non-violators. Finally, tests for differences between the corresponding means of variables in the violator and non-violator groups show that, with the exception of three, the variables are significantly different. Table 3 presents the results of the switching regression model.
Full information maximum likelihood estimate of the switching regression

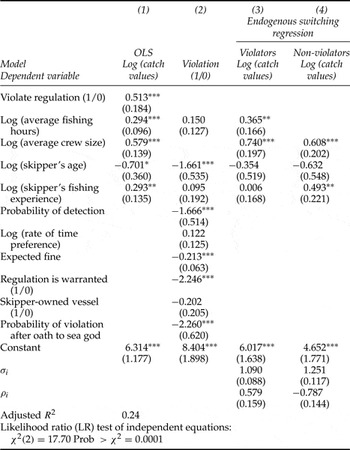
Notes: Asterisks indicate significance levels: *implies significance at 10%; **implies significance at 5%; ***implies significance at 1%. The standard errors are in parentheses.
4. Empirical model and results
4.1. The empirical model
The empirical equations to be estimated are supply of violation function, which is a probit regression, and a catch value (or production) function. The violation decision equation, which is equivalent to equation (1), is specified as:
 $$Violation = f\lpar prob\comma \; fine\comma \; age\comma \; rtp\comma \; own\comma \; seagod\comma \; right\rpar .$$
The dependent variable is binary, taking the value 1 if the fisher violates the regulation and 0 otherwise. The explanatory variables include perceived probability of detection (or risk of detection, [prob]), expected fine if caught (fine), fishing experience (i.e., years of fishing [fexp]), age of the fisher (age), rate of time preference (rtp), ownership of fishing vessel (own), the probability of violating after oath to sea god (Bosompo), and perceived rightness of the regulation (right). Following the literature, it is expected that increased risk and severity of punishment will discourage violation. Those who indicate strong commitment to the oath taken before the sea god think the regulation is right, or have relatively low rate of time preference will be less likely to violate the regulation.
The separate catch value function for violators and non-violators similar to equation (2) is as follows:
 $$\ln \lpar CATCH\rpar = g\lpar \ln \lpar CREW\rpar \comma \; \ln \lpar FEXP\rpar \comma \; \ln \lpar AGE\rpar \comma \; \ln \lpar HRS\rpar \rpar$$
where ln is natural logarithm, CATCH value is catch per 46-foot boat valued in GHS, CREW is crew size, FEXP is years of fishing experience of the skipper, and HRS is hours of fishing per trip.
4.2. Results
The second column of table 3, which is denoted (1), presents the OLS results of the catch value function. The results show a significant difference between yield function for illegal fishers and non-violators, as evidenced by the high significance level (i.e., 1 per cent level) of the dummy variable for violation. However, Ordinary Least Squares (OLS) results do not explicitly account for potential structural differences between violators and non-violators. The likelihood ratio test indicates that the two equations (i.e., the violation and value of catch equations) are not independent (Prob > 0.00), confirming that the OLS results are biased. The estimated results for the endogenous switching regressions are shown in columns 4 and 5 (i.e., denoted [3] and [4] in the table) respectively. The estimations were implemented in STATA, using the movestay command (Lokshin and Sajaia, Reference Lokshin and Sajaia2004). The variables included in the catch value function are fishing hours, crew size, age of skipper and fishing experience. The correlation terms ρ j (defined in equation (6) as the correlation coefficient between the error term in the violation decision equation and each of the two catch value equations) are statistically significant at the 1 per cent level in both equations, indicating that we fail to reject the hypothesis of sample selection bias. The parameter has alternate signs in the two equations. It has a positive sign in the equation for violators, implying that: (1) using the illegal fishing technique significantly increases catch values among violators; and (2) the violators would have had higher catch values than non-violators had the non-violators violated the regulation. On the other hand, the parameter has a negative sign in the non-violators' equation, indicating that: (1) without using the illegal equipment, catch values are significantly lower among non-violators compared to violators (who actually used the illegal equipment); and (2) non-violators would have had higher catch values than violators had violators not violated the regulation. Clearly, on average, the violators of the regulation have higher catch potential than non-violators. The difference, however, is not on account of the violators' being better fishers, but the use of the superior but illegal fishing equipment.
With regards to the inputs, the results show that only crew size is statistically significant (at the 1 per cent level) at explaining catch values among violators. The elasticity coefficient reveals catch value increases by 0.7 per cent if crew size increases by 1 per cent. This indicates that violators could potentially increase their catch values by increasing the crew size. On the other hand, among the non-violators, hours of fishing, crew size and fishing experience are statistically significant at the 5 per cent level or more in explaining catch values. The elasticity coefficients indicate that crew size has the strongest impact on catch values (i.e., 0.63) and the coefficient of fishing hours is the lowest (0.33). It should be noted that fishing experience, which is a strong indicator of fishing capability, significantly influences catch values among non-violators. However, the variable does not significantly impact violation decisions. Drawing from this and the previous paragraph, we can conclude that non-violators are more skillful fishers than their violating counterparts, when the counterparts do not use the illegal equipment.
The third column of table 3 (marked as [2]) shows the supply of violation or violation decision results. The results indicate that the risk of detection, the perception that the regulation is warranted, the skipper's age and observance of religious norms are all highly significant determinants. First, increased surveillance (i.e., probability of detection) decreases violation rate. The computed elasticity coefficient indicates that, on average, increasing the risk of detection by 1 per cent decreases the log of the odd-ratio by 0.45 per cent. Second, fishers who indicated the regulation is warranted are less likely to violate the regulation. Perceiving the regulation to be right decreases the odd-ratio by 1.6 per cent. Third, taking an oath before the sea god to obey the regulation significantly decreases violation rate. The corresponding elasticity with respect to the odd-ratio is 0.24. Finally, the age of the fisher negatively influences the decision to violate, albeit non-linearly. Increasing the age by 1 per cent decreases the odd-ratio by 1.4 per cent. It is noteworthy that among the significant factors, perceived rightness of the regulation has the strongest impact on the decision to violate the light attraction regulation. It follows that policy makers could direct efforts at educating the fishers about the importance of the regulation. Moreover, the education may be directed at younger adults since they are more likely to violate the regulation.
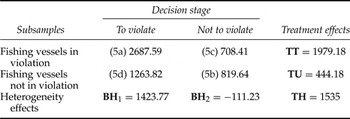
Table 4 presents the results of expected catch values (i.e., average value of catch per boat) of violators and non-violators of the regulation as well as their respective counterfactual catch values.Footnote 6 From the table, the expected catch values of violators and non-violators are GH¢ 2,687.59 and GH¢ 819.64, respectively. Although the figures are visibly different, it is erroneous to compare them, since the two groups are inherently different. However, comparing (5a) and (5c), clearly, the violators of the regulation would have had significantly lower counterfactual catch values had they not violated the regulation. While the treatment (i.e., violation) increased expected catch values by GH¢ 1,979.18 (279 per cent), non-violators would have increased the expected catch values by GH¢ 444.18 (54 per cent) if they, too, had violated the regulation. On the other hand, those currently violating would have had an average of GH¢ 111.23 lower catch values than their non-violating counterparts had they, too, not violated. It is important to note that, although both groups of fishers could obtain extra catch values per boat from illegal fishing, those who are currently fishing legally are less motivated to violate, due to their relatively higher perception of probability of detection, their age and their conviction that the regulation is warranted. Thus, perceived risk and severity of punishment, as well as social constraints, are some of the key drivers of compliance with the regulation. This is coupled with the fact that the gains they are expected to make from fishing illegally will be lower than the gains of those who are currently fishing illegally.
Conditional expectations, treatment, and heterogeneity

4.3. Estimated counterfactual catch values and reported catch values
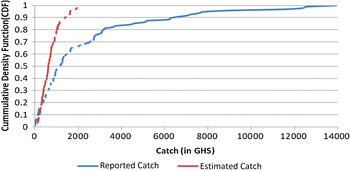
In order to explore self-serving bias among violators, we compare the self-reported catch values (if they had not fished illegally) to the estimated counterfactual catch values of violators (i.e., [5c] from table 4). First, the probability distributions of the two catch values were compared to determine which of the two stochastically dominates the other. Thus, skippers who were in violation of the regulation were asked to state how much they would have caught if they had not used the light attraction equipment. Employing the Kolmogorov–Smirnov test, we found that the reported catch values first order stochastically dominate the estimated counterfactual values at the 99 per cent confidence level (i.e., 0.3789 [P > 0.000]). This indicates that the reported average catch values were generally higher than the estimated values. The result from the test is confirmed by figure 1, which shows that the cumulative distribution function for the estimated counterfactual catch value is above that of the reported catch value, implying that mean reported catch values are higher than the mean of the estimated counterfactual catch values. The mean reported catch value is GH¢ 1,142, which is much higher (88 per cent) than the estimated value of GH¢ 607. The correlation coefficient is positive (i.e., 0.05), but very weak. Furthermore, 55 per cent of the violators reported higher counterfactual catch values (if they do not violate the regulation) relative to the estimated counterfactual catch value from the regression. The remainder (45 per cent) reported lower catch values.
Cumulative distribution of reported and estimated counterfactual catch Values

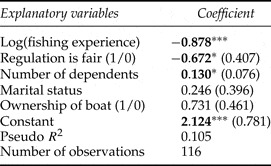
A logit regression was estimated to further investigate possible determinants of over-reported catch values.Footnote 7 The results reported in table 5 indicate that violators who had relatively more years of fishing experience were more likely to under-report counterfactual catch values, perhaps because being familiar with the state of the resource engenders less optimism about yield potentials. The corresponding elasticity of the odd-ratio is 0.88.
Logit regression of determinants of over-reported catch values of violators

Notes: Asterisks indicate significance levels: *implies significance at 10%; ***implies significance at 1%. The standard errors are in parentheses.
Second, among the violators, fishers who indicated that the ‘regulation is fair’ under-reported their catch potentials. The odd-ratio is 0.34 lower among those who indicated that the regulation is fair. This finding is intriguing and points to the surprising fact that illegal fishers who know the regulation is right continue to violate the regulation by convincing themselves that their catch value will be lower otherwise. However, the fishers with relatively more dependents over-reported their counterfactual catch values. The elasticity of the odd-ratio with respect to this variable is 0.72. This implies that fishers who are familiar with the fishery understand that the stock levels are depleted and hence underestimate their catch potentials.
5. Conclusions
A number of studies have been conducted to unearth factors explaining the supply of illegal fishing activities in developing countries. Fishers are endowed with diverse fishing skills, but literature on expected and counterfactual catch value differences between violators and non-violators is missing. This research has employed a switching regression analysis to estimate violation decisions as well as catch value function for both categories of fishers. Also, the estimated counterfactual catch value of violators is compared with stated counterfactual catch values of violators to determine the accuracy of reported catch values. Using data on artisanal fishing in Ghana, we found that older fishers, fishers who perceived risk of detection to be high, fishers who perceived the regulation to be warranted, and fishers who respect religious norms are less likely to violate the regulation.
Furthermore, based on the estimates from the endogenous switching regression model of the catch value functions for the violators and non-violators, we found that the use of the illegal equipment results in higher catch values among violators, and fishers who are currently fishing illegally would have higher catch values for any given level of inputs than non-violators if the non-violators decided to violate the regulations, too. On the other hand, if the violators did not violate the regulation, they would have had lower catch values than non-violators. This clearly indicates that those who fish illegally are better at it than their counterparts who do not. The reason why legal fishers do not fish illegally in order to obtain higher catch values rests in the determinants of violations: fishers who are relatively older, have high perceived probability of detection, or think the regulation is right are less likely to fish illegally even if the potential exists to obtain extra catch values from doing so.
Finally, fishers were asked to state the catch values they would have obtained had they not fished illegally. These values were compared with the estimated counterfactual catch values from the estimated model, but a very weak correlation was observed. Specifically, approximately half of those in violation overstated their counterfactual catch values. Further investigation revealed that violators who perceived the regulation to be fair, those who had relatively more years of fishing experience or who had more dependents were more likely to understate their counterfactual catch values. Consequently, policies aimed at addressing the illegal fishing problem should not only concentrate on the traditional variables – which include increasing probability of detection and fines – but also implement measures to legally improve the skills of less skillful fishers as they are more likely to fish illegally. In other words, illegal harvest can be reduced by legally improving the efficiency of violators. In addition, fishers (especially the younger adults) need to be educated on the importance of fishing regulations.