I. INTRODUCTION
Emission of volatile organic compounds (VOCs) can cause air pollution and be harmful to human health at even very low concentration. Catalytic or thermal oxidation, adsorption, filtration, membrane separation, and condensation are common techniques to remove VOCs. Reference Khan and Ghoshal1 Among all the treatments, adsorption is one of the preferred choices referring to the global shortage of resources. The operation is easy and the cost is low. Reference Hu, Qiao, Zhao and Lu2–Reference Qu, Zhu and Yang5 Activated carbon (AC) is one of the most widespread adsorbents to eliminate the VOCs due to its developed microporosity which ensures the high adsorption capacities. Reference Manjare and Ghoshal6 However, its application is limited by the sensibility to high temperature, difficult regeneration, and shortcomings of pore blocking and hygroscopicity. Reference Zhao, Ma and Lu7 Hence, other better adsorbents are desirable to overcome these kinds of problems.
Ordered mesoporous silica families of mesoporous crystalline material (MCM)-41, Reference Russo, Carrott and Carrott8 Santa Barbara amorphous material (SBA)-15, Reference Newalkar, Choudary, Turaga, Vijayalakshmi, Kumar, Komarneni and Bhat9 hexagonal mesoporous silica (HMS), Reference Newalkar, Choudary, Turaga, Vijayalakshmi, Kumar, Komarneni and Bhat10 and etc. have attracted more and more attention owing to their large surface area, high porosity, controllable and uniform pore sizes, and good mechanical stability. Reference Hu, Li, Hao, Li and Qiao11 SBA-15 presents higher thermal/hydrothermal stability than MCM-41 due to the thicker silica walls, and shows larger mesopore pore sizes to separate large VOC molecules. Moreover, SBA-15 materials have complementary micropores in the silica walls connecting the primary one-dimensional mesopore channels to form a well-defined 2D hexagonal array. These SBA-15 type materials with bimodal pore distributions have been approved a high affinity for various VOCs. Reference Vinh-Thang, Huang, Eic, Trong-On and Kaliaguine12,Reference Kosuge, Kubo, Kikukawa and Takemori13 However, original SBA-15 shows less hydrophobic surface due to the silanols (Si–OH) on the amorphous silica surface, which would cause the decreased adsorption capacity of VOCs in the presence of water vapor. Reference Dou, Hu, Li, Qiao and Hao14
It has been established that the introduction of organic groups into the framework of nanoporous material shows a positive effect on VOCs removal. Reference Dou, Hu, Li, Qiao and Hao14–Reference Matsumoto, Misran and Tsutsumi17 The feasibility of tailoring their surface properties by introducing hydrophobic functional groups (such as methyl) into the special sites of the silica framework makes them even more attractive in the adsorption and elimination of undesired compounds. Reference Stein, Melde and Schroden18,Reference Hoffmann, Cornelius, Morell and Froba19 Previous work has reported the dynamic adsorption of VOCs on functionalized SBA-15, Reference Hu, Li, Hao, Li and Qiao11 showing that the increased hydrophobicity from the presence of organic groups on the surface could enhance the VOC removal properties. However, rare studies about the n-hexane and 93# gasoline adsorption on functionalized SBA-15 are available, especially about the relationship between water vapor adsorption properties and the density of surface hydroxyl groups.
In this work, trimethylchlorosilane (TMCS) was used to functionalize SBA-15 after removing surfactants by extraction. The VOC adsorption and desorption performance as well as the kinetics of different SBA-15-TMCS were systematically studied and compared with commercial silica gel (SG) and AC. The investigations of adsorption and desorption for VOCs were carried out under both static and dynamic conditions by a digital microbalance and a flow adsorption measurement. The results indicate that hydrophobic functionalized SBA-15 materials show low water vapor adsorption capacity, high VOCs adsorption capacity, and with good recyclability, making functionalized SBA-15 great potential for VOC removal.
II. EXPERIMENTAL
A. Materials
Pluronic P123 (EO20PO70EO20, where EO is polyethylene oxide and PO is polypropylene oxide, M w = 5800) was purchased from Sigma-Aldrich. Tetraethyl orthosilicate (TEOS), TMCS, hydrochloric acid (HCl), sodium hydroxide (NaOH), potassium chloride (KCl), sodium chloride (NaCl), n-hexane, toluene, potassium hydrogen phthalate (C8H5KO4), and ethanol were purchased from Shanghai Chemical Crop. 93# gasoline was purchased from Sinopec (Changzhou, China). AC was bought from Xinsen carbon industry Co. Ltd., Shaowu, Fujian, China. SG was a gift from Qingdao trade limited company (Qiaodao, China). All chemicals were used as received without further purification.
B. Synthesis
Pure SBA-15 material was synthesized according to Yu et al. Reference Yu, Tian, Fan, Stucky and Zhao20 In a typical synthesis, 1.0 g of P123 and 1.1 g of KCl were dissolved in 30 mL of 2.0 M HCl at 38 °C. To this solution, 2.1 g TEOS were added under vigorous stirring. The chemical composition of reaction mixture molar ratio was 0.02 P123:1.5 KCl:6 HCl:166 H2O:1 TEOS. The reactants were stirred for 8 min before being kept at static condition for 24 h. Then, the mixture was transferred into an autoclave and heated at 100 °C for another 24 h. After cooling down to room temperature, the precipitates were filtrated, washed with deionized water three times, and then washed with 45 mL of ethanol solution with 0.5 M HCl at 60 °C twice (6 h each time) to remove the block copolymer template. The final products were obtained by drying in air.
The surface silylation of ethanol extracted SBA-15 takes place through the reaction between TMCS and surface SiOH groups as follows: Reference Zhao and Lu21
 $${\rm{Si--OH}} + {\rm{Cl--Si}}{\left( {{\rm{C}}{{\rm{H}}_3}} \right)_3} \to {\rm{Si--O--Si}}{\left( {{\rm{C}}{{\rm{H}}_3}} \right)_3} + {\rm{HCl}}\quad {\rm{.}}$$
Approximately 1.0 g of ethanol extracted SBA-15 was soaked in a TMCS solution in toluene (1 g/100 mL) at 70 °C under stirring for 24 h. The mixture was then extensively washed with ethanol to rinse away any residual chemicals. Finally, the powder was dried at 100 °C. The functionalization synthesis was carried out at three different TMCS amounts, 0.25, 0.50, and 0.75 g, respectively, and the resultant composites were denoted as SBA-15-A, SBA-15-B, and SBA-15-C, respectively.
C. Materials characterization
X-ray powder diffraction (XRD) was carried out in a D/max 2500 PC (Rigaku Corporation, Tokyo, Japan) using Cu Kα radiation over the range of 0.7° ≤ 2θ ≤ 5°. The structure of the samples was examined by a transmission electron microscope (TEM, JEM-2100 [JEOL Ltd., Tokyo, Japan], 200 kV). Nitrogen adsorption measurements were performed on ASAP 2010 gas sorption analyzer. Before measurements, the samples were degassed under vacuum at 100 °C for 6 h. The Brunauer–Emmett–Teller (BET) surface areas (S BET) were calculated based on the linear part of the BET plot (P/P 0 = 0.05–0.25). The pore size distributions were derived from the adsorption branches of isotherms by using the Barrett–Joyner–Halenda (BJH) model. The total pore volumes (V t) were calculated from the nitrogen amount adsorbed at a relative pressure of 0.99. The micropore volumes (V m) and micropore surface areas (S m) were calculated from the t-plot method. Reference Zhu, Zhao, Lu and Do22 Fourier transform infrared (FT-IR) spectra were collected on Nicolet Fourier spectrophotometer (Thermo Fisher Scientific, Waltham, Massachusetts), using KBr pellets of the solid samples.
D. Static adsorption and desorption measurements
Static adsorption equilibrium measurements Reference Wang, Tang, Zhang, Cai, Huang, Chen and Yu23 at 25 °C were carried out using a digital microbalance (Model YP/1002, Shanghai Toposun Industries Ltd., Shanghai, China) with a sensitivity of 0.1 μg. The adsorption–desorption properties of the VOCs or water vapor were determined in a desiccator with a series of VOCs or distilled water. The desiccator was placed in a constant-temperature water container and equipped with an analytical balance. First, 200 mg of the powder sample was loaded on a small pan. The sample was heated to 100 °C under a high-vacuum of 0.9 mbar for at least 1 h to remove all the adsorbed impurities. Then the sample was cooled to the room temperature in the drying apparatus, the constant weight of the sample was recorded as net weight for further analysis. Then the pan with sample was kept in contact with the VOCs or water vapor for sufficient time at room temperature. The desorption procedure was carried out by heating the sample to 100 °C in a vacuum environment until the mass of the sample did not change any more. According to the mass change of the sample before and after the adsorption and desorption procedure, the adsorption capacity and desorption percentage of the sample could be calculated as follows:
 $$X = {{{m_2} - {m_1}} \over {{m_1}}}\quad ,$$
 $$Y = {{{m_3} - {m_4}} \over {{m_2} - {m_1}}} \times 100\% \quad ,$$
where X and Y are the adsorption capacity and desorption percentage of the sample, m 1 and m 2 are the mass of the sample before and after the adsorption, and m 3 and m 4 are the mass of the sample before and after the desorption, respectively. All the measurements were performed in triplicate at least to ensure the quality and reproducibility of the data.
For clarification of water vapor on n-hexane, static sorption performance for different SBA-15, SG and AC control experiments with 4:1 and 1:1 n-hexane and water (volume ratio) mixture as adsorbates was performed. Meanwhile, the cycling performance was also done under the same conditions. After 24 h static adsorption at room temperature, the adsorbents were transferred into 250 mL iodine flask with ethanol as the extractant (1 g adsorbent/250 mL ethanol) immediately. Then the iodine flask was put in constant temperature oscillator with shaking at 200 rpm at room temperature for 5 h. The adsorbed amount of n-hexane of static competitive of n-hexane and water experiment (m hexane) was determined by the concentration tested using a gas chromatograph (GC) equipped with a flame ionization detector. The total static n-hexane and water vapor adsorption amount (m t) was according to the mass change of the sample before and after the adsorption. The static water vapor adsorption amount (m water) was the difference value of m t and m hexane. The corresponding adsorption capacity and desorption efficiency calculations of the sample were similar to that of static single component adsorption.
E. Titration of surface hydroxyl
The density of surface hydroxyl was determined according to Boehm titration. Reference Wang, Tang, Zhang, Cai, Huang, Chen and Yu23–Reference Sears25 Typically, 0.50 g of sample was dispersed in 100 mL mixture of ethanol and NaCl and then sealed and shaken thoroughly for 24 h. The pH value of the resulting suspension was first adjusted to 4.0 by 0.01 M HCl or 0.018 M NaOH and then the pH was further titrated from 4.0 to 9.0 with 0.018 M NaOH. The density of surface hydroxyl was calculated as follows:
 $$D = CV{N_{\rm{A}}} \times {10^{ - 3}}\quad ,$$
where D (×1020/g) was the density of surface hydroxyl of the sample, C, V, and N A were the concentration of NaOH (M), which was calibrated by C8H5KO4, the titration volume of NaOH (mL) during the pH value of the resulting suspension that varied from 4.0 to 9.0, and the Avogadro constant, respectively.
F. Dynamic adsorption and desorption measurements
The investigation of dynamic adsorption was carried out by a flow method reported by Hu et al. Reference Hu, Li, Hao, Li and Qiao11 Before starting each experiment, the flow rate was adjusted so that the required outlet concentration of n-hexane vapor was reached and kept stable. Adsorbent was loaded in a fixed-bed reactor (internal diameter of 1.50 cm and length of 15.00 cm). Before adsorption, samples were degassed at 100 °C overnight under vacuum condition to remove the physically adsorbed water molecules and other organic impurities adsorbed in pores, just as in the static adsorption procedure. Air was taken as a carrier gas with a total flow rate of 0.10 L/min, and the concentration of n-hexane was controlled at 0.45 g/L. The adsorption amount was determined by the concentration change before and after adsorption measurements tested by using a GC equipped with a flame ionization detector. The breakthrough time is defined as the time when the outlet concentration is about 10% of the inlet concentration. The dynamic equilibrium adsorption capacity (q) was calculated from the breakthrough curves according to the equations as follows:
 $$q = {{{F_{\rm{A}}}\int {\left( {1 - {{{C_{\rm{A}}}} \over {{C_0}}}} \right)} {\rm{d}}t} \over W}\quad ,$$
where F A (L/min) is the mixed gas flow rate of n-hexane and air, and W (g) is the amount of the adsorbent loaded in the adsorption bed. The time range of integration was from 0 to t e (min), where t e was adsorption equilibrium time.
III. RESULTS AND DISCUSSIONS
A. Characterization of the materials
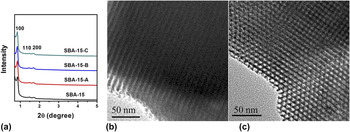
The XRD patterns of different SBA-15 samples are shown in Fig. 1(a). The ethanol extracted SBA-15 materials displayed three well-defined peaks, which can be indexed to (100), (110), and (200) diffractions, respectively, confirming a 2D hexagonal arrangement (d (100) = 10.32 nm). Reference Lim and Stein26,Reference Zhao, Sun, Li and Stucky27 After grafting methyl groups onto the surface, the peak positions and intensities of all the samples remained virtually constant [Fig. 1(a)], suggesting the maintenance of the structure of original SBA-15. Increasing the amount of added TMCS from 0.25 to 0.50 g in the initial synthesis mixtures caused an increase of the unit cell parameter (a 0) from 11.9 to 12.2 nm (Table I). When the content of TMCS was further increased to 0.75 g, the value of a0 was constant; indicating that 0.50 g of TMCS is enough to modify 1.0 g ethanol extracted SBA-15.
Powder XRD patterns of different SBA-15 samples (a) and TEM images of SBA-15-B viewed from the (110) and (100) directions (b, c).

Structural parameters of different materials.

Representative TEM images of SBA-15-B, viewed from the (110) and (100) directions [Figs. 1(b) and 1(c)] further confirm a highly ordered 2-D hexagonal P6mm mesostructure. Reference Zhao, Feng, Huo, Melosh, Fredrickson, Chmelka and Stucky28 The cell parameter (a 0) was estimated to be 11.8 nm, in good agreement with that determined from the XRD data.
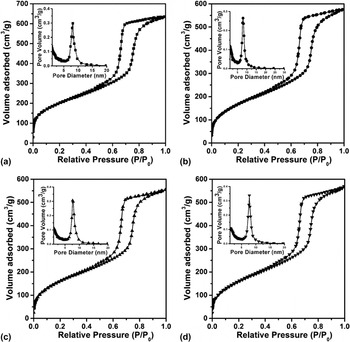
Figure 2 shows the N2 adsorption–desorption isotherms and the corresponding pore size distributions of the original and functionalized SBA-15. Nitrogen sorption isotherms of surfactant-free materials are of classical type IV according to the IUPAC classification with a sharp capillary condensation step, which is typical of the well-ordered mesoporous material with narrow pore size distributions. Reference Liu, Yang, Kapoor, Setoyama, Inagaki, Yang and Zhang29 The sharp capillary condensation step at P/P 0 = 0.75–0.80 indicates the presence of uniform mesopores. Reference Zhai, Tu and Zhao30 Despite the decrease of the adsorption amount of nitrogen, the shapes of the hysteresis loops (H1) for methyl-grafted samples remain the same as the original samples, implying that the functionalization process would not change the structures of SBA-15. The surface functionalization could result in the decrease of the surface area, the total pore volume, and pore size to some extent (Table I). SBA-15-B shows smaller surface area and a total pore volume of 15.5 and 10.2% decrease, respectively, as compared with that of the original SBA-15, which is consistent with the literature. Reference Dou, Hu, Li, Qiao and Hao14
Nitrogen adsorption-desorption isotherms and pore size distributions of SBA-15 (a), SBA-15-A (b), SBA-15-B (c), and SBA-15-C (d).

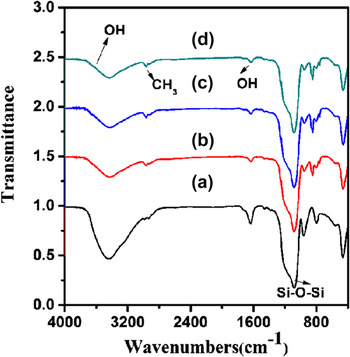
The FT-IR spectra were shown in Fig. 3, confirming the successful covalent grafting of the organic groups onto the silica wall. The peaks corresponding to the strong C–H stretching and bending vibrations of P123 in the 2971, 2933, 2886, 1464, and 1384 cm−1, Reference Wahab, Kim and Ha31 of different SBA-15 samples almost disappeared, implying that the surfactant was completely removed through extraction. Reference Zhu, Tang, Zhao, Zhou, Wang and Yu32 The band at 2974 cm−1 is assigned to C–H bond stretching vibration of terminal methyl group, Reference Zhao and Lu21 and the intensities of TMCS functionalized SBA-15 [Figs. 3(b)–3(d)] increased compared with that of SBA-15 [Fig. 3(a)]. The band in the region of 3420–3440 cm−1 is from the Si–OH groups, while the peak at 1633 cm−1 can be attributed to the O–H bending vibration mode of the adsorbed water molecules. Reference Kokunesoski, Gulicovski, Matovic, Logar, Milonjic and Babic33 The intensities decreased significantly after functionalization, suggesting the condensation of TMCS on the silica. The FT-IR results clearly confirm that methyl groups are covalently anchored onto SBA-15 surface. However, it is difficult to quantify the –CH3 density change after TMCS modification, and the free –OH density was titrated to indirectly represent the –CH3 density Reference Wang, Tang, Zhang, Cai, Huang, Chen and Yu23,Reference Wang, Tang, Han, Cao, Zhang, Huang, Chen and Yu24 in the following section.
FT-IR pattern of SBA-15 (A), SBA-15-A (B), SBA-15-B (C), and SBA-15-C (D), respectively.

B. Static adsorption and desorption properties
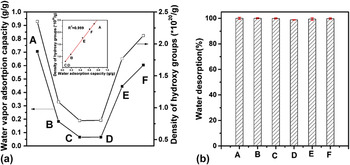
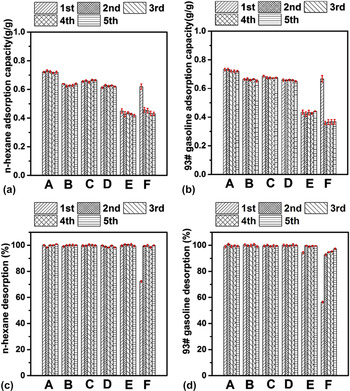
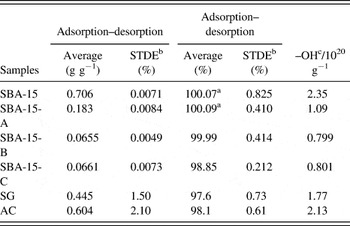
The investigation of static adsorption and desorption behavior was conducted to study the effects of surface chemistry of SBA-15 on the adsorption properties. The study of static adsorption–desorption capacity on all the samples was based on the mass change of the samples before and after the adsorption or desorption procedure. The results of static water vapor, n-hexane, and oil adsorption capacities on the different SBA-15 samples with AC and SG as reference were shown in Figs. 4 and 5. The corresponding surface hydroxyl densities are shown in Table II and Fig. 4(a).
The relationship between static water vapor adsorption capacity and the density of the surface hydroxyl group (a) and desorption efficiency (b) from triplicate measurements on different samples. SBA-15 (A), SBA-15-A (B), SBA-15-B (C), SBA-15-C (D), SG (E), and AC (F), respectively.

The histograms of static adsorption capacity n-hexane (a), 93# gasoline (b), and static desorption efficiency n-hexane (c), 93# gasoline (d), respectively, from triplicate measurements of different samples. SBA-15 (A), SBA-15-A (B), SBA-15-B (C), SBA-15-C (D), SG (E), and AC (F), respectively.

The water vapor adsorption capacities, desorption efficiencies and the densities of surface hydroxyl groups of different samples.

a Due to the mass loss of the sample, the percentage of desorption might be higher than 100%.
b STDE refers to the standard deviation.
c The density of surface hydroxyl groups was determined by the Boehm titration method. Reference Wang, Tang, Zhang, Cai, Huang, Chen and Yu23–Reference Sears25
SBA-15 exhibited the highest water vapor adsorption capacity (0.706 g/g) owing to the high density of surface hydroxyl (2.35 × 10²⁰/g). The water vapor adsorption capacities of SBA-15 decreased obviously after being modified with TMCS. The water vapor adsorption capacities of SBA-15-A and SBA-15-B were 0.183 g/g and 0.0655 g/g, respectively, and the corresponding surface hydroxyl densities are 1.09 × 10²⁰/g and 0.799 × 10²⁰/g, respectively. The water vapor adsorption capacity of SBA-15-C (0.0661 g/g) is almost the same as that of SBA-15-B, which suggests that the accessible surface hydroxyl of SBA-15 (about 75%) has been completely occupied when 0.5 g TMCS was used. In addition, the water vapor adsorption capacity of SBA-15-B is far lower than that of SG (0.445 g/g) and AC (0.604 g/g), because the commercial adsorbents have much more surface hydroxyl groups (1.77 × 10²⁰/g and 2.13 × 10²⁰/g, respectively). From the inset of Fig. 4(a), it is evident that the water vapor adsorption capacity of different materials under study is proportional to the density of surface hydroxyl. From the measurement of the desorption efficiencies of all adsorbents (including AC and SG), a nearly complete desorption of water vapor can be found [Fig. 4(b)].
n-Hexane and 93# gasoline were used as model VOCs to evaluate the static adsorption capacity of different SBA-15 materials. As shown in Figs. 5(a) and S1(a), the n-hexane adsorption capacity of SBA-15 was 0.721 g/g (1.01 × 10⁻³ g/m2). The n-hexane adsorption capacity of SBA-15-TMCS decreased as compared to that of SBA-15. The n-hexane adsorption capacities for SBA-15-A and SBA-15-B were 0.639 g/g (1.03 × 10⁻³ g/m2) and 0.656 g/g (1.09 × 10⁻³ g/m2), respectively. The higher n-hexane adsorption capacity of SBA-15-B than that of SBA-15-A might be related to the more hydrophobic surface with more methyl groups on the surface. However, with further increase of TMCS, the n-hexane adsorption capacity of SBA-15-C was 0.613 g/g (1.03 × 10⁻³ g/m2), a little smaller than that of SBA-15-B. It is noted that the adsorption capacities of 93# gasoline on different SBA-15 samples show the same trend to that of n-hexane [Fig. 5(b)]. For different SBA-15-TMCS with similar structures but different surface properties, grafting more hydrophobic functional groups reduces hydrophilic surface hydroxyl groups, thus results in the reduced water adsorption capacity [Fig. 4(a) and Table II], but increases VOC adsorption capacity [Figs. 5(a) and 5(b)] and Fig. S1. The relationships between the static n-hexane adsorption capacities and the corresponding structure parameters (surfaces area, pore volume, micro surface area, and micropore volume) of different adsorbents are shown in Fig. S2. After functionalization of SBA-15, the structural parameters of different SBA-15-TMCS decrease gradually (Table I and Fig. S2), however the adsorption capacity increases [Figs. 5(a), 5(b), and S1]. So the VOC adsorption capacity of functionalization SBA-15 may due to the synergistic effect of the structure and surface composition. The n-hexane and 93# gasoline adsorption capacity of commercial SG in the first cycle is 0.449 g/g (1.05 × 10⁻³ g/m2) and 0.434 g/g (1.01 × 10⁻³ g/m2), respectively [Figs. 5(a), 5(b), S1(a), and S1(b)]. As to commercial AC, first n-hexane and 93# gasoline adsorption capacities are 0.619 g/g (0.427 × 10⁻³ g/m2) and 0.668 g/g (0.460 × 10⁻³ g/m2), respectively. As can also be seen from Figs. 5(a) and 5(b), all the siliceous samples have stable n-hexane and 93# gasoline adsorption capacities. However, the n-hexane and 93# gasoline adsorption capacity of AC decreased in the second adsorption cycle because of degeneration Reference Hiro and Renichirou34 and was kept constant during the following adsorption process [Figs. 5(c) and 5(d)].
The competitive adsorption results of different SBA-15, SG, and AC are shown in Fig. S3. With the volume ratio of n-hexane to water of 4:1 and 1:1, the first n-hexane adsorption capacities of different SBA-15, SG and AC decreased, a little lower than that of single component n-hexane [Figs. S3(a) and S3(b)]. During the competitive adsorption process of n-hexane and water vapor, the first n-hexane adsorption capacity is SBA-15-B > SBA-15-C > SBA-15-A > SBA-15 > AC > SG. At the same time, the first water vapor adsorption capacity is SBA-15 > AC > SG > SBA-15-A > SBA-15-B ≈ SBA-15-C, which shows the similar trend to that of single component n-hexane static or water vapor adsorption. As shown in Figs. S3(c) and S3(d), the corresponding first weight ratio of m n-hexane/m water is SBA-15 < AC < SG < SBA-15-A < SBA-15-B ≈ SBA-15-C. Stability experiment results show that different siliceous materials have high adsorption stability, while the desorption AC is not complete during the first desorption process, which results in decrease of n-hexane and water vapor adsorption capacities slightly during the second adsorption process, and then were kept constant during the following adsorption–desorption cycle [Figs. S3(e) and S3(f)]. The above results suggested that water vapor adsorption is competitive to that of n-hexane during the n-hexane and water vapor coexistence adsorption process. More water vapor coexistence and more hydroxyl groups lead to a larger decrease of n-hexane adsorption capacity. SBA-15-TMCS has high adsorption tendency for n-hexane over water and good recyclability.
C. Dynamic adsorption and desorption properties
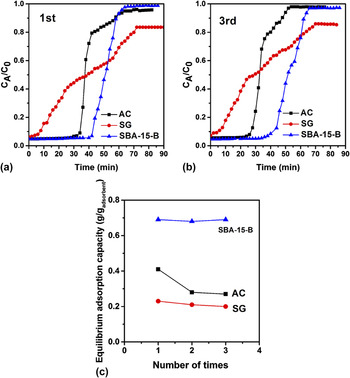
The breakthrough measurement is a direct method designed to make clear the dynamic performance of VOC adsorption. In many cases, the actual adsorption processes of VOCs are associated with adsorption using a fixed bed in which adsorbents are packed, into which air with VOCs flows. From the above static results, SBA-15-B with high VOC adsorption capacity, stability, and low water vapor adsorption capacity was adopted to investigate the dynamic adsorption and desorption performance by comparing with AC and SG. The typical breakthrough curves give the evolution of the C A/C 0 ratio as a function of time, where C A is the concentration of n-hexane at the outlet of the adsorption bed and C 0 is the concentration of hexane at the inlet. To determine the dynamic adsorption performance of adsorbents, the breakthrough time, the equilibrium adsorption capacity, and the stability are important parameters. The n-hexane breakthrough curves of SBA-15-B, AC, and SG are shown in Fig. 6.
The breakthrough curves for n-hexane of AC (▪), SG (•), and SBA-15-B (▲). (a) is the first time, (b) is the third time, respectively. (c) is the comparison of the equilibrium adsorption capacities 3 times.

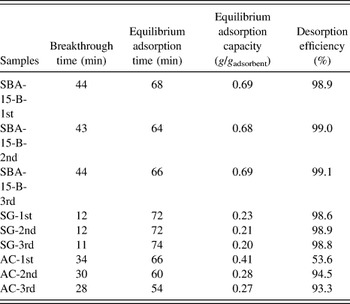
Generally, the longer the breakthrough time is, the higher the dynamic adsorption capacity becomes. Reference Hu, Li, Hao, Li and Qiao11,Reference Dou, Li, Hu, Ma, He, Li, Hu, Hao and Qiao35 As shown in Table III, the breakthrough times of SBA-15-B, AC, and SG during the first dynamic adsorption process were 44, 34, and 12 min, respectively. Shorter breakthrough times were observed for AC and SG, as compared with SBA-15-B, which may be due to smaller pore sizes (Table I). In addition, the postbreakthrough curve of SBA-15-B for n-hexane adsorption increases more rapidly compared with the other samples, implying less resistance of interparticle mass transfer. Reference Kosuge, Kubo, Kikukawa and Takemori13 In contrast, the postbreakthrough sharpness of the increasing n-hexane concentration for SG is the lowest, indicating relatively larger mass transfer resistance. The dynamic equilibrium adsorption capacity of n-hexane on the adsorbent was calculated by integrating the area above the whole breakthrough curve (Table III). The adsorption capacity of the first time shows the order of SBA-15-B (0.690 g/g) >AC (0.410 g/g) > SG (0.230 g/g). The n-hexane breakthrough curves of SBA-15, SBA-15-A, and SBA-15-C are shown in Fig. S4(a), and the their shapes are similar to that of SBA-15-B [Fig. 6(a)]. SBA-15 has the longest breakthrough time (51 min) [Fig. S4(b)] and the highest equilibrium n-hexane adsorption capacity (0.75 g/g) [Fig. S4(c)] among different SBA-15. The equilibrium n-hexane adsorption capacities of different adsorbents show similar trend to that of static n-hexane adsorption process (Tables III and S1).
Three successive dynamic n-hexane adsorption and desorption properties of different samples.

The ability to keep its adsorption capacity after successive adsorption and desorption cycles is one of the main characteristics of a good adsorbent. Adsorption experiments with three consecutive cycles were performed to investigate the regeneration and reuse properties. After each adsorption cycle, the equilibrium adsorbed different SBA-15, AC, and SG were heated to at 100 °C in a vacuum for 75 min until the mass of the samples did not change so that the adsorbed n-hexane can be desorbed. The regenerated adsorbents were then reused for the next adsorption procedure. The corresponding dynamic equilibrium adsorption capacities of n-hexane on different adsorbents for three consecutive cycles are shown in Table III for comparison. As can be seen from Tables III and S1, siliceous samples (different SBA-15 and SG) show stable breakthrough times and dynamic equilibrium adsorption capacities in 3 cycles with very slight variations. The first desorption efficiencies of siliceous samples were very close to 100%. However, the desorption efficiency of AC in the first cycle is only 53.6%, and the breakthrough time and the dynamic equilibrium adsorption capacity decreased dramatically in the second cycle (Table III), similar to that observed in the static adsorption process [Fig. 5(a)]. The results indicate that regeneration under the chosen experimental conditions was unsuccessful in desorbing the adsorbed n-hexane from some of the adsorption sites and thus the adsorption capacity decreased. After 3 cycles of adsorption, the AC adsorption capacity of n-hexane was kept constant (0.27 g/g) and almost 65.9% of the corresponding 1 cycle value. Considering the breakthrough time, the equilibrium adsorption capacity, and the stability performance, it is concluded that SBA-15-TMCS exhibits better dynamic adsorption performance compared to commercial AC and SG.
IV. CONCLUSIONS
In this study, hydrophobic SBA-15 was obtained by postgrafting with TMCS. The static and dynamic adsorption and desorption results show that SBA-15-B has low water vapor adsorption capacity, high VOC adsorption capacity, good stability, and recyclability, compared with commercial AC and SG, which are related to the hydrophobic functionalized surface and high surface area. The water vapor adsorption capacities of all the samples are linear to the corresponding densities of surface hydroxyl groups. With excellent adsorption and desorption performance, SBA-15-TMCS may be a potential candidate for VOC controlling.
Supplementary Material
To view supplementary material for this article, please visit http://dx.doi.org/10.1557/jmr.2016.40.
ACKNOWLEDGMENT
This work is supported by the National Science Foundations of China (21101017, 21571024, 21276029, and 51574044), Qing Lan Project of Jiangsu Province (No. SCZ1409700002), Jiangsu Province Science and Technology Support Program (BE2011651), Key University Science Research Project of Jiangsu Province (11KJA610002), Jiangsu Province 333 High Level Personnel Training Project of Scientific (BRA2015375) and Industry and Research Perspective in Jiangsu Province(BY2015027-01) and the Opening Fund from Provincial Key Laboratory of Oil & Gas Storage and Transportation Technology, Jiangsu, P. R. China (cy1201).