INTRODUCTION
Mesoscale hydrodynamic structures in the marine environment (i.e. fronts and eddies), regardless of the nature of their driving forces, have long been acknowledged for their potential influence on patterns of biological distributions (e.g. Owen, Reference Owen and Longhurst1981; Robinson, Reference Robinson and Robinson1983; Le Fèvre, Reference Le Fèvre1986). Such physical features have been suggested to assemble the biotic components in the water column, either via injecting nutrients into the euphotic zone (through diapycnal mixing) and fuelling a subsequent channel of energy upward the food web and/or by enhancing the passive accumulation of individuals of several trophic levels. However, these impacts are highly dependent on the time scale of a given feature as well as the generation times of the organisms (Kiørboe, Reference Kiørboe1993).
The response of mesozooplankton to this kind of physical variability is of particular interest, mainly considering their position in the food web and the possible implications for higher trophic levels. Nowadays, there is a considerable amount of information with respect to permanent Mediterranean frontal structures (e.g. Almeria-Oran front: Gaudy & Youssara, Reference Gaudy and Youssara2003; Catalan front: Alcaraz et al., Reference Alcaraz, Calbet, Estrada, Marrasé, Saiz and Trepat2007; Mallorca channel: Fernández de Puelles et al., Reference Fernández de Puelles, Valencia, Jansá and Morillas2004; Liguro-Provençal front: Pinca & Dallot, Reference Pinca and Dallot1995; Molinero et al., Reference Molinero, Ibanez, Souissi, Bosc and Nival2008; north-eastern Aegean front: Zervoudaki et al., Reference Zervoudaki, Nielsen, Christou and Siokou-Frangou2006, Reference Zervoudaki, Christou, Nielsen, Siokou-Frangou, Assimakopoulou, Giannakourou, Maar, Pagou, Krasakopoulou, Christaki and Moraitou-Apostolopoulou2007), revealing their possible strong biological differentiation (for instance elevated mesozooplankton stock, distinct species assemblages and increased vital rates) compared to the surrounding waters.
Unlike fronts, the control exerted by eddy-motions on the organization of zooplankton communities is less studied particularly considering the small-scaled eddies generated in the Mediterranean waters. Circulation pattern of these eddies has been reported to affect local mesozooplankton productivity levels, i.e. high values in cyclones versus low values in anticyclones (Pancucci-Papadopoulou et al., Reference Pancucci-Papadopoulou, Siokou-Frangou, Theocharis and Georgopoulos1992; Mazzocchi et al., Reference Mazzocchi, Christou, Fragopoulu and Siokou-Frangou1997), however, persistence in time may be also important for the observed biological outcome (Mazzocchi et al., Reference Mazzocchi, Christou, Fragopoulu and Siokou-Frangou1997). Riandey et al. (Reference Riandey, Champalbert, Carlotti, Taupier-Letage and Thibault-Botha2005) have reported a rather variable influence of Algerian eddies on the mesozooplankton component. These eddies can often result in the increase of the generally poor zooplankton biomass of the area and affect the distribution of species. Eddies have also been shown to be of primary importance in the formation of distinct copepod assemblages (Siokou-Frangou et al., Reference Siokou-Frangou, Christou, Fragopoulu and Mazzocchi1997). They may provide a favourable environment for the growth of specific zooplanktonic taxa influencing community structure and species diversity (Pinca & Dallot, Reference Pinca and Dallot1995).
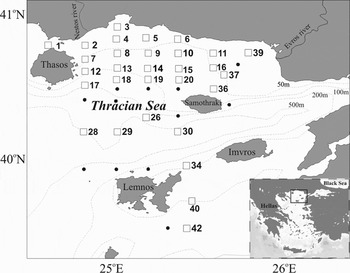
This study was carried out in the north-eastern part of the Aegean Sea (NEA) which is a complex and dynamic marine system situated at the north-eastern most part of the Mediterranean (Figure 1). The hydrodynamic complexity of this system has been considered closely linked, due to the geographical vicinity with the Dardanelles Strait, to the surface outflow of low salinity (<30 psu) waters of Black Sea origin (Black Sea waters (BSW)). Water circulation patterns in the area have been characterized by a high spatiotemporal variability and result in the generation of various frontal and gyre structures (Zodiatis & Balopoulos Reference Zodiatis and Balopoulos1993; Zervakis & Georgopoulos, Reference Zervakis and Georgopoulos2002). Almost permanently, one branch of the BSW follows a northward direction towards the Thracian Sea where it is captured by an anticyclonic gyre formed around the island of Samothraki (Samothraki gyre) (Zervakis & Georgopoulos, Reference Zervakis and Georgopoulos2002).
Geographical location of the study area and distribution of sampling sites. □, Hydrographic and mesozooplankton stations; •, hydrographic stations.

The variation of zooplankton assemblages across the strong frontal structure generated near the BSW exit into the Aegean Sea has been lately studied by Zervoudaki et al. (Reference Zervoudaki, Nielsen, Christou and Siokou-Frangou2006). A recent investigation of mesozooplankton distribution in the surface layer (0–50 m) over the NEA (Isari et al., Reference Isari, Ramfos, Somarakis, Koutsikopoulos, Kallianiotis and Fragopoulu2006) also revealed a considerable influence of horizontal oceanographic variability in the assemblage structure. However, taking into account that BSW are mainly restricted in the upper ~0–20 m layer (Zodiatis & Balopoulos Reference Zodiatis and Balopoulos1993; Zervakis & Georgopoulos, Reference Zervakis and Georgopoulos2002), sampling the 0–50 m layer in the study of Isari et al. (Reference Isari, Ramfos, Somarakis, Koutsikopoulos, Kallianiotis and Fragopoulu2006) may have masked the actual BSW influence.
In this paper, we examine the mesozooplankton community structure in the NEA in the exact layer of BSW influence (surface down to the base of the halocline: ~0–20 m) as well as in the subsurface layer (~20–50 m). Sampling was carried out during July 2004 over a sampling grid quite similar to that of Isari et al. (Reference Isari, Ramfos, Somarakis, Koutsikopoulos, Kallianiotis and Fragopoulu2006), but with a denser coverage over the Thracian Sea shelf where the Samothraki gyre is located. The horizontal distribution patterns of the major mesozooplankton groups (e.g. copepods, cladocerans and appendicularians) in the surface layer (~0–20 m) have been already presented in Isari et al. (Reference Isari, Psarra, Pitta, Mara, Tomprou, Ramfos, Somarakis, Tselepides, Koutsikopoulos and Fragopoulu2007) and discussed in relation to the ambient abiotic parameters and possible biological interactions, not only between mesozooplankters but also with the other (lower or upper) trophic levels. The principal objectives of the present paper were to assess: (a) how the hydrodynamic partitioning of NEA regarding the upper layer of the water column may influence the entire mesozooplankton community structure (including copepod species composition); and (b) how the dynamics of the prominent eddy of the area, the Samothraki gyre, may affect the distribution of mesozooplankton in the upper water column (0–50 m).
MATERIALS AND METHODS
Sampling procedure and analysis
Hydrographic and mesozooplankton sampling was carried out during the summer thermal stratification period, from 10 to 17 July 2004. Conductivity–temperature–depth (CTD) deployments were performed in a total of 42 stations (Figure 1) using a SEABIRD SBE 9 profiler equipped with a fluorometer, in order to measure fluorescence in the water column. Mesozooplankton data were collected from 30 sites (Figure 1) during daylight hours with vertical stratified tows of a WP-2 closing net (200 µm mesh size, mouth area of 0.25 m2).
Two depth intervals (Layer 1 and Layer 2) were sampled according to the physical structure of the water column as revealed by the in situ examination of CTD profiles. Layer 1 was extended from the sea surface down to the base of the halocline (~0–20 m, coinciding with the pycnocline), while Layer 2 from the base of the halocline down to 50 m depth or near the bottom at shallower stations. Due to malfunction of the closing mechanism equipment, the second depth stratum (Layer 2) was sampled only in 16 out of the 24 stations that permitted sampling of the second layer (station depth > 20 m). All samples were preserved in 4% borax–buffered sea water formaldehyde solution.
In the laboratory, all samples were divided using a Folsom splitter. The first half was filtered onto pre-dried and pre-weighed, glass-fibre filters (Whatman GFC) and dried at 60°C for 24 hours before the dry weight determination. Estimations of zooplankton biomass based on samples fixed in formalin are affected by formalin-related changes in zooplankton biochemical content (Omori & Ikeda, Reference Omori and Ikeda1984). However, we assumed that this would not bias our conclusions on the general distribution patterns of zooplankton biomass during the survey. The other half of the sample was used for species composition analysis and the estimation of total abundance. Mesozooplankton was identified to the lowest possible taxonomic level. Identification was done to the species level for cladocerans and copepods (apart from the copepodites and males of the genera Clausocalanus, Oithona and Oncaea), while all the other taxa were identified to phylum, class or order levels. Assuming 100% filtration efficiency of the net, dry weight and abundance values were standardized to cubic metre.
Data analysis
To describe the copepod community structure, species richness (S) as the total numbers of species at each site and log2 Shannon–Wiener diversity index (H′) (Shannon & Weaver, Reference Shannon and Weaver1963) was computed. Data on adult copepods only (both males and females) were used for the latter index. Males of the genera Clausocalanus, Oithona and Oncaea were not identified to the species level. For these genera, relative species abundance of males was assumed to be equal to females.
Multivariate analyses, i.e. hierarchical agglomerative average-linkage clustering and non-metric multidimensional scaling (NMDS) (Clarke & Warwick, Reference Clarke and Warwick1994) were applied to the species-samples data set. Abundance values of all mesozooplankton taxa identified in the samples were square root transformed in order to down-weight the contribution of very dominant as well as very rare taxa. The transformed data were subsequently used to produce a sample-to-sample matrix for each separate depth stratum, calculated as Bray–Curtis similarity index. Prior to ordination, ‘outlier’ sample sites identified by cluster analysis were removed from the data set to obviate problems associated with such outliers, e.g. biasing or dominating the ordination, often compressing the distribution of the remaining sites (Hosie & Cochran, Reference Hosie and Cochran1994).
Analysis of variance was performed on log(x + 1) transformed abundance values to identify significant differences in total mesozooplankton abundance among the groups of samples defined by the cluster analysis. Multiple comparisons among means were done using the Student–Newman–Keuls (SNK) test (Zar, Reference Zar1999); t-tests were also performed on similarly transformed mesozooplankton data to test for significant differences in mesozooplankton stock or taxa abundance, between the different sampling strata.
In order to relate community structure with environmental parameters, ordination scores produced by the NMDS were related by multiple regression analysis with various environmental variables to determine which of these parameters could best explain the mesozooplankters' distributions (Kruskal & Wish, Reference Kruskal and Wish1978; Hosie & Cochran, Reference Hosie and Cochran1994). In the regression analysis the NMDS scores were treated as the independent variables and each environmental parameter as the dependent variable. Regression lines and their directions were plotted in the NMDS graphs according to Kruskal & Wish (Reference Kruskal and Wish1978): the direction of maximum correlation of each regression line is at an angle φr with the rth MDS axis. The direction cosine, or regression weight cr, of that angle is given by the formula:
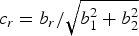
where b1 and b2 are the coefficients from the multiple regression a + b1x1 + b2x2 and x1 and x2 are the scores in the first and second MDS axis, respectively. The parameters examined were mean temperature, mean salinity and integrated fluorescence of the depth stratum at each station.
RESULTS
Environmental conditions
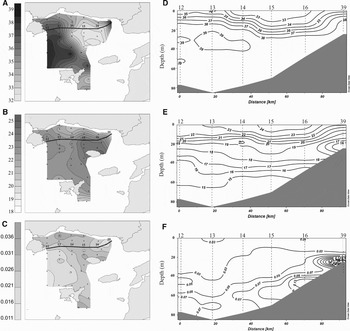
The thermohaline structure of the water column in the studied area during the survey has been already described in detail by Isari et al. (Reference Isari, Psarra, Pitta, Mara, Tomprou, Ramfos, Somarakis, Tselepides, Koutsikopoulos and Fragopoulu2007). In the easternmost part of the Thracian Sea the relatively less saline and warmer waters denoted the presence of an anticyclonic gyre (the Samothraki gyre) where a large amount of the advected BSW was entrapped (Figure 2A, B). Colder and saltier waters occupied the western and offshore part of the surveyed area (Figure 2A, B). Sections of salinity and temperature over a longitudinal transect (Station 12 to Station 39) across the Thracian Sea continental shelf revealed the horizontal (~50 km) and vertical (~20 m) dimensions of the gyre (Figure 2D, E).
Contour maps of salinity (A), temperature (°C) (B) and fluorescence (arbitrary units) (C) at 10 m depth. Sections of salinity (D), temperature (E) and fluorescence (F) over a longitudinal transect (Station 12 to Station 39) across the Thracian Sea continental shelf (redrawn from Isari et al. (Reference Isari, Psarra, Pitta, Mara, Tomprou, Ramfos, Somarakis, Tselepides, Koutsikopoulos and Fragopoulu2007) with kind permission of Springer Science and Business Media).

Fluorescence map at 10 m depth indicated a gradient from west to east (Figure 2C). The south-western region with high salinity waters presented lower fluorescence than the coastal sites. Deeper layers exhibited increased fluorescence compared to surface layers, indicating near-bottom chlorophyll maxima (Figure 2F).
Mesozooplankton community
LAYER 1: FROM SEA SURFACE TO THE BASE OF HALOCLINE (~0–20 M)
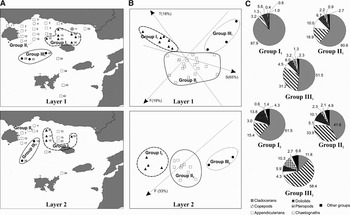
The spatial distribution of mesozooplankton stock and abundance of major mesozooplankton groups in Layer 1 has already been presented in Isari et al. (Reference Isari, Psarra, Pitta, Mara, Tomprou, Ramfos, Somarakis, Tselepides, Koutsikopoulos and Fragopoulu2007). In the present paper, cluster analysis was applied to the entire mesozooplankton biota (including copepod and cladoceran species) (Tables 1 & 2) revealing at the 67% similarity level three major groups of samples (Groups I1, II1 and III1; Figure 3A) with a clear distinction in group and species composition (see below). This grouping, being also evident in the NMDS ordination (Figure 3B), seemed to be closely associated with hydrographic features and the location of sampling sites in relation to the Samothraki gyre.
(A) Maps showing group of stations (corresponding to group of samples) defined by the cluster analysis in each sampling layer (Layer 1, 0-base of halocline; Layer 2, base of halocline-50 m); (B) ordination plots of the comparison between samples of each layer using non-metric multidimensional scaling and Bray–Curtis similarity index. Respective cluster groups are indicated. Significant multiple regressions between ordination scores and environmental parameters (S, salinity; T, temperature; F, integrated fluorescence) are shown, as well as the fraction (%) of variance in the mesozooplankton data explained by the parameters (▴, Groups I1 and I2; □, Groups II1 and II2; •, Groups III1 and III2;  , outlier station); (C) mean relative density (%) of the major mesozooplankton groups for each group of samples in the two discrete layers.

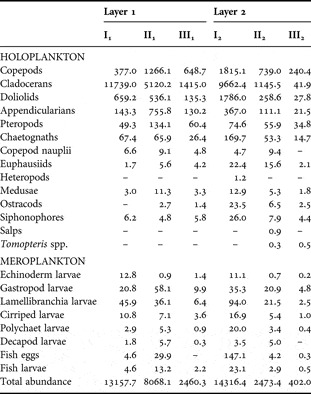
List of major mesozooplankton groups identified in the samples of the two sampling layers (Layer 1, 0-base of halocline; Layer 2, base of halocline-50 m). Mean abundance values (ind. m−3) per group of samples defined by the cluster analysis (Layer 1, Groups I1, II1 and III1; Layer 2, Groups I2, II2 and III2) are given.

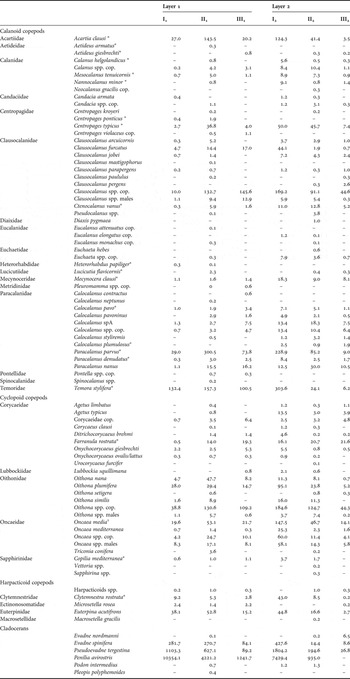
List of copepod and cladoceran taxa identified in the samples of the two sampling layers (Layer 1, 0-base of halocline; Layer 2: base of halocline-50 m). Mean abundance values (ind. m−3) per group of samples defined by the cluster analysis (Layer 1, Groups I1, II1 and III1; Layer 2, Groups I2, II2 and III2) are given.

cop., copepodites; *, copepodites + adults; 1, includes the triplet of the cryptic species O. media, O. scottodicarloi and O. waldemari.
Group I1 comprised seven samples collected from sites around the island of Samothraki (gyre area), Group II1 included mainly stations situated inside the continental shelf boundaries, while three stations (Station 26, 28 and 29) in the western and offshore part of the studied area with bottom depth exceeding 250 m formed Group III1 (Figure 3A). One sample collected from a coastal station (Station 11), was also defined as an outlier.
Mesozooplankton stock differed significantly between the three Groups of stations (F = 11.98, P < 0.001): It was higher in Group I1 (gyre-Group), intermediate in Group II1 and lower in Group III1 (Table 1). Cladocerans, predominated in the community structure within the gyre-Group, mainly represented by the species Penilia avirostris and Pseudoevadne tergestina (Table 2), and reduced gradually from Group I1 to Groups II1 and III1 (Table 1; Figure 3C). Zooplankters with particularly low concentrations within the gyre (Group I1) such as copepods and appendicularians, were considerably more abundant in Group II1 (Table 1) and contributed at a higher percentage to the community structure (Figure 3C). Doliolids consisted also an important taxon all over the study area (Figure 3C), nevertheless they were found at lower densities in Group III1 (Table 1). The latter station group generally depicted the lowest abundance values for most of the mesozooplankton taxa (Table 1).
An additional spatial differentiation was observed in the copepod assemblage over the surveyed area. Among the 61 copepod taxa identified in Layer 1 of the entire area (Table 2), only an average of 15 were detected per station in the gyre area (Group I1) and the Shannon–Weiner (H′) diversity index based on adults had a mean of 2.8. Temora stylifera along with its copepodites was by far the dominant copepod in this station group representing up to 64% of total copepods abundance. Other species, the harpacticoid Euterpina acutifrons, the cyclopoid Oithona plumifera along with total copepodites of Oithona and the calanoids Paracalanus parvus and Acartia clausi followed in rank order, with their mean relative abundance ranging between 5 and 10%. Contrary to the gyre-Group, the two others (Groups II1 and III1) presented higher species number and H′ (23 species per station; Group II1: H′ = 3.3, Group III1: H′ = 3.7). Paracalanus parvus was the most important copepod species in Group II1 (24% of total copepods) followed by taxa with a mean relative density of about 10%, i.e. copepodites of Clausocalanus spp., copepodites of Oithona spp., Temora stylifera and Acartia clausi. The non-calanoids Oncaea media, Oithona nana and Euterpina acutifrons were also present with a mean relative density around 4%. The dominant copepods in Group III1 in rank order were the copepodites of Clausocalanus spp., Oithona spp., Temora stylifera and Paracalanus parvus (with their relative density ranging between 11 and 21%).
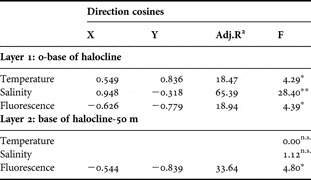
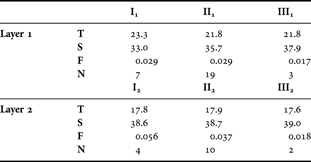
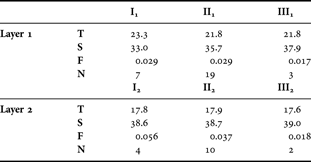
Relating mesozooplankton assemblage structure to hydrology, we found all the examined parameters to explain an amount of the variation in the NMDS ordination (Table 3). Based on relative angles of intersection, mean salinity and temperature in the upper sampling layer seemed to be related to the differentiation of gyre-stations (Group I1) from Group II1 (lower mean salinity and higher mean temperature in the stations of the anticyclonic zone) (Figure 3B). Integrated fluorescence appeared to explain the differentiation of the pelagic Group III1 from Groups I1 and II1, (pelagic stations had lower fluorescence values) (Figure 3B). Mean values of these parameters per group are presented in Table 4.
Multiple regression analysis between various parameters (temperature, salinity and fluorescence) and the non-metric multidimensional scaling scores for two-axis ordination of samples (*, P<0.05; **, P < 0.01; n.s., not significant).

Mean values for temperature (T, °C), salinity (S, psu) and integrated fluorescence (F, arbitrary units) for the sample groups defined by the cluster analysis in the two distinct sampling layers (Layer 1, 0-base of halocline, Layer 2, base of halocline-50 m). N, number of samples.
LAYER 2: FROM THE BASE OF HALOCLINE DOWN TO 50 M DEPTH
Cluster analysis divided the 16 samples collected from this layer into three groups (Groups I2, II2 and III2) (Figure 3A) at the 56% similarity level. This grouping was also evident in the respective NMDS ordination (Figure 3B). Group I2 comprised samples from four stations located at the periphery of the anticyclonic zone (Stations 9, 14, 19 and 16). Group II2 corresponded to the remaining sites with the exception of two stations (Stations 18 and 28) in the south-western part of the surveyed area, which formed Group III2 (Figure 3A). Mean mesozooplankton abundance presented a significant decrease (F = 48.24, P < 0.001) from Group I2 to Groups II2 and III2 (Table 1). This gradual decrease was followed by a change in the contribution of the major zooplankters in the assemblage structure, similar to that described for the respective station groups of the surface layer (Groups I1–III1; Figure 3C). The copepod community in Group III2 showed the highest mean number of species and diversity per station (31 species, H′ = 3.9) when compared to Groups I2 and II2 (27 and 26 species respectively, H′ = 3.7). Temora stylifera along its copepodites were particularly important in Group I2, whereas copepodites of the genera Oithona and Clausocalanus were more abundant in the other station groups. The actual contribution of the rest of the identified taxa is listed in Table 2. Among the parameters examined, only integrated fluorescence in the sampling layer (~20–50 m) showed a significant relationship with ordination scores (Table 3), with an increasing trend from Group III2 towards Groups I2 and II2 (Table 4; Figure 3B).
VERTICAL DISTRIBUTION OF MESOZOOPLANKTON WITHIN THE 0–50 M LAYER
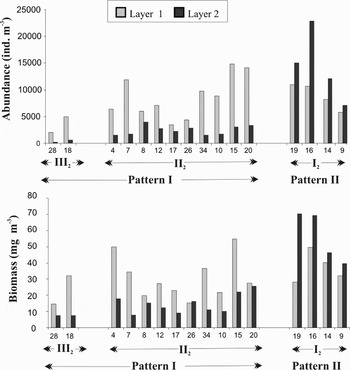
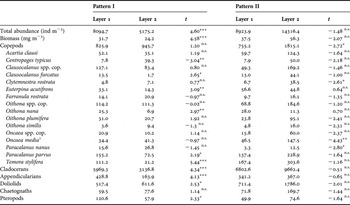
Considering the 16 stations where sampling was successfully performed in both sampling layers, two distinct trends were discerned in the vertical distribution pattern of abundance and dry weight values (hereafter referred to as Pattern I and Pattern II) (Figure 4). The majority of the sites (station Groups II2 and III2 in Figure 3A) presented a decrease in the mesozooplankton stock in the deeper stratum (base of halocline-50 m) comparatively to the surface layer (Pattern I). An inverse trend (Pattern II) was revealed for the four sites located at the periphery of the anticyclone (station Group I2 in Figure 3A). Layer 1 of stations presenting Pattern I had significantly higher total abundance and biomass (Table 5), whereas the differences between Layer 1 and Layer 2 were not statistically significant for stations exhibiting Pattern II.
Vertical distribution patterns (Layer 1, 0-base of halocline; Layer 2, base of halocline-50 m) of total mesozooplankton abundance (ind. m−3) and biomass (mg m−3) throughout the study area (Pattern I, Layer 1> Layer 2; Pattern II, Layer 2> Layer 1). Groups of stations identified by cluster analysis in Layer 2 (Groups I2, II2 and III2) are indicated.

Mean values of total mesozooplankton stock and abundance of the major taxa (ind. m−3) for the two sampling layers (Layer 1, 0-base of halocline; Layer 2, base of halocline-50 m) according to the vertical distribution pattern of total mesozooplankton stock of the stations (Patterns I and II). Results of t-tests are given for each pattern (n.s., not significant; *, <0.05; **, <0.01; ***, <0.001).

1, includes the triplet of the cryptic species O. media, O. scottodicarloi and O. waldemari.
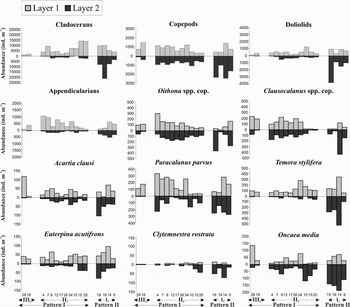
The mesozooplankton group and copepod species vertical distribution showed heterogeneity among sites, mostly related to the general pattern of vertical distribution (Patterns I or II) (Table 5; Figure 5). Cladocerans, doliolids, appendicularians and pteropods were found at significantly higher concentrations within the halocline layer (Layer 1), with the exception of sites displaying Pattern II (Table 5). In the latter case no significant differences were found between the two sampling layers. Chaetognath abundance did not present any significant difference for both Patterns I and II. Copepods did not present significant difference between the two sampling layers of Pattern I-sites, whereas they were significantly more abundant in the layer below the halocline (Layer 2) at sites presenting Pattern II (Table 5; Figure 5).
Abundance (ind. m−3) of major mesozooplankton groups and dominant copepod species per sampling layer (Layer 1, 0-base of halocline; Layer 2, base of halocline-50 m) throughout the study area. Distinct patterns in total mesozooplankton vertical distribution (Patterns I and II, see Figure 4) as well as groups of stations identified by cluster analysis in Layer 2 (Groups I2, II2 and III2) are indicated.

Moreover, many copepod species dominant in the surveyed area presented different depth distributions for Pattern I and Pattern II stations (Table 5; Figure 5). Copepodites of the genera Oithona and Clausocalanus as well as the species Oithona plumifera, Acartia clausi and Farranula rostrata were distributed homogeneously in both depth layers over the entire studied area (Table 5). However, some species with clear preference for the surface layer in the majority of sites, i.e. Temora stylifera, Euterpina acutifrons, Paracalanus parvus and Clausocalanus furcatus were recorded in relatively higher concentrations in Layer 2 for Pattern II-sites (Group I2) (Table 5; Figure 5). Interestingly, the harpacticoid Clytemnestra rostrata and the cyclopoid Oncaea media (along with the copepodites and males of this genus) were more abundant in the deeper layer of the broader anticyclonic zone (Stations 10, 15 and 20 and Group I2) (Table 5; Figure 5).
DISCUSSION
Recent studies on the structure of zooplankton assemblages in the marine system of NEA have revealed new data regarding the controlling mechanisms of this system and its biological complexity. Broad scale investigations, mainly conducted during the thermal stratification period, have underlined the major role of the inflow and advection of BSW in the formation of mesozooplankton (Isari et al., Reference Isari, Ramfos, Somarakis, Koutsikopoulos, Kallianiotis and Fragopoulu2006; Zervoudaki et al., Reference Zervoudaki, Nielsen, Christou and Siokou-Frangou2006) and ichthyoplankton assemblages (Isari et al., Reference Isari, Fragopoulu and Somarakis2008). These studies point out that variability in zooplankton distribution patterns at different temporal scales (seasonal and inter-annual), is highly related to respective changes in the horizontal extension of the BSW.
The hydrological data collected during the present study clearly revealed a strong influence of the BSW in the upper part of the water column. Low salinity waters of Black Sea origin, were advected towards the eastern part of the Thracian shelf and subsequently captured by an anticyclone of ~50 km wide around the island of Samothraki (Samothraki gyre). This feature resulted in the convergence and downwelling of BSW down to 20 m depth, hence less saline and warmer waters were observed around this island. Mesozooplankton sampling in two discrete layers (within and below the halocline) facilitated the better understanding of the influence of BSW on mesozooplankton distribution and assemblage structure, but also provided some preliminary information for the dynamics of the Samothraki gyre.
Layer 1: from sea surface to the base of halocline (~0–20 m)
Sampling in the actual layer of BSW influence (Layer 1) revealed a marked spatial differentiation in mesozooplankton abundance and taxonomic group composition throughout the NEA. Stations around the island of Samothraki (Group I1), which were highly influenced by the low salinity–high temperature gyre waters, presented increased mesozooplankton stock as well as a distinctive species composition and abundance (striking dominance of Penilia avirostris, and remarkably low densities of appendicularians and copepods). A prominent shift in the assemblage structure was detected towards the western and offshore part of the NEA. This change in the community organization was found significantly related to the spatial variability in temperature, salinity and fluorescence (Figure 3B) and mainly involved a general decrease in both total abundance values and cladocerans' relative importance as well as an opposite trend regarding the mean contribution of copepods.
Our results clearly showed that the 50-km anticyclone around the island of Samothraki, despite its rather small size, provided distinct boundaries for the meso-sized heterotrophic plankton component. Similarly, other mesoscale anticyclonic eddies, but usually much larger, exhibit distinct mesozooplankton assemblages compared to adjacent waters (e.g. Ligurian Sea: Pinca & Dallot, Reference Pinca and Dallot1995; Canary Islands: Hernández-León et al., Reference Hernández-León, Almeida, Gomez, Torres, Montero and Portillo-Hahnfeld2001; Bay of Biscay: Isla et al., Reference Isla, Ceballos, Huskin, Anadón and Álvarez-Marqués2004; Algerian basin: Riandey et al., Reference Riandey, Champalbert, Carlotti, Taupier-Letage and Thibault-Botha2005; North Pacific: Mackas et al., Reference Mackas, Tsurumi, Galbraith and Yelland2005). Hence, the ecological effects of such physical features seem to be not necessarily dependent on their spatial scale (Owen, Reference Owen and Longhurst1981). It is rather the relative size, i.e. the eddy-size in relation to the dimension of the area where it forms that determines its effects (Weikert & Koppelmann, Reference Weikert and Koppelmann1993).
The increased productivity in terms of mesozooplankton stock within the Samothraki gyre appears rather exceptional to what is generally expected for anticyclones. The convergent tendency within an anticyclone (downward motion in the interior of the eddy) theoretically prevents nutrient-pumping from deeper layers, which would negatively affect the populations of organisms at higher trophic levels (Lalli & Parsons, Reference Lalli and Parsons2002). Indeed, low mesozooplankton concentrations compared to surrounding waters have been reported for anticyclonic eddies in the Levantine Basin (Pancucci-Papadopoulou et al., Reference Pancucci-Papadopoulou, Siokou-Frangou, Theocharis and Georgopoulos1992; Mazzocchi et al., Reference Mazzocchi, Christou, Fragopoulu and Siokou-Frangou1997). Nevertheless, a site intensive study over a complex eddy-field in the Algerian basin showed recently that the impact of mesoscale eddies on productivity levels could be depended, not only on their intrinsic dynamics (cyclonic or anticyclonic circulation pattern), but also on their actual location and season (Riandey et al., Reference Riandey, Champalbert, Carlotti, Taupier-Letage and Thibault-Botha2005).
In the present study, the observation of high mesozooplankton stock within the Samothraki gyre could be explained by a combination of parameters such as the sampling date (season) and the physicochemical properties of the gyre waters. The increased abundance of mesozooplankton within this gyre was mostly due to the outstanding numerical dominance of the thermophilic cladoceran Penilia avirostris. The temporal match between our sampling and the seasonal cycle of P. avirostris in the Mediterranean waters (Atienza et al., Reference Atienza, Saiz, Skovgaard, Trepat and Calbet2008 and references therein) can explain the generally high abundance of this species all over the Thracian shelf during the studied period. However, the higher temperature and other biochemical characteristics of the gyre waters may have favoured the rapid development of a spatially constrained population as has been discussed by Isari et al. (Reference Isari, Psarra, Pitta, Mara, Tomprou, Ramfos, Somarakis, Tselepides, Koutsikopoulos and Fragopoulu2007). Hence, it seems that the high mesozooplankton concentrations observed within the Samothraki gyre are closely related to some particular characteristics of the waters entrapped in the anticyclone (of BSW origin). In other regions, mesoscale anticyclonic structures exhibited elevated zooplankton biomass and abundance, mainly due to high numbers of specific taxa (Pinca & Dallot, Reference Pinca and Dallot1995) or were characterized by accumulation and retention of large zooplankters (Hernández-León et al., Reference Hernández-León, Almeida, Gomez, Torres, Montero and Portillo-Hahnfeld2001).
Biological responses to a single physical structure (front or eddy) may differ among various zooplankton taxa (Pinca & Dallot, Reference Pinca and Dallot1995; Mackas et al., Reference Mackas, Tsurumi, Galbraith and Yelland2005; Riandey et al., Reference Riandey, Champalbert, Carlotti, Taupier-Letage and Thibault-Botha2005; Molinero et al., Reference Molinero, Ibanez, Souissi, Bosc and Nival2008) or even different developmental stages of a given species (Boucher, Reference Boucher1984). Patterns in the horizontal distribution of the major mesozooplankton groups differed markedly in this study and have been discussed in detail in Isari et al. (Reference Isari, Psarra, Pitta, Mara, Tomprou, Ramfos, Somarakis, Tselepides, Koutsikopoulos and Fragopoulu2007), especially the striking low numbers of copepods and appendicularians in the cladoceran/doliolid dominated Samothraki gyre. Interestingly, high horizontal heterogeneity was also observed in the copepod species composition as revealed in this paper. Copepods exhibited a higher contribution to community composition and increased species diversity in the western and offshore part of the NEA (station Group III1). Moreover, within the anticyclonic zone (Group I1), a distinct copepod assemblage was identified with extremely low abundances and limited species richness and diversity. The calanoid Temora stylifera was the only species found in Group I1 in numbers similar to the remaining neritic sites. Other species, relatively abundant over the Thracian shelf (station Group II1), i.e. Acartia clausi, Paracalanus parvus, Oithona spp. and Clausocalanus spp. were quite rare within the gyre area.
The observed distribution patterns of copepod species could be interpreted as reflecting interspecific differences in egg production and recruitment rates, driven by the complex interactions of several environmental factors in combination with differences in life history, behavioural and physiological traits of the various species. Temora stylifera constitutes an important species in neritic Mediterranean waters, mostly during the summer–autumn period (e.g. Siokou-Frangou, Reference Siokou-Frangou1996; Di Capua & Mazzocchi, Reference Di Capua and Mazzocchi2004), when egg production rates and hatching success are higher (Ianora & Poulet, Reference Ianora and Poulet1993, but see Halsband-Lenk et al., Reference Halsband-Lenk, Nival, Carlotti and Hirche2001). With regard to coastal Greek waters, this particular species forms, together with the cladocerans Penilia avirostris and Pseudoevadne tergestina, a thermophilic assemblage with preference for the warmest-stratified conditions (Siokou-Frangou et al., Reference Siokou-Frangou, Papathanassiou, Lepretre and Serge1998). Additionally, other authors have pointed out a positive association of T. stylifera with saline stratification (Cabal et al., Reference Cabal, Gonzáles-Nuevo and Nogueira2008). Hence, warmer and less saline waters within the gyre (Table 4) may explain high abundance of this species. However, T. stylifera was also abundant outside these waters (Table 2).
Food availability, both in terms of quantity and quality of prey, is considered to play also a key role in the reproduction of copepods and the subsequent fate of their populations (as has been also discussed for T. stylifera by Mazzocchi et al., Reference Mazzocchi, Buffoni, Carotenuto, Pasquali and Ribera d'Alcalá2006). Within the cladoceran/doliolid dominated gyre of our study, copepods were likely experiencing a strong food limitation (Isari et al., Reference Isari, Psarra, Pitta, Mara, Tomprou, Ramfos, Somarakis, Tselepides, Koutsikopoulos and Fragopoulu2007). Nevertheless, different copepod species may present a variable response to a specific nutritional regime according to their feeding selection mechanism and prey size selectivity. Temora is considered among the most advanced genera from an evolutionary perspective, characterized by continuous motion and creation of feeding current, even from the last naupliar stage NVI (Paffenhöfer, Reference Paffenhöfer1998). Moreover, recent feeding experiments on natural microbial assemblages in the Mediterranean have shown that ciliates and >5 µm phytoplankton cells both consist potential food items for the species T. stylifera (Broglio et al., Reference Broglio, Saiz, Calbet, Trepat and Alcaraz2004). Hence, dietary flexibility and continuous feeding current may have increased competitive ability of this species in the gyre environment.
Layer 2: from base of halocline down to 50 m depth
Spatial differentiation in mesozooplankton structural properties was also observed below the halocline (Layer 2). Samples from sites located over the shelf (Group I2 and Group II2) were highly differentiated from those collected in the oligotrophic pelagic area (Group III2), mainly due to their increased mesozooplankton abundances. Integrated fluorescence within the 20–50 m layer was the only parameter significantly related to the multivariate community structure, displaying higher values in the neritic compared to the pelagic sites. This result can be explained by the fact that deep fluorescence maxima (DFMs) were recorded within this actual sampling layer in the case of shelf-stations, while DFMs were found deeper and had lower values at the pelagic sites.
Despite the relative homogeneity of temperature and salinity in this sampling layer (Table 4), a strong variability in mesozooplankton community was evident for sites over the continental shelf. This variation seemed to be associated with the location of sites in relation to the Samothraki gyre. Samples collected at the periphery of the gyre (Group I2) presented higher abundances for the major mesozooplankton groups compared to the remaining samples of Layer 2 collected over the shelf (Group II2) (Table 1). Surprisingly, for stations located at the periphery of the gyre (Group I2), this deeper layer was slightly richer in total mesozooplankton even when compared to the corresponding surface layer (Layer 1). This vertical pattern (Pattern II: mesozooplankton stock of Layer 2> mesozooplankton stock of Layer 1, although of no statistical significance) contrasted with the usual pattern of the remaining stations (Pattern I: mesozooplankton stock of Layer 1> mesozooplankton stock of Layer 2).
Pattern II (the increase of mesozooplankton in the subsurface layer below the halocline) in stations located at the periphery of the anticyclone was due to an unusually high concentration of generally surface-living zooplankters in Layer 2 (e.g. cladocerans, appendicularians, Clausocalanus furcatus and Temora stylifera). This could be explained by hydrodynamic processes associated with the anticyclonic circulation. Bakun (Reference Bakun2006) who analysed the physical mechanisms involved in the formation of eddies highlighted such processes in the case of anticyclones that may elucidate our results. The complex interaction of distinct dynamic forces (Coriolis force, centrifugal force and frictional torques) results in the concentration of waters towards the interior of the eddy and the subsequent doming in the sea surface. Such a dome, increases the hydrostatic pressure in the deeper layer (below the centre of the eddy), causing a radial outward-directed flow in the sub-layer, opposite to the inward-directed flow pattern in the upper layer. Downward pumping of water of the upper layer results in a continuous three-dimensional flow configuration, connecting the flow patterns in the two layers (see figure 3b in Bakun, Reference Bakun2006). A result of such a flow configuration would be the advection of surface-dwelling zooplankters into subsurface layers at the periphery of the anticyclone. Moreover, the prominent presence of the cyclopoid Oncaea media as well as the harpacticoid Clytemnestra rostrata in Layer 2 over the anticyclonic zone might be indicative of a habitat with special ecological characteristics. Species of the genus Oncaea, are rather abundant in depths greater than 20–30 m, where they prey on sinking and aggregating material of zoo- or phytoplanktonic origin (Paffenhöfer & Mazzocchi, Reference Paffenhöfer and Mazzocchi2003). The increased presence of appendicularians in deeper waters has also been related with the presence of aggregates of organic material (Mazzocchi et al., Reference Mazzocchi, Christou, Fragopoulu and Siokou-Frangou1997). In other studies, the occurrence of epipelagic organisms (Penilia avirostris, siphonophores and appendicularians) down to the depth of 1000 m (Pancucci-Papadopoulou et et al., 1992) or the deepening of the deep chlorophyll maximum (Mazzocchi et al., Reference Mazzocchi, Christou, Fragopoulu and Siokou-Frangou1997) have been related to the downward flow and deepening of isopycnals induced by the anticyclonic circulation patterns.
CONCLUSIONS
The present study implies that, during the period of thermal stratification, the Samothraki gyre may have a considerable impact on the physicochemical and biological properties of the NEA system. The anticyclonic zone, presented a distinct copepod community structure, characterized by low abundance numbers and limited species diversity. On the contrary, this habitat was suitable for the survival and reproduction of certain taxa (cladocerans and doliolids) that can exploit the microbial food web. Although the influence of BSW was mainly restricted to the upper 20 m layer (Layer 1), complex hydrodynamic processes related to the anticyclonic circulation pattern, might further affect the mesozooplankton community structure of the deeper layer (Layer 2). Considering the potential role of this physical structure as a spawning ground for small pelagic fish (i.e. anchovy) and a retention mechanism for fish larvae (Isari et al., Reference Isari, Fragopoulu and Somarakis2008), the dynamics and food web processes associated with this feature deserve detailed future investigations.
ACKNOWLEDGEMENTS
This work was supported by the EU project ANREC (QLRT-2001-01216). The authors wish to thank the captain and the crew of RV ‘Aegaeo’ as well as all participant scientists for their support at sea. Special thanks go to two anonymous referees for their helpful comments and suggestions on the manuscript.