The hospital environment harbors potentially harmful bacteria, such as Acinetobacter baumannii, and plays an important in role in patient-to-patient transmission.Reference Boyce, Potter-Bynoe, Chenevert and King 1 – Reference Boyce 3 Environmental culturing is used in research and outbreak situations to better understand the role of the environment in transmission and to test strategies aimed at preventing transmission.Reference Wilks, Wilson and Warwick 4 Understanding the ideal methods of environmental sampling, including the optimal frequency and locations, would assist in maximizing accuracy while reducing extraneous costs and labor to hospital epidemiologists and public health officials. This study aims to provide guidance on the sampling locations and frequency required to optimally and efficiently detect A. baumannii in the patient environment.
METHODS
We performed an observational study of critically ill, A. baumannii-positive patients to assess environmental contamination at multiple environmental sites and across multiple study days. This study was conducted at an 816-bed tertiary-care hospital in Baltimore, Maryland. Critical-care units perform active surveillance for A. baumannii and patient rooms are cleaned daily by environmental services staff per hospital policy. Cohort patients were known to be colonized or infected with A. baumannii based on positive clinical or surveillance cultures and were confirmed on the day of enrollment via additional study cultures (ie, skin, perianal, respiratory, and wound if applicable). The University of Maryland Baltimore Institutional Review Board approved this study.
Environmental samples were obtained from the patient room at 10 sites selected based on previous experience and literature.Reference Hota 5 Zones were established a priori in relation to the proximity to the patient (1) direct contact to patient: bedrails, call button, IV pump, ventilator; (2) some patient contact: bedside table, vital sign monitor, supply cart; (3) minimal contact: sink, bathroom, door handle.Reference Lin and Hayden 6 A zone was considered “positive” on a particular day if at least 1 site within the zone had a positive culture. Environmental cultures were obtained using a sterile BactiSwab (Remel, Lenexa, KS), 1 swab for each site on days 1 through 7 and day 14, or if before, at patient discharge.Reference Thom, Howard and Sembajwe 7 Samples were processed using standardized laboratory procedures. Swabs were suspended in brain–heart infusion (BHI) broth and after 24-hour incubation at 37°C and were then subcultured to ChromAgar Acinetobacter agar (Gibson Laboratories, Lexington, KY) and reincubated at 37oC for 48 hours. Red colonies were identified as A. baumannii using the Vitek II system (bioMerieux, Durham, NC).
For a given day, frequency of contamination was calculated for each site or zone. Spearman correlation matrices were used for between-site and between-zone comparisons and were then compared to a Spearman correlation coefficient of 1.0 (representing perfect correlation). Sensitivity and specificity were calculated for sampling the 3 most contaminated sites compared to sampling all 10 sites; as well as for zone 1 compared to all 3 zones. Correlation of contamination across sites and days were calculated using Spearman correlation coefficient matrices. Sensitivity and specificity were calculated for only sampling on day 1 compared to sampling on both days 1 and 2. Lasagna plots were constructed to establish a visual comparison of the frequency of contamination of sites across days.Reference Swihart, Caffo, James, Strand, Schwartz and Punjabi 8 All analyses were performed using SAS version 9.4 software (SAS Institute, Cary, NC), and all figures were created using R version 3.4.0 software (R Foundation for Statistical Computing, Vienna, Austria).
RESULTS
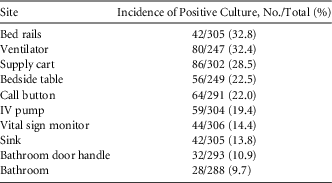
In total, 2,890 environmental samples were obtained from 80 patients from May 2012 to January 2015, ~36 samples per patient. Of 80 patients, 70 (87.5%) had contamination of at least 1 site across all study days; 533 of 2,890 (18.4%) of all samples obtained were positive for A. baumannii. On any given day, the environmental sites most often contaminated were bed rails (32.8%), ventilator (32.4%), and supply cart (29.5%) (Table 1). On day 1, zone 1 was contaminated for 43 of 80 patients (53.8%), zone 2 was contaminated for 30 of 80 patients (37.5%), and zone 3 was contaminated for 21 of 80 patients (26.3%). The odds of environmental contamination in zone 1 versus zone 2 were 4.9 (95% confidence interval [CI], 1.8–13.6; P<.01). The odds of environmental contamination in zone 1 versus zone 3 were 5.4 (95% CI, 1.6–18.0; P<.01), and the odds of environmental contamination in zone 2 versus zone 3 were 3.0 (95% CI, 1.1–8.5; P=.03).
Sites Most Often Contaminated, Ranked From Most- to Least-Often Positive

The Spearman correlation coefficient on a particular day for all pairwise sites was ≤0.05. The correlation between zone 1 and zone 2 was 0.36; the correlation between zone 1 and zone 3 was 0.33; and the correlation between zone 2 and zone 3 was 0.25. The sensitivity of sampling the 3 most contaminated sites, compared to sampling all sites, was 43%, and for zone 1, compared to sampling all zones, the sensitivity was 52% (Table 2).
Sensitivity of Specific Sites (Grouped by Frequency of Contamination) and Days Sampled

NOTE. CI, confidence interval.
a Because a negative site will never test positive, we assume that specificity will always be 100%.
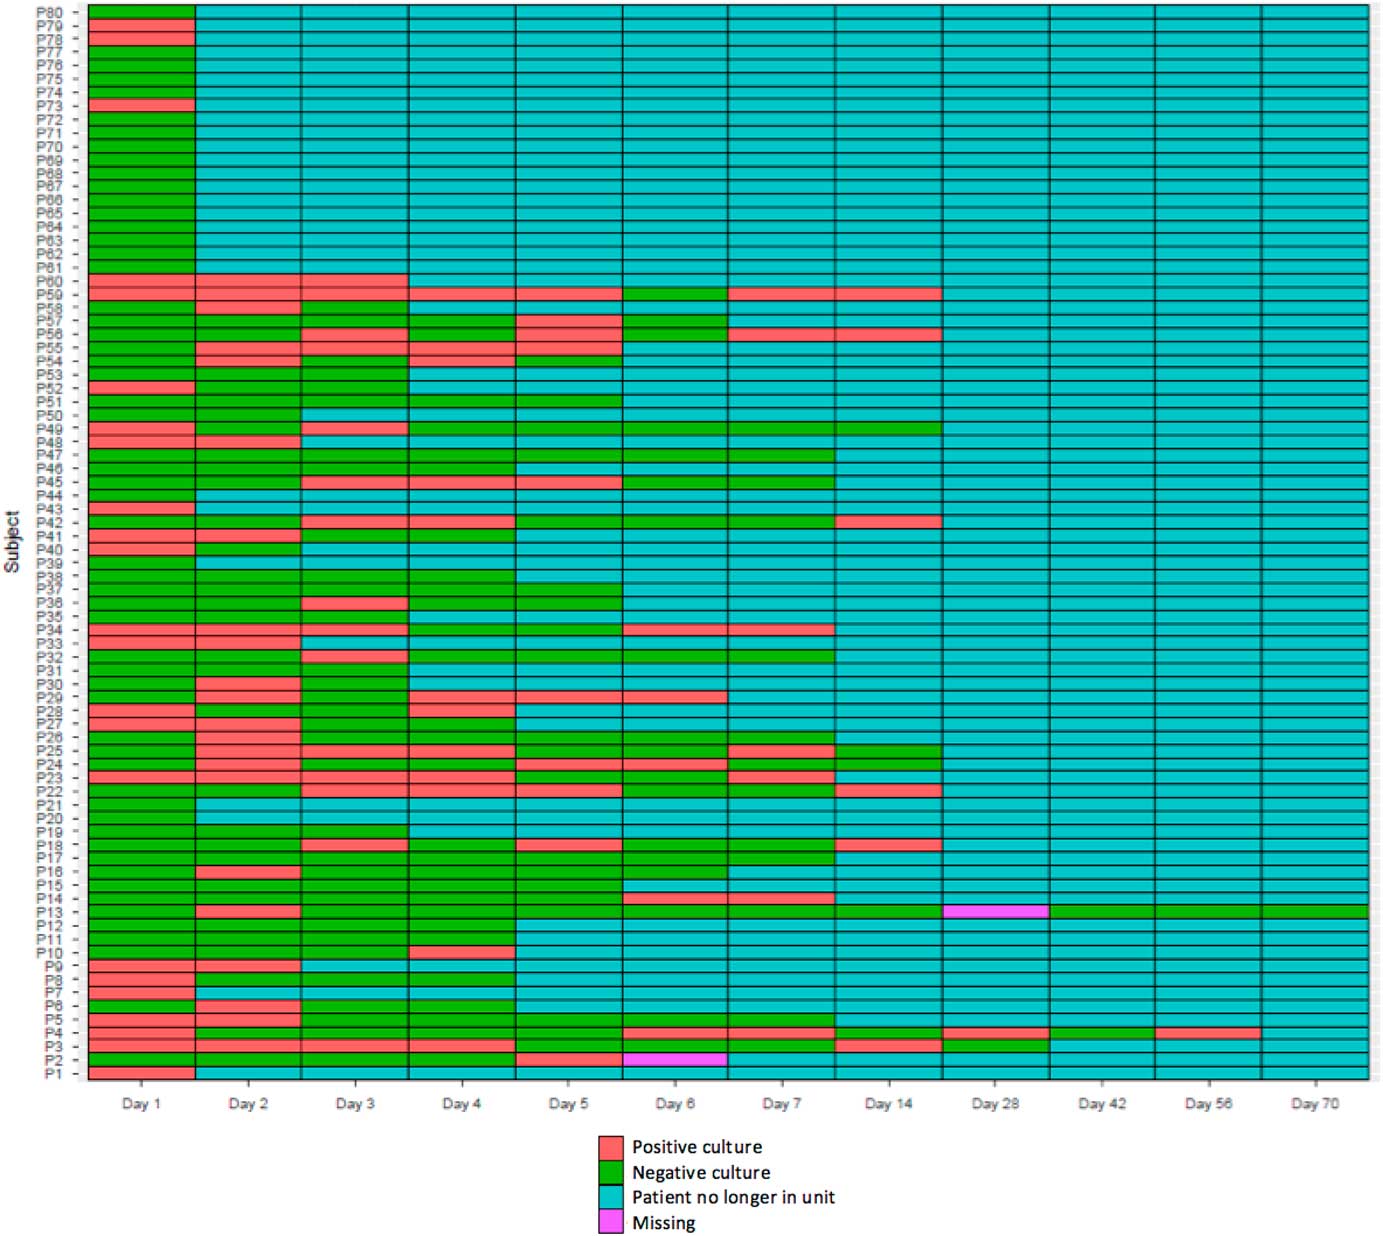
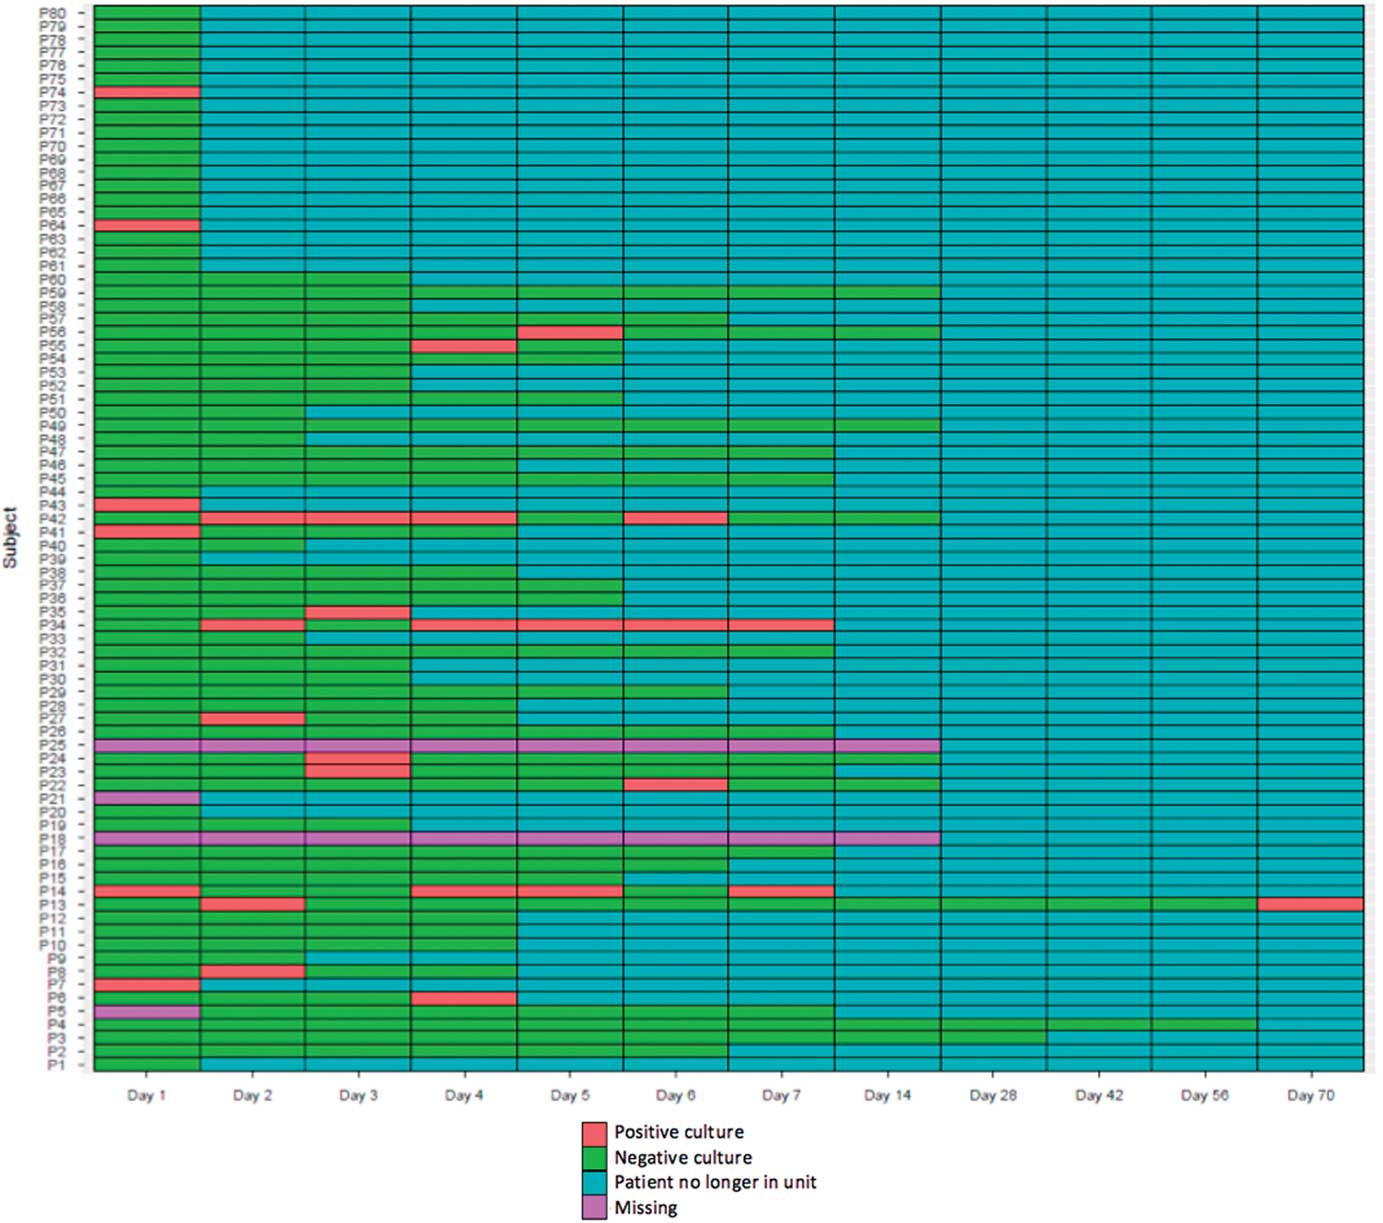
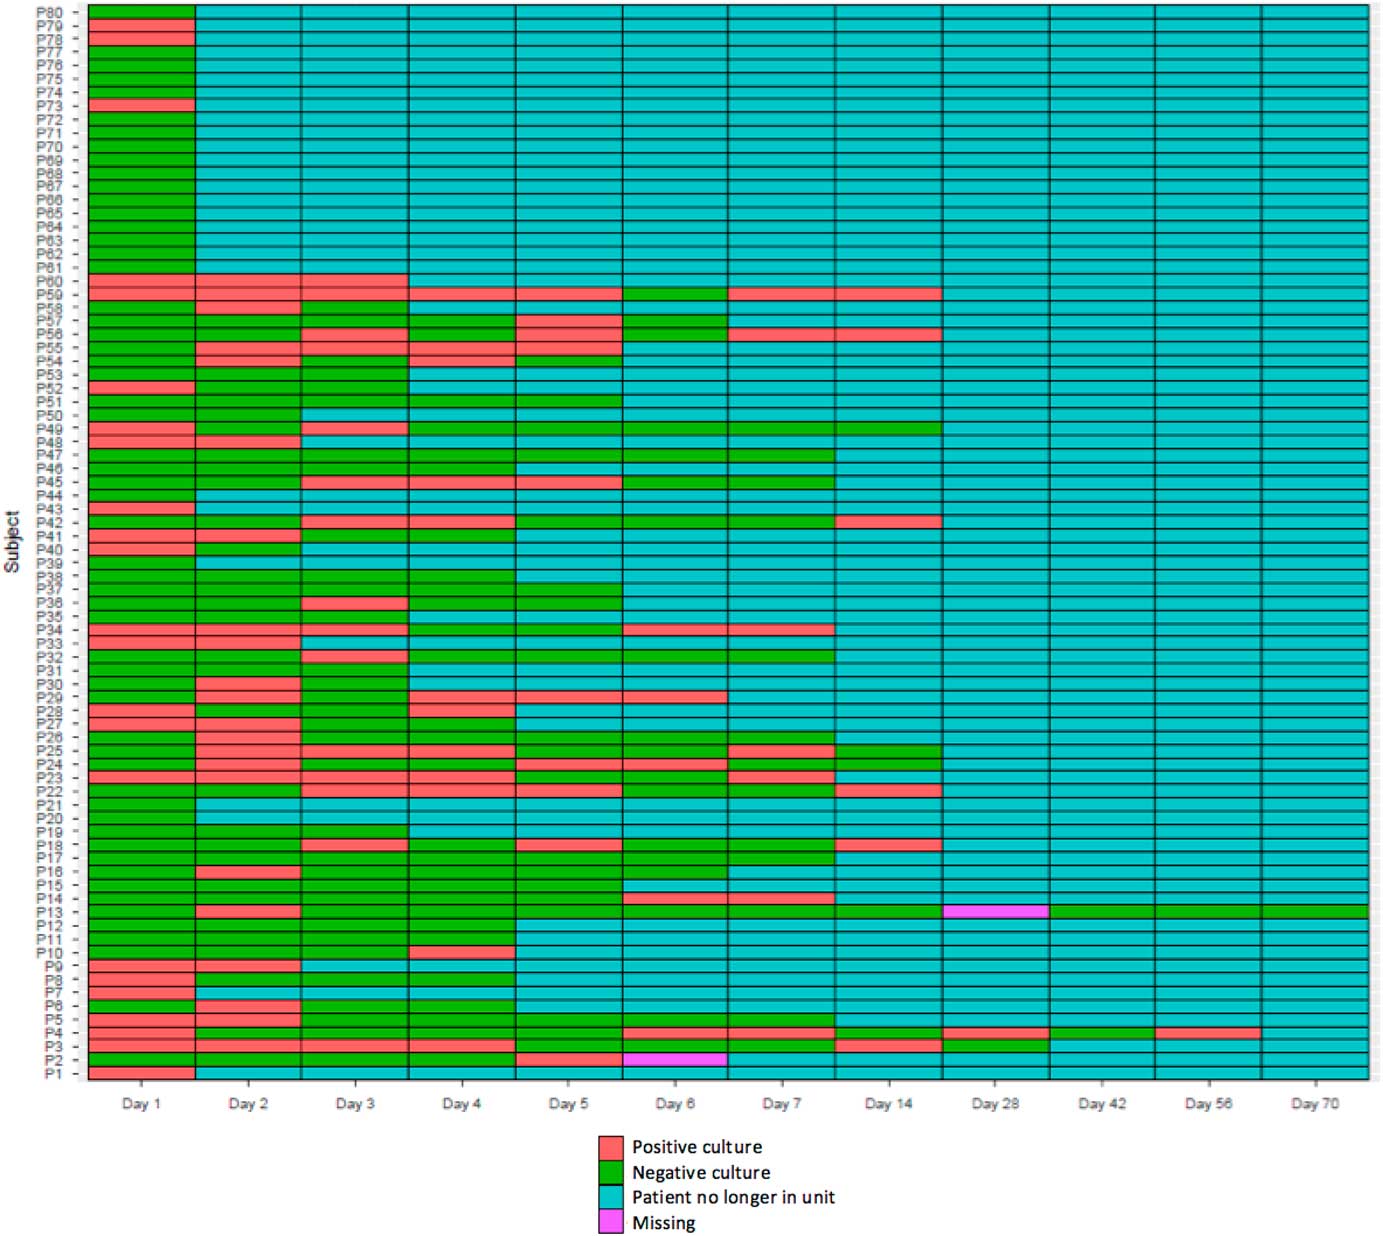
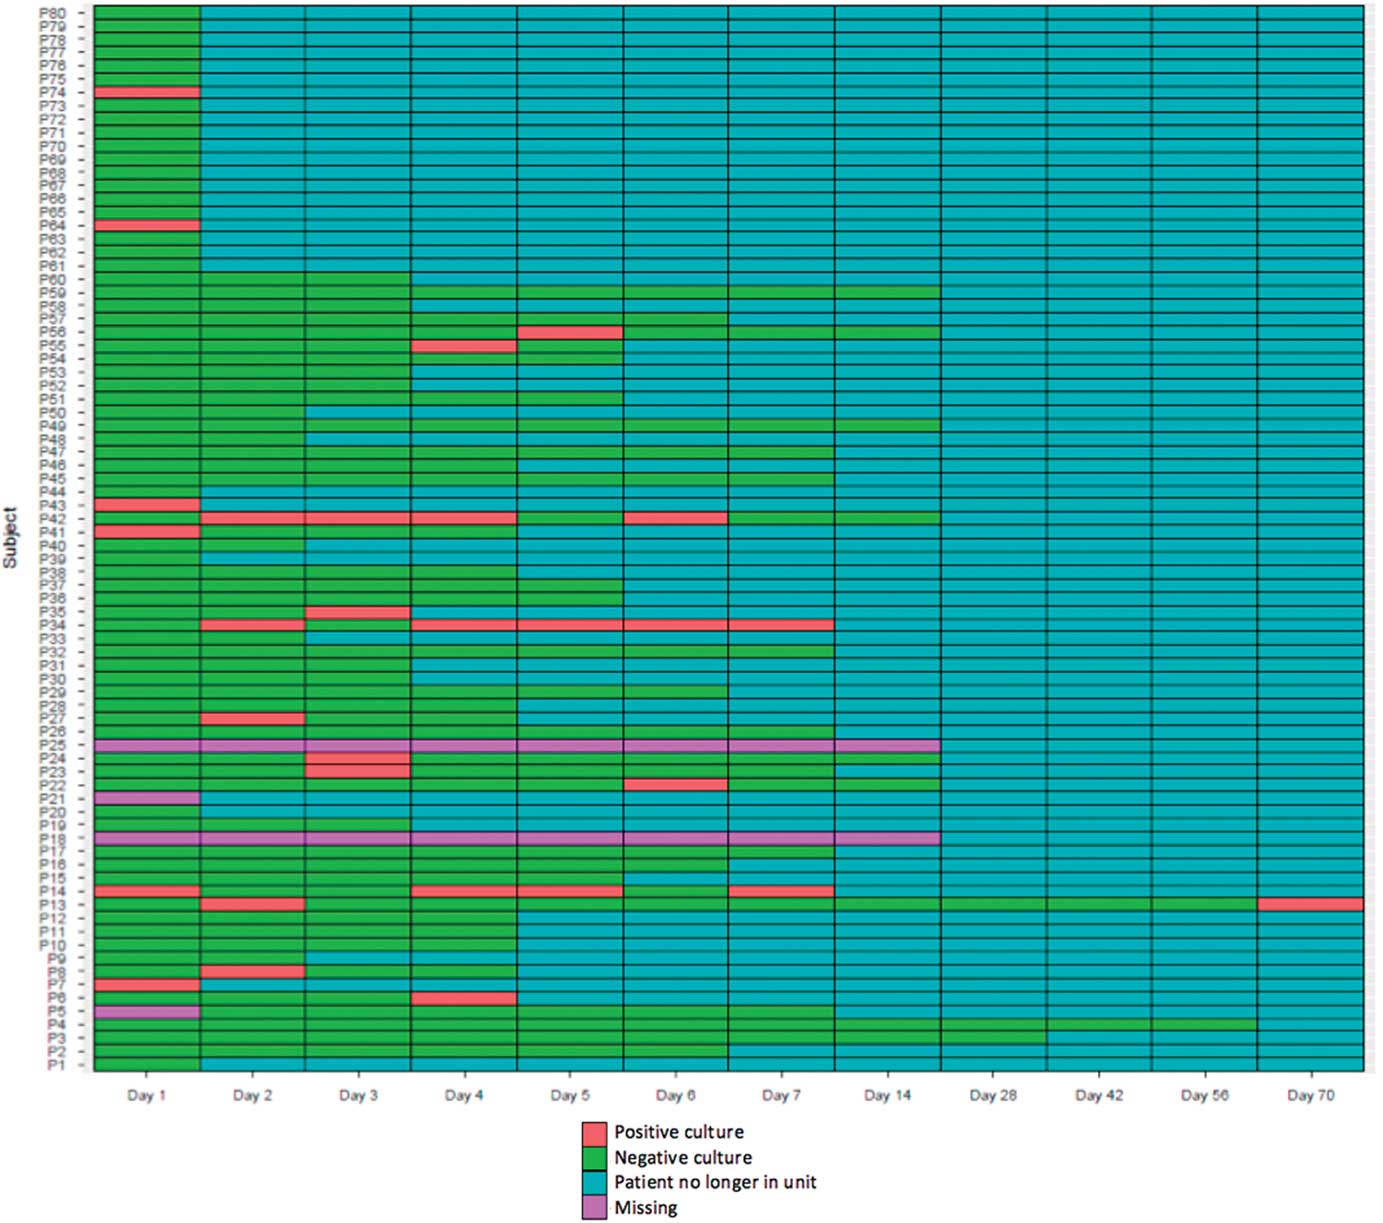
The frequency of days of environmental sampling was, on average, 4.7 days (range, 1–14 days; Figures 1 and 2). The highest Spearman correlation coefficient among days 1–7 for bed rails, the most contaminated site, was 0.43. For a binary outcome, if any of the sites were positive compared to no sites being positive, the highest correlation among days 1–7 was 0.68. The sensitivity of sampling only on day 1, compared to sampling on both day 1 and day 2, was 65% (Table 2).
Lasagna plot of bed rails, the most frequently contaminated site. For example, the bed rails of patient 41 had positive cultures on days 1 and 2 and negative cultures on days 3 and 4, but on days 5–14 the patient was no longer in the unit.
Lasagna plot of the bathroom, the least frequently contaminated site. For example, bathroom of patient 41 had a positive culture on day 1 and negative cultures on days 2, 3, and 4, but on days 5–14 the patient was no longer in the unit.
DISCUSSION
We found that environmental contamination in a patient room with A. baumannii is common. Consistent with prior studies, the sites in closest proximity to the patient (eg, zone 1) were most likely to be contaminated, with nearly 5 times the odds when compared to surfaces farther from the patient.Reference Lin and Hayden 6 We also found that sampling only the sites in closest proximity to the patient (zone 1) missed contamination 48% of the time. Similarly, sampling only the most contaminated sites versus at all sites misses 57% of environmental contamination, and sampling only on day 1 versus on multiple days misses 35%. This finding suggests that limiting sampling in a location or at a frequency may create a gap in which key environmental contamination data may be missed. To fully capture the extent of environmental contamination in the hospital setting, there may be value in repeated sampling across multiple sites and days.
With a goal of resource conservation, it would be ideal to condense the total number of samples needed; however, these findings suggest that the resource cost needs to be weighed carefully with the poor sensitivity of only sampling a few sites. Another potential option is to utilize a single swab to sample multiple sites when the outcome of interest is any environmental contamination and specific site of contamination is not needed. However, this strategy needs to be tested before it is endorsed.Reference Moore and Griffith 9
We found a wide range of contamination across environmental sites over multiple days. Due to the nature of our study, we were unable to determine whether this represents new or persistent environmental contamination. However, we find these results intriguing and in line with what is known about A. baumannii, which is frequently found to contaminate the environment, and such contamination may persist for a long period.Reference Bergogne-Berezin and Towner 10 While it may be tempting to conserve resources by limiting sampling days, we found that 35% of environmental contamination may be missed by sampling only 1 day compared to 2 days.
This study was conducted at a single hospital, which limits the generalizability of findings to other similar academic hospitals. Furthermore, we did not capture data related to compliance with environmental cleaning policies and procedures and cannot make inferences regarding how variations in practice may affect results.
In conclusion, we demonstrate the importance of sampling multiple environmental sites in patient rooms and multiple days in succession to maximize information on environmental contamination. These results have potential implications for future hospital epidemiology and specifically environmental cleaning intervention studies.
ACKNOWLEDGMENTS
The authors would like to thank Mallory Boutin and Lisa Pineles for their assistance with sample collection and Gwen Robinson and Stephanie Hitchcock for their assistance with laboratory processing.
Financial support: This research and K.A.T. were supported by National Institutes of Health (NIH) (Career Development grant no. 1K23AI08250-01A1). Additionally, A.D.H. was supported by National Institutes of Health (NIH) (Career Development grant no. 5K24AI079040).
Potential conflicts of interest: All authors report no conflicts of interest relevant to this article.