
Introduction
Transmission electron microscopy (TEM), combining high spatial and spectral resolution is always considered as a powerful and indispensable tool for structure characterization and chemical analysis.[ Reference Knoll and Ruska 1 – Reference Williams and Carter 6 ] Over the past decades, the applications of TEM have expanded from static characterizations to in situ observations and live measurements, providing great opportunities in various fields from materials science to chemistry and biology. With the adoption of the aberration corrector[ Reference Haider, Uhlemann, Schwan, Kabius and Urban 7 – Reference Urban 10 ] and micro-electro-mechanical system (MEMS) devices[ Reference Haque and Saif 11 – Reference Wu and Yao 18 ], it is now possible to image the real-time dynamic change at atomic scale under various external stimuli, such as applied heat, stress, bias, and gaseous or liquid environments, while simultaneously measuring relevant properties.[ Reference Boston, Schnepp, Nemoto, Sakka and Hall 19 – Reference Wang, Chen, Cao, Deng, Cao and Wang 29 ] Among them, the in situ TEM study under atmospheric pressures is a fast-growing and fascinating area, attracting attention not only from basic scientific research but also for important industrial applications.
By utilizing the advanced windowed gas cell technique, the atmospheric gas phase reactants are allowed to flow over the samples (at elevated temperatures) in a miniaturized space at the tip of the TEM holder, and the morphology and structure evolution can be directly revealed through S/TEM imaging, electron diffraction, and spectroscopy. The ability to study gas–solid reactions in TEM, especially with atomic resolution at ambient pressures provides essential insight into a wide range of fundamental and applied research, e.g., oxidation dynamics, gas phase synthesis, catalysis, energy conversion, to name just a few. For example, the structure–reactivity correlation of the catalyst can be understood by monitoring the structure and morphology change corresponding to the real gaseous reaction environments; the observation of the growth kinetics during gas phase synthesis provides wide opportunities for optimizing the growing conditions. Detailed information with high spatial resolution, obtained by in situ TEM are therefore an essential complement to other in situ techniques, which offer averaged information over larger length scales (e.g., x-ray photoelectron spectroscopy, x-ray absorption fine structure spectroscopy, et al.).
Here, we review and summarize the current state of development of in situ TEM study under atmospheric pressures. After a brief introduction of the advanced windowed gas cell technique, we will provide application examples of this instrumentation that exploit atomic-resolution TEM study involving gas–solid interactions and give an outlook into the potential progress and prospects in this field that will stimulate further scientific research in this topic.
Instrumentation
Generally, conventional transmission electron microscopes are not compatible with gaseous environments, since a high-vacuum condition (7.5 × 10⁻⁸ Torr) has to be maintained within the column for protecting the electron emission gun and avoiding the electron scattering by gas molecules.[ Reference Mehraeen, McKeown, Deshmukh, Evans, Abellan, Xu, Reed, Taheri, Fischione and Browning 30 ] So, it is imperative to introduce additional instrumentation for in situ TEM study at atmospheric pressures.
In principle, a critical technical requirement for the in situ gas system compatible with TEM is to separate the high-pressure atmosphere around the sample from the high-vacuum condition in the rest of the microscope. The initial idea to control the gas pressure inside the electron microscope was firstly proposed by Marton in 1935.[ Reference Marton 31 ] This approach involved a modification of the objective pole pieces of the electron microscope, by placing a pair of small apertures above and below the specimen in order to limit the gas leakage to the column.[ Reference Marton 31 , Reference Ruska 32 ] Over time, this design has gradually evolved alongside the TEM, becoming the modern differentially pumped environmental TEM (ETEM). Figure 1(a) shows a schematic of the design of a differentially pumped ETEM, incorporating a series of differential pumping apertures and additional pumping capacity, which create zones of decreasing pressure between the high-pressure zone and the high vacuum of the other parts of the TEM column. This architecture allows the volume around the sample, delimited by the objective lens, to be filled with gases, which are introduced by an external gas manifold and flow controller system.
Schematic representation of the instrumentation for in situ environmental TEM. (a) Differentially pumped environmental TEM. (b) TEM holder with windowed gas cell. (c) Cross-section drawing illustrating the structure of the windowed gas cell. Adapted with permission from Ref. Reference Casu, Sogne, Genovese, Di Benedetto, Mozo, Zuddas, Pagliari and Falqui33. © 2016 A. Casu, et al. Published in Ref. Reference Casu, Sogne, Genovese, Di Benedetto, Mozo, Zuddas, Pagliari and Falqui33 under CC BY 3.0 license. Available from: http://dx.doi.org/10.5772/63269.

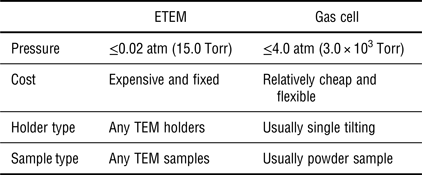
The main advantage of the differentially pumped ETEM is that no physical objects interfere with the electron beam (except the gas molecules) during imaging. This open system allows light-element materials, even graphene, to be observed with high resolution and good contrast under the gas pressure.[ Reference Hansen and Wagner 34 ] Meanwhile, no further modification is necessary with regard to the holders, and any type of TEM holders (e.g., double-tilting holder, heating holder) can be used to perform in situ gas phase experiments. However, it is worth noting some constraints of the differentially pumped ETEM at the current stage. Besides the expensive cost, the main limitation is that the gas pressure allowed in ETEM is no more than 15.0 Torr (0.02 atm),[ Reference Sharma 35 – Reference Jinschek 37 ] about two orders of magnitude lower than the atmospheric pressure at which many real gas phase reactions take place. This “pressure gap” is not favorable for building a bridge between the in situ results and real applications, particularly for catalysis research. In addition, another disadvantage of ETEM is the constraint on the capability of STEM imaging, which is becoming popular for analytical electron microscopy research. Since the post-specimen differential pumping apertures block the high-angle scattered electrons, annular dark-field STEM (ADF-STEM) imaging can only be limited to the low-angle regime (ADF-STEM scattering angle is usually up to 70 mrad) that is more subject to diffraction contrast, making the images more difficult to interpret, compared with high-angle annular dark field–STEM (HAADF–STEM) imaging.[ Reference Xin, Niu, Alsem and Zheng 38 ] For the same reason, high-angle electron diffraction phenomena cannot be recorded, either.[ Reference Zhang and Kamino 39 ]
To overcome these disadvantages, an alternative idea to attain localized environmental conditions inside the TEM is to modify the specimen holder by placing a pair of electron transparent “windows” above and below the specimen to seal the gas atmosphere from the TEM column, along with a gas inlet and outlet system, as shown in Figs. 1(b) and 1(c). This is known as the concept of a “windowed gas cell,” which was first proposed for in situ TEM observation by Heider in 1962.[ Reference Heide 40 ] By reducing the volume to a small, closed layer around the specimen, the gaseous phases can reach pressures above one atmosphere,[ Reference Allard, Bigelow, Jose-Yacaman, Nackashi, Damiano and Mick 15 – Reference Allard, Overbury, Bigelow, Katz, Nackashi and Damiano 17 ] while the gas cell holder can be safely inserted in conventional TEMs without any modification to the column and vacuum system, which results in a direct saving of costs of purchasing and maintenance. No differential pumping apertures are required in this cell set up, thus making the electrons scattered at high angle available to the detectors and removing some of the limitations of HAADF–STEM imaging encountered in the differentially pumped ETEM.
The heart of the closed gas cell is the “windows,” which serve not only as the imaging panes, but also as the confinement diaphragms. In this regard, electron-transparent amorphous materials, e.g., carbon (C) or silicon nitride (SiN x ), are selected as window materials in the modern set-up of gas cells, due to their elastic properties and high fracture strength[ Reference Tabata and Tsuchiya 41 ] as well as the low electron diffraction contrast.[ Reference Doll, Hochberg, Barsic and Scherer 42 ] First, the desired mechanical properties make the amorphous membrane strong enough to confine the pressurized gas up to atmospheric pressure,[ Reference Yaguchi, Suzuki, Watabe, Nagakubo, Ueda and Kamino 43 – Reference Hansen and Wagner 45 ] which is about two orders of magnitude larger than the maximum pressure allowed in differentially pumped ETEMs. For example, carbon films with thickness <10 nm can withstand pressure differences >2.0 atm.[ Reference Kawasaki, Ueda, Ichihashi and Tanji 46 ] SiN x windows in particular have been demonstrated to sustain the even higher pressure of 4.0 atm within the ultra-high vacuum of the TEM.[ Reference Alan, Yokosawa, Gaspar, Pandraud, Paul, Creemer, Sarro and Zandbergen 47 ] Second, the low electron diffraction contrast of the amorphous membrane will not limit the superposition of additional periodic patterns to the signals coming from the sample. Although additional electron scattering is introduced by the windows, atomic resolution is still able to be achieved either in bright-field (BF) TEM, or in HAADF-STEM imaging mode at pressures above 1.0 atm.[ Reference Allard, Bigelow, Jose-Yacaman, Nackashi, Damiano and Mick 15 – Reference Allard, Overbury, Bigelow, Katz, Nackashi and Damiano 17 , Reference de Jonge, Bigelow and Veith 44 ]
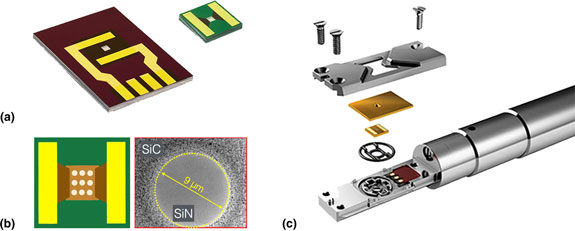
In recent developments, MEMS-based techniques enable the integration of the windows into the silicon (Si) chips, which endows the window parts with heating capabilities. Here, a pair of MEMS-based Si chips used in the Protochips Atmosphere gas cell holder is taken for an example. As shown in Fig. 2(a), the left chip is etched at the center region and supports a thin (≤50 nm) amorphous SiN window over the area. For the right chip, it is also etched at the center, but in particular, the amorphous SiN window is supported over arrays of 9 µm holes patterned in a thin low-conductivity ceramic membrane [see Fig. 2(b)], which serves as a heating unit. Gold electrode contact pads are fabricated on the two chips to allow current to pass from the electrical leads coming through the specimen holder when the cell is assembled [Fig. 2(c)]. Within this kind of design, the heating membrane can achieve heating and cooling rates on the order of 106 °C/s, allowing much more rapid thermal response than standard heating holders.[ Reference Allard, Bigelow, Jose-Yacaman, Nackashi, Damiano and Mick 15 , Reference Allard, Overbury, Bigelow, Katz, Nackashi and Damiano 17 ] This miniaturized MEMS-based heating device allows for a more rapid stabilization of specimen drift to achieve better control of the reaction process and the imaging experiments. It has been demonstrated that atomic resolution can be realized even under 1000 °C while at pressures up to 1.0 atm in an aberration-corrected STEM/TEM instrument.[ Reference Allard, Overbury, Bigelow, Katz, Nackashi and Damiano 17 ]
Design of the windowed gas cell holder for in situ TEM study. (a) MEMS-type Si chips used in the Protochips Atmosphere gas cell holder. (b) A schematic of the top view of the heating chip and a bright-field image showing a hole in the SiC ceramic, covered with SiN membrane. (c) Schematic showing the assembly of the Protochips Atmosphere gas cell holder.

Table I provides a brief comparison between differentially pumped ETEM and windowed gas cell systems (the resolution information is not provided since it depends on the capability of the microscopes). It is also worth noting that interaction of the electron beam with the gas molecules should actually be lower in the windowed gas cell than in the ETEM at the maximum gas pressures due to the much shorter path length in the cell.[ Reference Xin, Niu, Alsem and Zheng 38 ] To summarize, the windowed gas cell approach has various advantages over the differentially pumped ETEM, including a higher allowable gas pressure, a much thinner gas path length, better control of reaction process, and a much lower cost, etc. These advantages will be demonstrated in the application examples, which are presented in the next section.
Comparison between differentially pumped ETEM and windowed gas cell.

Applications
In this section, a few case studies will be presented to show the application of windowed gas cells in a variety of research topics involving gas–solid interactions, including oxidation and reduction processes, dynamic growth of nanomaterials, catalytic reactions, and “operando” TEM studies. These examples will highlight the potential of in situ TEM study under atmospheric pressures, and how the dynamic structure information is obtained to improve our understanding of nanomaterials’ structure–property relationships. Although all of these examples involve powder samples, it is also possible to study oriented samples, like two-dimensional materials in windowed gas cells.[ Reference Ghassemi, Harlow, Mashtalir, Beidaghi, Lukatskaya, Gogotsi and Taheri 48 , Reference Shen, Dai, Zhang, Zhang, Sharkey, Graham, Pan and Peng 49 ]
Oxidation and reduction processes
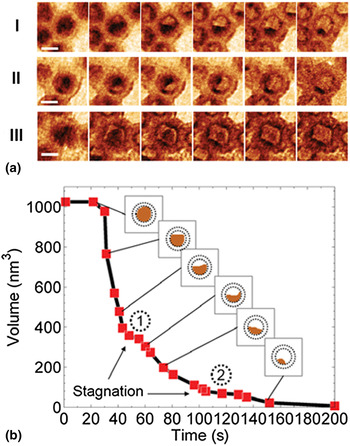
One of the applications of in situ TEM under atmospheric pressure is the study of oxidation and reduction processes, making use of the heating element and the introduced gas. During the development of windowed gas cell technique, a variety of in situ redox experiments were performed. For example, Xin et al. carried out the real-time observation of the oxidation of cobalt (Co) nanoparticles at atmospheric pressure inside a windowed gas cell.[ Reference Xin, Niu, Alsem and Zheng 38 ] The oxidation reactions were performed with a flowing oxygen (0.2 sccm) while ramping temperature from 150 to 250 °C and 250 to 350 °C at the speed of about 5 °C/s. Figure 3(a) shows the time-lapsed images of three selected Co nanoparticles, visualizing the shrinkage of the metallic Co core with an unidirectional retraction front [Fig. 3(a) I], and sweeping retraction front [Fig. 3(a) II]. In the projection image of Fig. 3(a) III, the residual metallic particle was faceted, which was likely shaped by the faceted hollow shell. The quantification of the volume trajectory of the metallic core [Fig. 3(b)] shows that the metallic core volume started to rapidly decrease when temperature reached 250 °C. After the first volume-decreasing phase, volume shrinkage dwelled for a short period of time at the first plateau [① in Fig. 3(b)]. Then a second rapid decreasing phase initiated with a lower volume shrinkage rate. After a second shrinkage stagnation plateau [② in Fig. 3(b)], the metallic core was finally eliminated, but at an even slower volume shrinking rate. This shrinkage stagnation phenomenon in the Kirkendall effect is likely related to the particle's anisotropic boundary conditions. As shown in Fig. 3(a) I, the particle's oxide shell is in contact with other particles with upper and lower right boundaries open.
In situ oxidation of cobalt nanoparticles. (a) Real-time dynamics of the oxidation process. Scale bar, 10 nm. (b) Metallic core volume trajectory of particle I in (a). ① and ② mark two diffusion stagnation plateaus. Reproduced with permission from Ref. Reference Xin, Niu, Alsem and Zheng38. Cambridge University Press, 2013.

By utilizing a Hummingbird gas cell holder, Wu et al. visualized the oxidation dynamics of single Ag/AgCl nanoparticles at atmospheric air pressure.[
Reference Wu, Li, Li, Kinaci, Chan, Sun, Guest, McNulty, Rajh and Liu
50
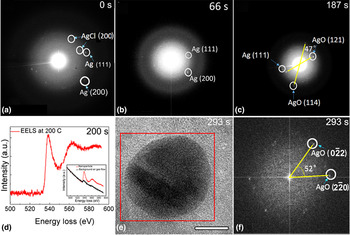
] The Ag/AgCl heterostructures were heated to 200 °C under a constant air flow rate, and the structural dynamics were recorded through the selected-area electron diffraction (SAED) patterns during the oxidation reaction, as shown in Fig. 4. The signal of SAED is weak due to the electron scattering from the membrane. At the initial state (0 s), Ag (111), Ag (200), and AgCl (200) planes were observed in Fig. 4(a). After 66 s, SAED was taken on the same particle and only Ag (111) and (200) planes were observed at this time, indicating the Ag/AgCl heterostructure was reduced to Ag by the reducing effect from the electron beam. At 187s, based on SAED in Fig. 4(c), AgO was found to form by indexing the diffraction spots as AgO (121) and (114) with an angle of 47° in respect to each other. Besides, the Ag (111) was also seen in Fig. 4(c), demonstrating partial oxidation at 187 s. Electron energy-loss spectroscopy (EELS) was taken on this nanoparticle at 200 °C at 200 s. In Fig. 4(d), a clear oxygen K edge (red lines), which shows a much higher intensity than the normalized oxygen K edge from the background air gas (black lines in the inset), indicates oxide formation on the nanoparticle before 200 s. At the time of 293s in Figs. 4(e) and 4(f), the expected AgO lattice plane
 $(0\bar 22)$
and
 $(\bar 220)$
with single crystallinity and 52° angle with respect to one another appeared. This in situ observation revealed a two-step process of the oxidation of Ag/AgCl heterostructure: Ag/AgCl was first reduced to Ag, and then Ag nanoparticle reacted with O2 molecules to form AgO at atmospheric pressure.
In situ oxidation of Ag/AgCl heterostructure with air at atmospheric pressure. (a–c) SAED on a single particle after 0, 66, and 187 s reaction time with constant air flow, respectively. (d) EELS spectrum during the reaction. The red line was taken at 200 °C after 200 s of reaction time with constant air flow. The inset EELS spectrum shows the existence of oxygen in the nanoparticle as compared with the background signal from the constant air flow. (e) Image of the same particle after 293 s of reaction time with constant air flow. Scale bar, 10 nm. (f) FFT of the red region in (e). Reproduced with permission from Ref. Reference Wu, Li, Li, Kinaci, Chan, Sun, Guest, McNulty, Rajh and Liu50. American Chemical Society, 2016.

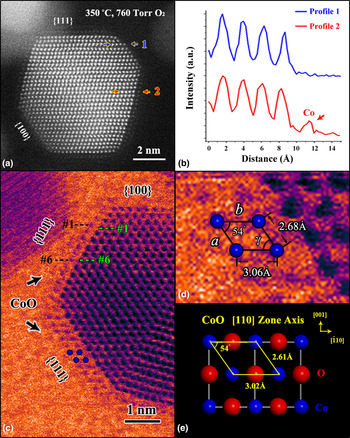
Besides the redox of pure metal, the oxidation or reduction of bimetallic systems also attracts the research attention recently, e.g., the surface segregation in platinum–metal (Pt–M) nanoparticles. By using a Protochips windowed gas cell, Dai et al. investigated the oxidation process of shaped Pt3Co nanoparticles and revealed a facet-dependent oxidation behavior of Pt3Co surfaces.[ Reference Dai, Hou, Onoue, Zhang, Gao, Yan, Graham, Wu and Pan 51 ] The original disordered Pt3Co nanoparticles were heated from room temperature to 350 °C in one atmosphere (760 Torr) of pure oxygen. Figure 5(a) shows an in situ HAADF–STEM image of a Pt3Co nanoparticle annealed in oxygen at 350 °C for only 60 s. It is clear that an additional atomic layer with a lower contrast has formed on the {111} surfaces but not on the {100} surfaces. To be quantitative, intensity profiles were taken along the lines marked by the blue and red arrows, respectively, corresponding to different {111} planes across the outermost {100} and {111} surfaces. Between the two intensity profiles in Fig. 5(b), an obvious difference is the presence of an extra peak with a low Z contrast in profile 2. Since HAADF–STEM images reflect the atomic number Z of elements,[ Reference Williams and Carter 6 ] the newly formed layer with lower contrast is tentatively determined to have a Co-rich composition.
In situ observation of Pt3Co nanoparticles in an oxidizing environment. (a) HAADF–STEM image revealing the formation of a Co-rich layer only on {111} surface of a Pt3Co nanoparticle. (b) Intensity profiles taken along the lines are indicated by the blue (profile 1) and red (profile 2) arrows in (a), respectively. The intensity of the Co column is indicated by the arrow in profile 2. (c, d) False colored BF-STEM images illustrating the periodical unit cell of the oxide layer on {111} Pt3Co surface. (e) Projection of a CoO model along the <110> zone axis. Blue and red spheres represent Co and O atoms, respectively. Reproduced with permission from Ref. Reference Dai, Hou, Onoue, Zhang, Gao, Yan, Graham, Wu and Pan51. American Chemical Society. 2017.

Fig. 5(c) shows another twinned Pt3Co nanoparticle after oxygen annealing for more than 10 min. Here, the BF STEM image with a false color is presented to better visualize the lighter metal atoms (Co). Similar to the result in Fig. 5(a), low-contrast layers are found only on the {111} surfaces. By comparing the marked green and black distance in Fig. 5(c), it is obvious that the segregated layers have a larger lattice spacing than the inner part, consistent with oxygen incorporation into the Co lattice. Quantitative indexing is presented in the enlarged panel Fig. 5(d), showing that the dimensions of two sides of the parallelogram are a = 2.68 Å and b = 3.06 Å, with an intersection angle γ = 54.0°. These parameters are in excellent agreement with those of the Co sublattice unit cell [see Fig. 5(e)] in the structure of CoO (along the <110> zone axis); small deviations may arise from the lattice mismatch between CoO (4.27 Å) and Pt3Co (3.86 Å).
Dynamic growth of nanomaterials
Gas phase synthesis is one of the most commonly used methods for the fabrication and structure control of nanomaterials.[ Reference Granqvist, Kish and Marlow 52 – Reference Rao, Müller and Cheetham 54 ] Now windowed gas cells enable us to characterize nanostructures during their formation process under gas pressures, and to relate the structure and morphology to the synthesis conditions.
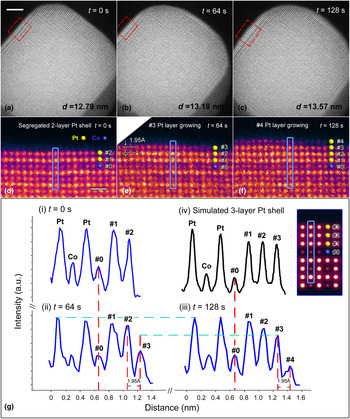
Real-time observation of the growing dynamics leads to new insights into the growth mechanism, which is invaluable in the optimization of the nanomaterials fabrication. One good example is the in situ oxygen-driven core-shell formation in platinum–cobalt (Pt–Co) nanoparticles, which is promising in surface engineering and atomic design of oxygen reduction reaction catalyst in fuel cell applications. Dai et al. carried out the in situ high-temperature annealing experiment on the disordered Pt3Co nanoparticles in an atmospheric oxygen environment.[ Reference Dai, You, Zhang, Cai, Xu, Xie, Wu, Graham and Pan 55 ] The temperature was first elevated to 720 °C, which is close to the phase transition temperature of Pt–Co alloy, at a high rate of 5 °C/s. Upon oxygen annealing at 720 °C for 30 min, the initial disordered Pt3Co nanoparticles were transformed to ordered intermetallic L12 phase combining with the Pt surface segregation to form a two-layer Pt-rich shell. Then, the temperature was rapidly cooled to 300 °C, and the surface configuration of the Pt3Co nanoparticle was stable as shown in Figs. 6(a) and 6(d). Sequential high-resolution HAADF images were then taken at a scanning speed at one frame every 16 s at 300 °C. As shown in Fig. 6(b), the Pt3Co nanoparticle was found to be larger at an elapsed time of 64 s with the measured diameter, d 64s, was 13.18 nm, showing an increase of Δd = 3.90 Å, compared to the status in Fig. 6(a). In the corresponding enlarged panel [Fig. 6(e)], it is evident that an extra atomic layer (layer #3) has grown on the (100) surface. The lattice spacing between layer #2 and layer #3 is found to be 1.95 Å, which is exactly half of Δd. This indicates another extra atomic layer has also started growing on the opposite (100) facet at the lower right corner of Fig. 6(b). Similarly, by comparing Figs. 6(a) and 6(b), an extra layer can also be identified on the other two (100) surfaces (the one at the top right and the one at lower left). Furthermore, at an elapsed time of 128 s [Fig. 6(c)], the measured diameter, d 128s = 13.57 nm, shows a further increase of 3.90 Å, demonstrating that the particle continued to undergo layer-by-layer growth at (100) surfaces. The high-resolution image [Fig. 6(f)] also illustrates the newly grown layer #4.
In situ layer-by-layer growth of the (100) Pt shell during oxygen annealing. (a–c) Sequential HAADF images taken at 0 s, 64 s and 128 s during oxygen annealing at 300 °C, respectively. Scale bar, 2 nm. (d–f) Corresponding enlarged false-color panels of the (100) surface (indicated by red boxes) in (a–c), respectively. Yellow and blue spheres represent Pt and Co atoms, respectively. Scale bar, 5 Å. (g) Intensity profiles taken along the blue lines in (d–f), and the simulation result, respectively. The inset shows the simulated image of the three-layer Pt shell on the (100) surface. Reproduced with permission from Ref. Reference Dai, You, Zhang, Cai, Xu, Xie, Wu, Graham and Pan55. Nature Publishing Group, 2017.

To determine the composition of the newly grown layers, intensity profiles are obtained from the same (020) plane [indicated by blue boxes in Figs. 6(d)–(f)] at t = 0, 64 and 128 s, respectively. As shown in Fig. 6(g), the new layers #3 and #4 can be quantitatively represented in the sequential intensity profiles. By comparing profiles (ii) and (iii), it can be found that the intensity of layer #3 is increasing during the interval of 64–128 s. When layer #3 is considered as completely grown at 128 s since the new layer #4 started growing, it is obvious that the columns in layer #3 exhibit a similar intensity to that of the segregated Pt layers #1 and #2, which is higher than that of the inner Co columns. For confirmation, an image simulation was performed based on a segregated intermetallic Pt3Co model with a three-layer pure Pt shell. According to the simulation results, the intensity profile of the three-layer Pt shell shows the same trend as the corresponding layers #1–#3 in the experimental profile (iii), demonstrating the newly grown layer we observed is, indeed, a Pt-rich shell.
Another example of the dynamic growth of nanomaterials is the in situ formation of formamidinium lead tri-iodide (FAPbI3) perovskite solar cell thin film under device-relevant synthesis conditions.[ Reference Aguiar, Wozny, Holesinger, Aoki, Patel, Yang, Berry, Al-Jassim, Zhou and Zhu 56 ] Aguiar et al. observed the perovskite formation from precursors (FAI/PbI2) and subsequent degradation related to grain evolution and interface chemistry inside a windowed gas cell from 50 to 225 °C, at nominal atmospheric pressure with purified argon gas flowing at 0.1 sccm. Upon increasing the temperature to 135 °C, a slight redistribution of lead (Pb) was observed in the HAADF–STEM imaging, which corresponds to the precursors reacting to crystallize into the FAPbI3 perovskite phase. The Pb composition was observed to fluctuate at grain boundaries, indicating a mobile lead-containing species, a process found to be partially reversible at a key temperature of 175 °C. At temperatures above 175 °C, nucleation and growth of lead-rich precipitates occur. These precipitates can only be partially reincorporated into the material following longer annealing at 175 °C. The observed dynamics from the in situ TEM experiments were used to develop optimized device processing procedures based on synthesis around 175 °C. Within the stability period of the devices, devices with efficiencies up to 17.09% were obtained with this improved process.
Structure evolution of catalysts under reaction conditions
Due to the allowable atmospheric pressures, windowed gas cells are mainly utilized for in situ study on catalysis. In this regard, the probing of dynamic catalytic processes under real reaction conditions is invaluable since such information is difficult to access through characterization in vacuum conditions (or low gas pressures in differentially pumped ETEMs). Structural information at the atomic level obtained under reaction conditions is critical to build a direct correlation between catalyst structure and catalytic performance.
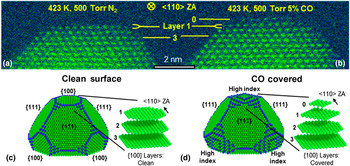
For example, it is well known that exposed surface structures of supported metal catalysts can reconstruct under reaction conditions due to the reactant (gas molecules) adsorption and surface reaction. Detailed description of such dynamic surface evolution is important for understanding the catalysis mechanisms during gas–solid interactions, but direct visualizations are rare. One representative example is an in situ investigation of CO-induced Pt nanoparticle surface reconstruction at saturation coverage. Avanesian et al. utilized a Protochips Atmosphere gas cell to observe the adsorbate-mediated catalytic metal surface reconstruction predicted by density functional theory (DFT) calculations.[ Reference Avanesian, Dai, Kale, Graham, Pan and Christopher 57 ] Fig. 7(a) shows an in situ HAADF–STEM image of an original Pt nanoparticle at 423 K in 500 Torr of N2 with atomically smooth {100} and {111} surfaces, viewed along the <110> zone axis. The flat {100} and {111} surfaces were stable under N2 atmosphere at 423 K, with no morphologic changes identified from images during an elapsed time of 30 min. Then, N2 gas was pumped out of the cell, and 500 Torr of a 5 vol% CO (balanced with 95% Ar) environment was introduced to flow over the Pt nanoparticle, while the temperature was maintained at 423 K. It is notable that the partial pressure of CO reached 25.0 Torr in the in situ TEM experiment, ensuring the saturation CO coverage on the Pt nanoparticle surfaces (~10.0 Torr).[ Reference Bourane and Bianchi 58 ]
Visual comparison of in situ STEM measurements of facet-specific CO-induced Pt nanoparticle surface reconstruction. Aberration-corrected STEM images of a Pt nanoparticle taken along the <110> zone axis: (a) at 423 K in 500 Torr of N2, and (b) at 423 K in 500 Torr of 5% CO in Ar (25 Torr of CO). Wulff constructions of a Pt nanoparticle based on DFT calculated surface free energies for (c) clean surfaces and (d) CO-saturated surfaces DFT-calculation result. Adapted with permission from Ref. Reference Avanesian, Dai, Kale, Graham, Pan and Christopher57. American Chemical Society, 2017.

Then, Fig. 7(b) presents the result of the Pt nanoparticle after exposure to the CO environment for 10 min. For a clear comparison of structural differences induced by CO exposure, layers 1 and 3 were marked as a reference in Figs. 7(a) and 7(b). Obviously, upon CO adsorption, a new atomic plane of Pt atoms (marked as layer 0) formed on top of the original {100} surface, while the {111} facets remained unchanged, which is in good agreement with DFT calculations suggesting that layer 0 was formed from the migration of Pt atoms that were near the edges of layer 1 in the adsorbate-free conditions [see Figs. 7(c) and 7(d)]. The loss of Pt atoms in layer 1 was further quantified through the change in integrated intensity of the atomic columns in the in situ HAADF–STEM images. The data from the experimental image shows quantitative agreement with the theoretical value obtained in the STEM image simulation based on DFT calculations.
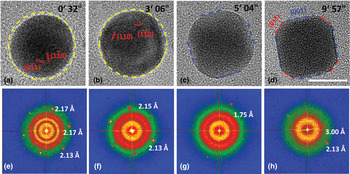
Another example of the surface reconstruction at atmospheric pressures is reported by Jiang et al., using a DENSsolutions gas cell TEM holder to observe a surface faceting of PdCu nanoparticles, a catalyst for hydrogen-based industries, under an atmospheric hydrogen pressure (760 Torr) at 600 K.[ Reference Jiang, Li, Wu, Ye, Zhang, Wang, Sun and Zhang 59 ] Fig. 8(a) displays a TEM image of a single spherical PdCu nanoparticle projected along the [111] axis; six {110} diffraction spots can be observed in the corresponding fast Fourier transform (FFT) pattern [Fig. 8(e)]. When annealed at 600 K under a hydrogen atmosphere, the spherical PdCu nanoparticle started to rotate and showed smaller curvature surfaces, as indicated by the blue dashed line in Fig. 8(b). Subsequently, accompanied by roll-over and rotation, the nanoparticle exhibited four flat surfaces and finally became a truncated cube with distinct {001} and {011} facets [see Fig. 8(d)]. Jiang et al. also performed the comparison experiments and demonstrated that the PdCu nanoparticles prefer to retain the as-synthesized spherical morphology either in vacuum condition or low hydrogen pressure (about 12.0 Torr). The surface reconstruction phenomena only took place under atmospheric hydrogen pressure since a new order of the surface energies can only be trigged while the surface was heavily hydrogenated.
In situ observation of the surface reconstruction of PdCu nanoparticles when exposed to 760 Torr of H2 at 600 K. (a–d) Lattice-resolved TEM images and (e–h) the corresponding FFT patterns. Scale bar, 10 nm. Reproduced with permission from Ref. Reference Jiang, Li, Wu, Ye, Zhang, Wang, Sun and Zhang59. WILEY-VCH Verlag GmbH & Co. KGaA, Weinheim, 2016.

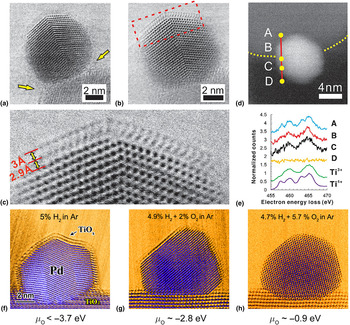
Besides the surface reconstruction of metal catalyst, the interaction between the metal nanoparticles and their supports (usually oxide supports) is also very important for the catalysis research. Regarding this kind of research, the in situ STEM imaging is a powerful tool to easily differentiate the metal nanoparticles and the supports, so that the windowed gas cell approach is more favorable.[ Reference Onn, Zhang, Arroyo-Ramirez, Chung, Graham, Pan and Gorte 60 – Reference Zhang, Plessow, Willis, Dai, Xu, Graham, Cargnello, Abild-Pedersen and Pan 64 ] For example, Zhang et al. captured a dynamic process of a strong metal-support interaction (SMSI) in a high-surface area Pd/TiO2 catalyst, by employing in situ ambient pressure STEM study in a Protochips Atmosphere gas cell.[ Reference Zhang, Plessow, Willis, Dai, Xu, Graham, Cargnello, Abild-Pedersen and Pan 64 ] Under a reducing atmosphere (760 Torr of 5 vol% H2/Ar) at 250 °C shown in Fig. 9(a), an amorphous layer started to form on the particles, arguably through diffusion of reduced TiO x species from the support to the particle surface, starting from the metal-support boundary [see arrows in Fig. 9(a)]. When the temperature was increased to 500 °C under the same conditions, the amorphous layer crystallizes to form a bilayer that is almost epitaxial with the Pd (111) plane [see Fig. 9(b)]. In a higher magnification image of Fig. 9(c), the lattice spacing was measured to be 2.9 Å for the lower layer and 3.0 Å for the top layer, and the overlayer followed ABCABC stacking of the underneath Pd along [111] direction. The EELS scan shown in Figs. 9(d) and 9(e), taken in situ under 5% H2/Ar at 500 °C, along the line ABCD, confirmed that this surface layer is TiO x . From the TiO2 support (measuring point A) to the Pd nanoparticle (measuring points B and C), the fine structure of Ti shows features typical of the transition from 4+ to 3+, based on reference spectra from TiO2 and LaTiO3.
In situ STEM images showing a dynamic process of SMSI in Pd/TiO2 catalyst. (a) Amorphous layer formed on Pd/TiO2 sample at 250 °C under a reducing atmosphere (760 Torr of 5 vol% H2/Ar). (b) Crystalline layer formed at 500 °C for 10 min under same reducing conditions. (c) A higher magnification angular bright field-STEM (ADF-STEM) image of a section of (b) showing the TiO2 double layers. (d, e) EELS spectra extracted from a line scan of another particle, shown in (d), under 760 Torr of 5 vol% H2/Ar at 500 °C, and Ti3+ and Ti4+ reference spectra acquired from LaTiO3 and TiO2. (f–h) Number of surface layer change with respect to oxygen partial potential. Adapted with permission from Ref. Reference Zhang, Plessow, Willis, Dai, Xu, Graham, Cargnello, Abild-Pedersen and Pan64. American Chemical Society, 2016.

With reference to properties of the SMSI,[ Reference Tauster, Fung and Garten 65 ] the amorphous layer corresponds to the state produced by low-temperature reduction (LTR), whereas the crystalline layer corresponds to the state produced by high-temperature reduction (HTR): the overlayer formed by LTR is gas permeable, but the overlayer formed by HTR is very effective in blocking access of gas molecules to the underlying metal surface. Interestingly, the thickness of the reduced oxide layers, depending on the reactive gas atmosphere, can be adjusted by controlling H2 and O2 partial pressures in a closed gas cell, as shown in Figs. 9(f)–9(h). At the temperature of 500 °C, double layers, single layers, and no layer of the TiO x /Pd structure were induced under various gaseous environments as 5 vol% H2, 4.9 vol% H2 + 2 vol% O2, and 4.7 vol% H2 + 5.7 vol% O2 (balanced with Ar at 760 Torr), respectively, which are related to the variable chemical potential of oxygen (μ O).
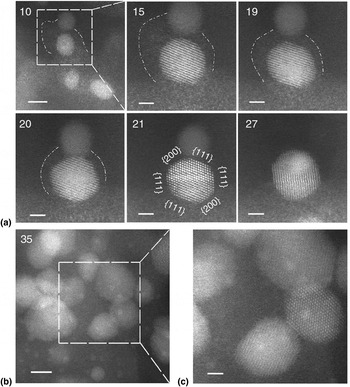
By using the in situ STEM capability, Zhang et al. also revealed an unexpected structural evolution of Si-supported Pd@CeO 2 nanocatalysts.[ Reference Zhang, Chen, Cargnello, Fornasiero, Gorte, Graham and Pan 66 ] Initially, the activity for methane oxidation of Pd@CeO 2 was attributed to the formation of the modular core-shell structure, but in situ calcination at 500 °C in a 150 Torr of O2 environment revealed the dissociation of the CeO2 nanoparticles into atomic constituents. Subsequent calcination at a higher temperature led to the reorganization of the atomic species into larger CeO2 and Pd nanoparticles or to the formation of a new structure featuring very small, highly dispersed silica, Pd, and ceria (Fig. 10). Assuming a conventional catalytic behavior of the bigger particles, the exceptional catalytical performance of Pd@CeO 2 above 800 °C was attributed to this new structure.
In situ structural evolution following initial dissociation of CeO2 nanoparticles. (a) Sequential images taken at 650 °C in 150 Torr of O2, showing the gradual disappearance of an atom ‘cloud’ accompanied by the growth of a particle in its close vicinity, followed by particle coalescence. The dashed line is used to delineate the periphery of the atom ‘cloud’. The spacing between {111} lattice planes in the larger particle-labeled ‘21’, 3.1 Å, confirms it is CeO2. Elapsed time, in minutes, is indicated on the upper left corner of each image. Scale bars, 5 nm (10), 2 nm (15–27). (b) Appearance of sub-nanometer features in an image taken at a different area. Scale bars, 5 nm. (c) Enlarged image of the dashed line region in (b). Scale bar, 2 nm. Reproduced with permission from Ref. Reference Zhang, Chen, Cargnello, Fornasiero, Gorte, Graham and Pan66. Nature Publishing Group, 2015.

Operando TEM study
The term “operando”, which originates from the field of Raman spectroscopy,[ Reference Bañares and Wachs 67 ] refers to an analytical methodology wherein the microscopic and spectroscopic characterization of materials undergoing reaction is coupled simultaneously with the measurement of catalytic activity and selectivity.[ Reference Bañares 68 ] By connecting suitable spectroscopic tools or residual gas analyzers to the environmental TEM instruments, the information of catalytic products can be quantitatively detected at a larger length scale while observing the evolution of structure and composition simultaneously. Thus, the structure–reactivity correlations are possible to be revealed more directly, even without the ex situ reaction studies.
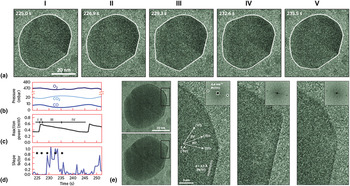
The residual gas analyzer is a direct “operando” approach to probe the gas composition during TEM observation. The windowed gas cell, with its tiny closed reaction volume, makes it more feasible for the quantification and calibration of the mass spectrometry. For instance, Giorgio et al. connected a mass spectrometer to the outlet of a windowed cell holder to confirm CO conversion to CO2 over an Au catalyst in a transmission electron microscope, and correlated the shape of the Au particles with an increase in the CO2 signal.[ Reference Giorgio, Cabie and Henry 69 ] Vendelbo et al. reported an “operando” TEM study on the oscillatory behavior of Pt nanoparticles catalyzing CO oxidation, by using a MEMS-based windowed cell, which was functionalized for simultaneous high-resolution TEM observations and quantitative mass spectrometry of exiting gas, and reaction calorimetry.[ Reference Vendelbo, Elkjær, Falsig, Puspitasari, Dona, Mele, Morana, Nelissen, van Rijn, Creemer, Kooyman and Helveg 70 ] Experimental data were collected while 760 Torr of CO/O2/He mixture gas was flowing through Pt nanoparticles at a temperature of 659 K. In the result shown in Fig. 11, Pt nanoparticles started a gradual transformation from a more spherical shape toward a more facetted shape, as the CO conversion increased rapidly. The fully facetted shape was reached within 3 s after the CO peak conversion [Fig. 11(a) III]. Then, on decrease in the CO conversion, the nanoparticle transformed back to the more spherical shape [Fig. 11(a) V] and retained that shape until the CO conversion rose steeply again. Thus, by correlating the reaction data with the variations in morphology observed on the catalytic nanoparticles, it was demonstrated that the periodic and reversible faceting of Pt is indeed the cause of the periodic oscillations in the catalytic reaction.
Correlation of oscillatory CO oxidation reaction data with the projected morphology of a Pt nanoparticle. (a) Time-resolved TEM images of the projected morphology of a Pt nanoparticle during CO oxidation. (b–d) Mass spectrometry of the CO, O2, and CO2 pressures (b), reaction power (c), and shape factor (d) for the Pt nanoparticle in (a) as a function of time. (e) Atomic-scale visualization of the dynamic refacetting of a Pt nanoparticle during the oscillatory CO oxidation. Reproduced with permission from Ref. Reference Vendelbo, Elkjær, Falsig, Puspitasari, Dona, Mele, Morana, Nelissen, van Rijn, Creemer, Kooyman and Helveg70. Nature Publishing Group, 2014.

More recently, it has been reported that an in situ gas phase TEM study was able to be coupled together with x-ray absorption spectroscopy in a portable windowed gas cell.[ Reference Li, Zakharov, Zhao, Tappero, Jung, Elsen, Baumann, Nuzzo, Stach and Frenkel 71 ] Li et al. used this “operando” approach to correlate the structure and property of a nanoscale silica-supported Pt cluster catalyst for ethylene hydrogenation. These examples demonstrate that the windowed gas cell can be coupled with “operando” multi-techniques, allowing the changes in reaction kinetics to be measured during the TEM observation at atomic resolution.
Remarks and outlook
The recent commercialization of MEMS-based windowed gas cells now enables the atomic-resolution visualization of phenomena occurring during gas–solid interactions at atmospheric pressure, as exemplified by the representative studies we reviewed in this paper. In the near future, we anticipate that effort will be directed toward (1) achieving a high temporal resolution while retaining a high spatial resolution, (2) developing low-dose imaging, and (3) adding multiple stimuli inside the gas cell.[ Reference Wu and Yao 18 , Reference Crozier and Hansen 72 – Reference Wu, Shan, Chen, Gu, Tao, Song, Shang and Deng 74 ] Advances in these directions should be beneficial to the further development of in situ TEM under atmospheric pressures.
Temporal resolution
While retaining the atomic-scale spatial resolution, high temporal resolution is essential for revealing transient reaction products and high-frequency events (e.g., nucleation, atomic diffusion, etc.) occurring during the gas–solid interaction. Currently, the widely used TEM imaging systems allow for an acquisition at a sub-angstrom spatial resolution (<0.1 nm) but a relatively low temporal resolution (>0.03 s),[ Reference Taheri, Stach, Arslan, Crozier, Kabius, LaGrange, Minor, Takeda, Tanase, Wagner and Sharma 73 , Reference Wu, Shan, Chen, Gu, Tao, Song, Shang and Deng 74 ] limited by the read-out frequency of the charge-coupled device camera,[ Reference Faruqi and McMullan 75 ] through which high-energy electrons have to be converted to photons.
The newly developed direct electron detection technique, based on complementary metal-oxide semi-conductor technology, can improve the temporal resolution without compromising spatial resolution. By using the direct electron detection cameras, frame acquisition rates can be enhanced to the range from 400 to 1600 s−1, corresponding to the temporal resolution in the millisecond range (0.625 ~2.5 ms), while the atomic resolution is still retained.[ Reference Liao, Zherebetskyy, Xin, Czarnik, Ercius, Elmlund, Pan, Wang and Zheng 76 ] In addition, four-dimensional ultrafast electron microscopy is considered as a further step to improve temporal resolution,[ Reference Hilbert, Uiterwaal, Barwick, Batelaan and Zewail 77 – Reference Plemmons, Suri and Flannigan 80 ] although the application is still at an early stage. By employing a short electron pulse with a high electron-beam current, a temporal resolution at the femtosecond (10−15 s) time scale can be realized, while sub-nanometer spatial resolution can be retained.[ Reference Flannigan and Zewail 79 , Reference Plemmons, Suri and Flannigan 80 ] The development of these fast imaging systems will surely offer the opportunity for future detailed in situ studies of high-frequency events occurring during gas–solid interactions.
Electron beam effect
Electron beam irradiation is always a non-negligible effect on TEM studies since beam damage artifacts can be introduced during prolonged exposure time. As for the in situ TEM studies under atmospheric pressures, both the electron–gas interactions (e.g., ionization of gas molecules) and the electron–materials interactions (e.g., knock-on damage) have to be taken into account before conclusions can be drawn about intrinsic gas–solid interactions.[ Reference Mansour, Kadoun, Khouchaf and Mathieu 81 , Reference Hansen and Wagner 82 ] At the current stage of in situ environmental TEM study, experiments are always required to study the influence of beam current density and total dose on the observations and ideally compare them with complementary non-electron beam-based results.[ Reference Hansen and Wagner 82 , Reference Wu, Helveg, Ullmann, Peng and Bell 83 ]
Low-dose imaging is considered as one promising methodology to minimize the electron beam effect, which should enable more efficient in situ TEM experiments. The low-dose imaging mode of the direct electron detection cameras, as mentioned above, now makes it possible to reduce image collection time with a reasonable signal-to-noise ratio.[ Reference McMullan, Faruqi, Clare and Henderson 84 ] Furthermore, a set of low-dose imaging reconstruction techniques, such as compressive sensing and in-painting, are being adopted in in situ TEM studies to reduce the overall number of readouts/pixels in the TEM/STEM images and thus lower the overall electron dose.[ Reference Stevens, Yang, Carin, Arslan and Browning 85 – Reference Browning, Stevens, Kovarik, Liyu, Mehdi, Stanfill, Reehl and Bramer 87 ] The future advances in this area are expected to significantly reduce beam effects on in situ environmental TEM studies.
Multiple stimuli
While much of the initial interest in coupling in situ TEM under atmospheric pressures with other techniques for performing “operando” studies has been focused on catalysis, this area does not represent the full potential of the windowed gas cell technique. The atmospheric gaseous environment is also relevant to the in situ TEM investigation of other materials properties under realistic gaseous conditions. For example, performing the in situ TEM mechanical testing under hydrogen atmosphere will provide a deeper insight of the hydrogen embrittlement in metals or alloys;[ Reference Xie, Wang, Sun, Li, Ma and Shan 88 ] similarly, applying an external bias on a Li electrode under an oxygen environment is useful for understanding the charging and discharging processes of Li–O2 batteries.[ Reference Luo, Liu, Song, Xu, Zhang and Wang 89 ]
Currently, the application of the external stimuli, like mechanical loading and electrical biasing, have already been realized by MEMS-based devices in special in situ TEM holders.[ Reference Dai, Zhao, He, Wang, Wan, Shan and Zhu 90 – Reference Unocic, Sacci, Brown, Veith, Dudney, More, Walden, Gardiner, Damiano and Nackashi 92 ] It may only be a matter of time before these MEMS-based devices are integrated into windowed gas cells. We are thus expecting the incorporation of atmospheric pressure exposure to be coupled with multiple stimuli, which may open new avenues for understanding various properties of materials during their performance under realistic gaseous environments.
In situ TEM under atmospheric pressures is a fast-growing and fascinating area at present. The upsurge in research activities, together with the developments in instrumentations, suggests that numerous exciting developments can be expected in the future.
Acknowledgments
The authors gratefully acknowledge the outstanding scientific work and contributions of the researchers and institutions in the field of in situ environmental TEM studies involving the gas–solid interactions. The authors also acknowledge the support from the National Science Foundation (Grant Nos. DMR-1506535 and CBET-1159240) and the University of California-Irvine Materials Research Institute (IMRI) for use of the state-of-the-art TEM facilities.