INTRODUCTION
River terraces or alluvial fans are ubiquitous and characterise the geomorphology along the Czarny Dunajec, Biały Dunajec, and Białka rivers in the northern foreland of the Tatra Mountains of the Dunajec Basin in Poland. Deeply entrenched valleys with flights of strath and cut-and-fill terraces are typical of the upper and the middle reaches of each valley. In contrast, thick series of overlapping alluvial sediments form extensive alluvial fans in lower river reaches within the Orawa–Nowy Targ Depression. The alluvial fans are dissected in their upper and middle sections, and successions of cut-and-fill or nested terraces are formed. Age constraints on river terrace and alluvial fan sediments allow identification of periods of alluviation and incision. These periods can be explored in terms of river system behaviour and long-term drainage evolution responding to internal and external forcing factors (Olszak, Reference Olszak2017).
River incision, lateral erosion, and alluvial storage are always involved in the formation of river terraces, while the formation of alluvial fans involves periods of high sediment supply and overloaded rivers and/or base-level lowering (e.g., Mather et al., Reference Mather, Stokes and Whitfield2017). Both river terraces and alluvial fans, however, respond to external forcing factors such as climate, tectonics, and glaciation, as well as internal autocyclic effects (e.g., Bridgland and Westaway, Reference Bridgland and Westaway2014) and specific local catchment characteristics such as channel gradient or bedrock resistance to degradation (Stokes et al., Reference Stokes, Mather, Belfoul, Faik, Bouzid, Geach, Cunha, Boulton and Thiel2017). Climatic changes are mediated to river systems through the key parameters of sediment input and water discharge (Blum and Törnqvist, Reference Blum and Törnqvist2000). This relationship of river activity with climate can, however, become indirect in glaciated catchments. For example, in the forelands of high-mountain massifs, large amounts of sediment can be generated during glaciated periods and then later reworked from moraine deposits (Cordier at al., Reference Cordier, Adamson, Delmas, Calvet and Harmand2017). In glaciated catchments in Europe, alluviation (aggradation) was documented during cold climatic conditions (e.g., Carton et al., Reference Carton, Bondesan, Fontana, Meneghel, Miola, Mozzi, Primon and Surian2009; Lewis et al., Reference Lewis, McDonald, Sancho, Peña and Rhodes2009; Calvet et al., Reference Calvet, Delmas, Gunnell, Braucher and Bourlès2011; García Ruiz et al., Reference García-Ruiz, Martí-Bono, Peña-Monné, Sancho, Rhodes, Valero-Garcés, Gonzáles-Sampériz and Moreno2013; Fontana et al., Reference Fontana, Mozzi and Marchetti2014; Delmas et al., Reference Delmas, Braucher, Gunnell, Guillou, Calvet and Bourlès2015), whereas the onset of deglaciation results in river erosion and incision (e.g., Preusser et al., Reference Preusser, Graf, Keller, Krayss and Schluchter2011; Stange et al., Reference Stange, van Balen, Carcaillet and Vandenberghe2013; Bickel et al., Reference Bickel, Lüthgens, Lomax and Fiebig2015). This postglacial erosion results in sediment transfer and deposition downstream.
This article focuses on defining the timing of alluvial deposition in the northern foreland of the Tatra Mountains, Poland. There are numerous alluvial sediments and associated landforms in this region, which have not yet been adequately dated. Age constraints on those sediments and landforms will help us to understand alluviation downstream of glaciated areas and also contribute to the extensive research concerning glacier-related sediments and landforms in Europe (e.g., Dehnert et al., Reference Dehnert, Preusser, Kramers, Akçar, Kubik, Reber and Schlüchter2010; Zasadni and Kłapyta, Reference Zasadni and Kłapyta2014; Bickel et al., Reference Bickel, Lüthgens, Lomax and Fiebig2015; Delmas et al., Reference Delmas, Braucher, Gunnell, Guillou, Calvet and Bourlès2015). We used optically stimulated luminescence (OSL) and radiocarbon (14C) dating to develop a geochronological framework for the timing of alluvial deposition and to examine mechanisms that force this. Particularly, we investigate the relationship between climate and alluviation in relation to the glaciation of the catchment.
STUDY AREA AND REGIONAL SETTING
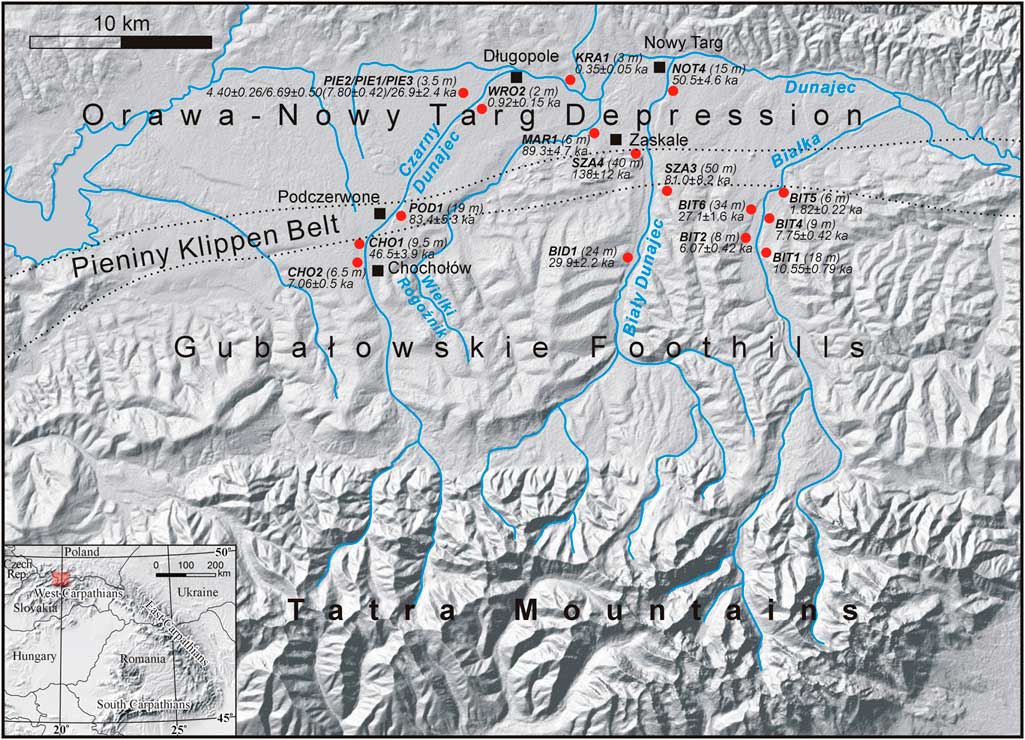
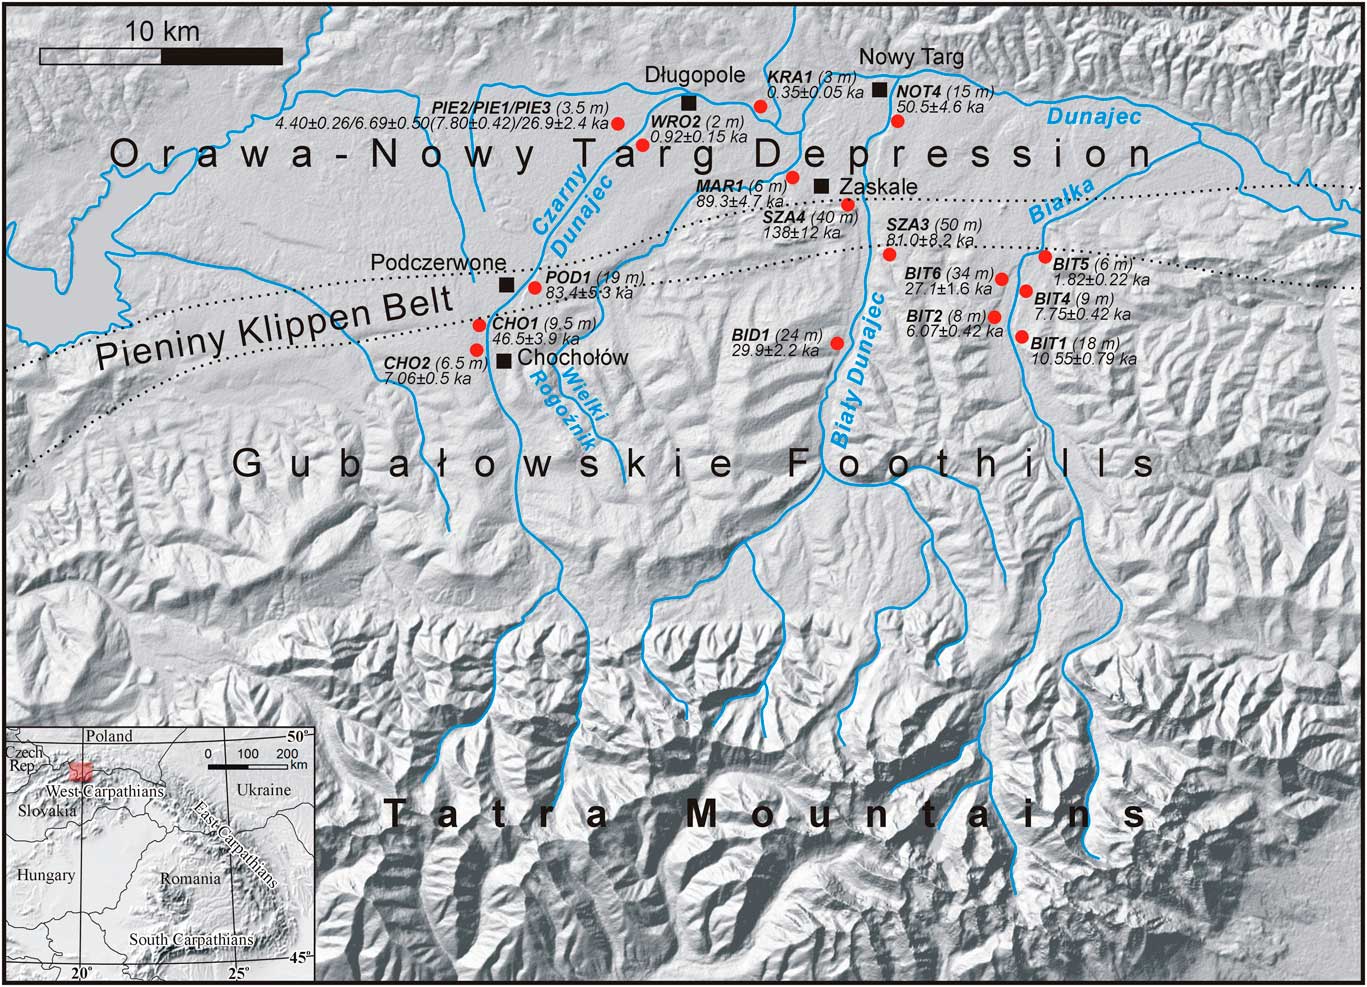
The middle and the lowest reaches of the Czarny Dunajec, Biały Dunajec, and Białka rivers (Fig. 1) are studied in this article. These sections belong to the drainage system of the northern foreland of the Tatra Mountains and are located within the Podhale region—the Gubałowskie Foothills and the Orawa–Nowy Targ Depression.
(colour online) Location of geologic sites within the study area. Field codes and ages of luminescence samples are indicated.
Brief geologic history
Podhale is an intramontane basin between the Tatra and the Beskidy Mountains in the Central and Outer Carpathians, respectively. The Czarny Dunajec, Biały Dunajec, and Białka rivers originate in the Tatras (height range 2654–925 metres above sea level [m asl]) and flow north across the Podhale basin (1160–535 m asl) where they join to form the Dunajec River. Quartzite, granite, gneiss, and amphibolite eroded and transferred by rivers from the Tatra Mountains are more resistant to weathering than sandstone and mudstone eroded and delivered within the Podhale flysch.
In addition to bedrock, a further source of sediment to these rivers is glacial deposits. The Tatra Mountains were repeatedly glaciated during the Pleistocene (Lindner et al., Reference Lindner, Dzierżek, Marciniak and Nitychoruk2003), and sediment produced by glaciers was transferred and deposited downstream in valley floors as gravel covers (Gubałowskie Foothills) or as large, gravelly alluvial fans in the lowermost part of the Podhale (Orawa–Nowy Targ Depression; Watycha, Reference Watycha1976). In the foothill part of the Podhale, the gravelly covers are patchy, while in the Orawa–Nowy Targ Depression the topography of fans and terraces is disrupted by neotectonic vertical movement (Baumgart-Kotarba, 1991–Reference Baumgart-Kotarba1992; Kukulak, Reference Kukulak1993).
Tectonic activity in the Podhale is associated with crustal mobility at the contact of the Central and Outer Carpathians (Baumgart-Kotarba, Reference Baumgart-Kotarba1996). Pre-Quaternary tectonic movements led to the formation of the Orawa–Nowy Targ Depression (Birkenmajer, Reference Birkenmajer1978; Pomianowski, Reference Pomianowski2003). This resulted from the ongoing push of the Central Carpathians to the north, while the Outer Carpathians were subject to slight rotation to the northeast (Tokarski et al., Reference Tokarski, Márton, Świerczewska, Fheed, Zasadni and Kukulak2016). The early Quaternary was dominated by vertical movements with uplift of the outer margins of the basin and further subsidence of its central part (Watycha, Reference Watycha1973; Baumgart-Kotarba, Reference Baumgart-Kotarba1983). Uplift during the late Quaternary affected the western part of the depression (Orawa) resulting presumably in local changes to the Czarny Dunajec channel course (Baumgart-Kotarba, Reference Baumgart-Kotarba1996)—that is, the river started flowing eastward instead of westward.
Quaternary alluvial sediments
Previous attempts at developing a chronostratigraphy for alluvial deposits within the Podhale have defined several accumulation phases (Watycha, Reference Watycha1976; Baumgart-Kotarba, Reference Baumgart-Kotarba1978, Reference Baumgart-Kotarba1983, 1991–Reference Baumgart-Kotarba1992; Lindner et al., Reference Lindner, Nitychoruk and Butrym1993, Reference Lindner, Dzierżek, Marciniak and Nitychoruk2003) and assigned ages to glacial events in the Tatra Mountains. However, none of these studies present robust age estimates because they have applied questionable methods—namely, morphostratigraphy (which does not provide numerical age estimates) and thermoluminescence dating (which would not now be applied to sediments because of concerns about the low likelihood of resetting the original signal, i.e., incomplete bleaching).
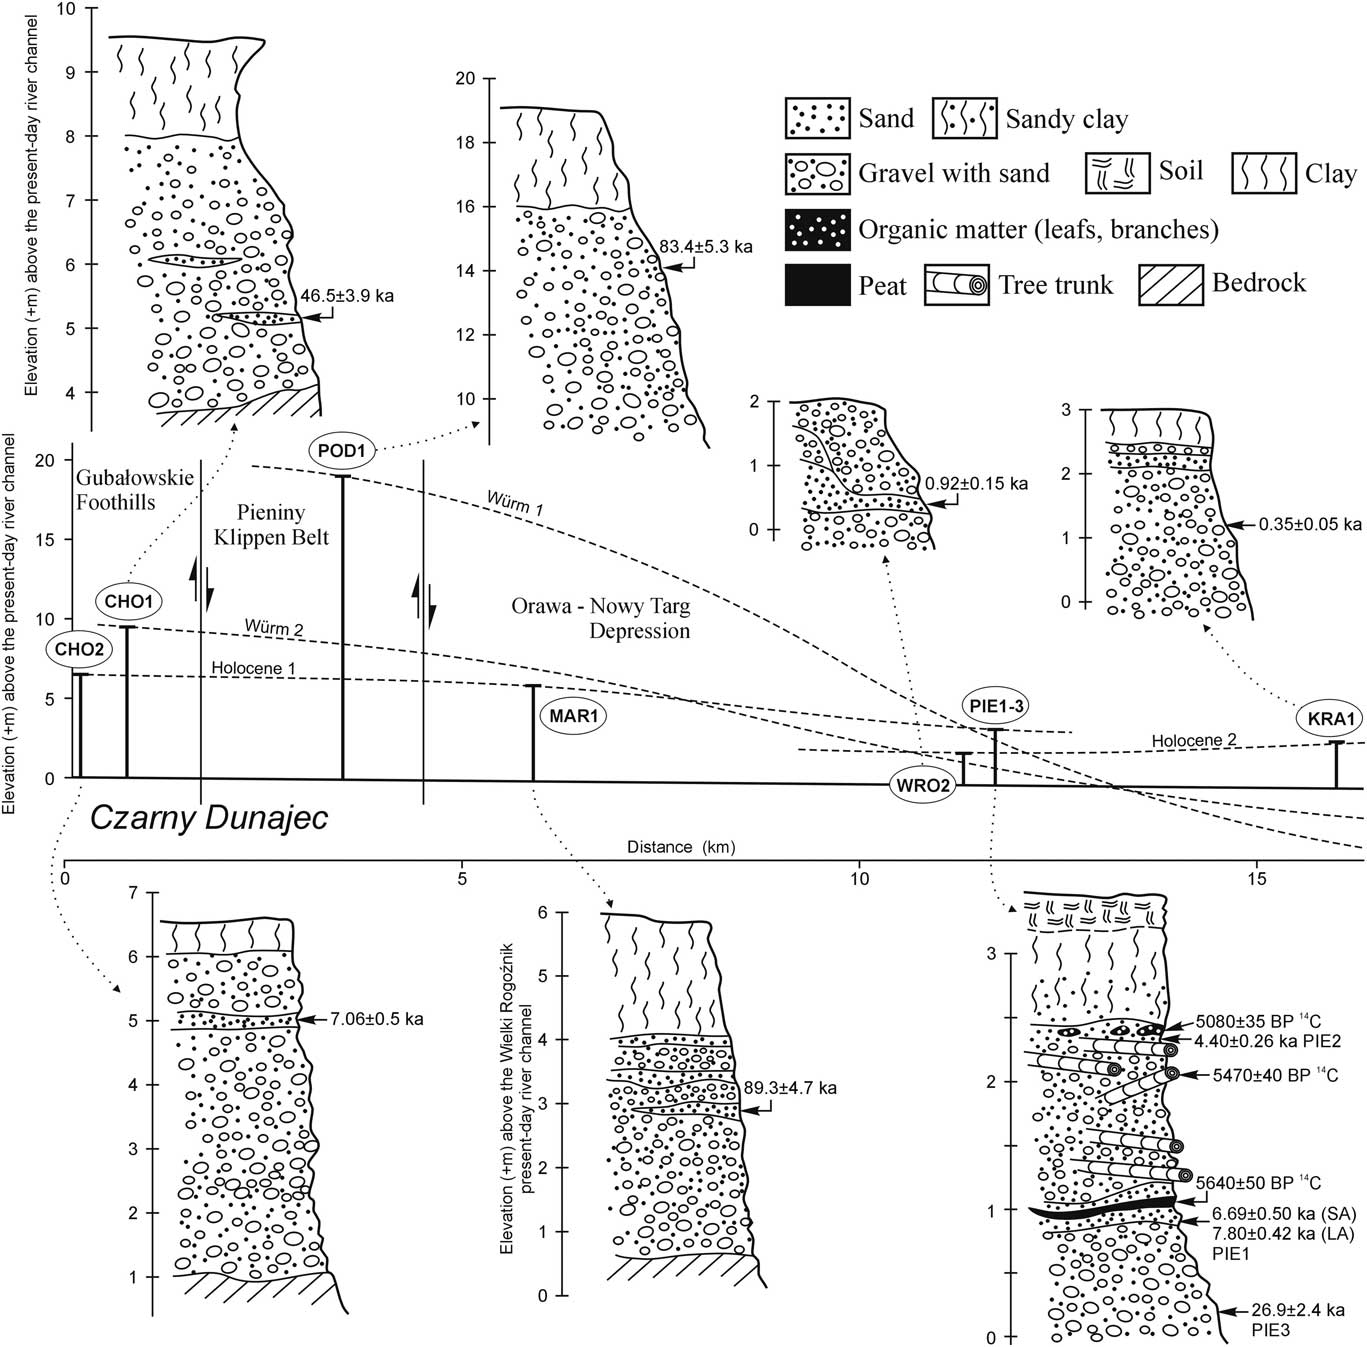
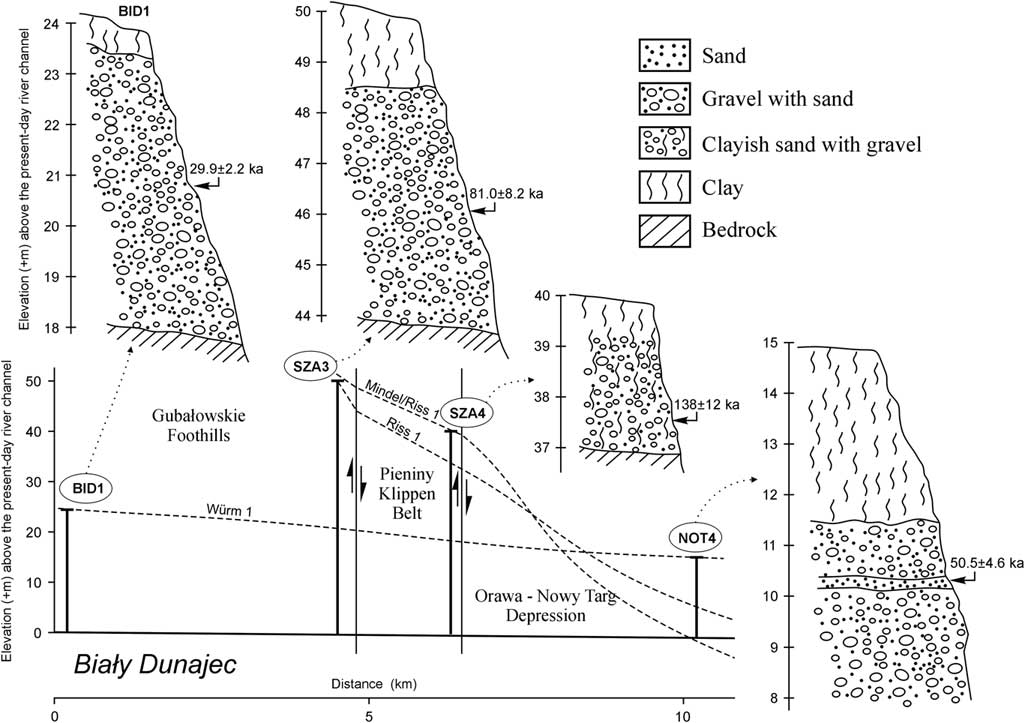
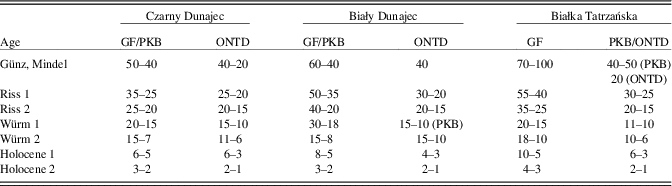
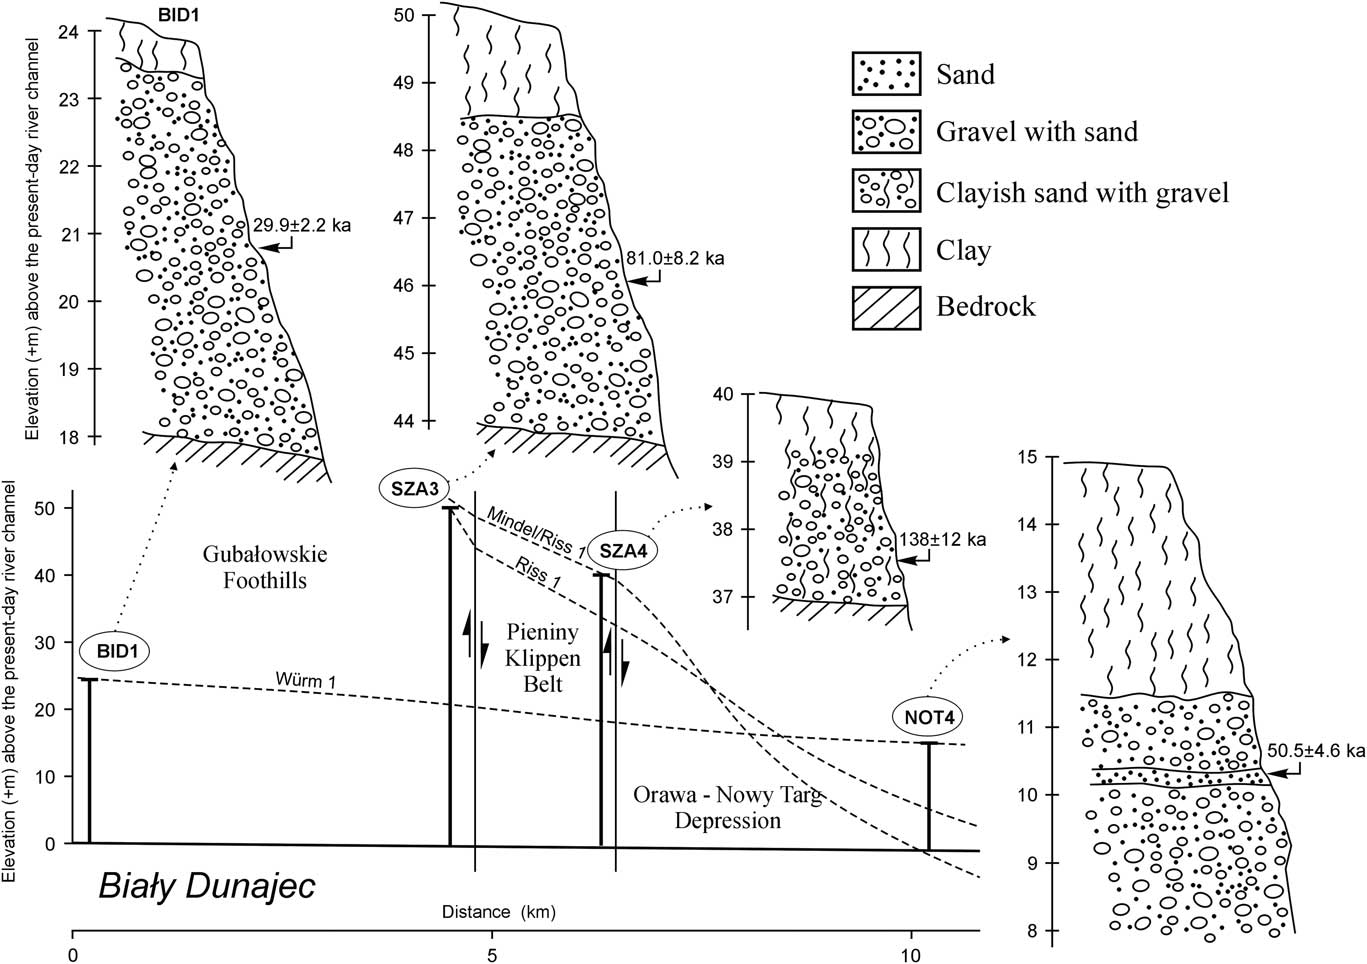
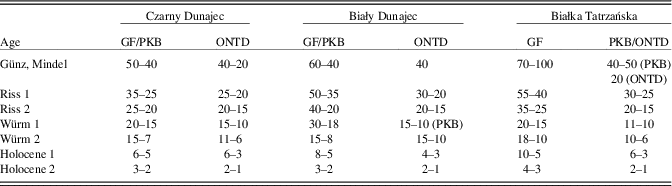
Quaternary alluvial sediments are preserved as gravelly deposits in a flight of up to eight river terraces in the Gubałowskie Foothills. In the Orawa–Nowy Targ Depression, alluvial sediments are largely stored in alluvial fans and additionally in low-elevation cut-and-fill or nested terraces. Older terraces within the Gubałowskie Foothills converge into alluvial fans within the depression (Figs. 2, 3), and their sediments become stacked (i.e., older sediments are buried under younger ones; Watycha, Reference Watycha1973). Younger terraces (Holocene) are roughly continuous along river courses. Elevation above the present-day river channel of each river terrace decreases downstream from the Tatra Mountains (Table 1), as does the number of terraces, although this trend is not symmetrical on both sides of each river. Locally, the elevation of the terraces may vary. These discontinuities are assumed to have resulted from different intensity of denudation processes and tectonic activity (Baumgart-Kotarba Reference Baumgart-Kotarba1978, Reference Baumgart-Kotarba1983; Kukulak, Reference Kukulak1993), but this has not been tested.
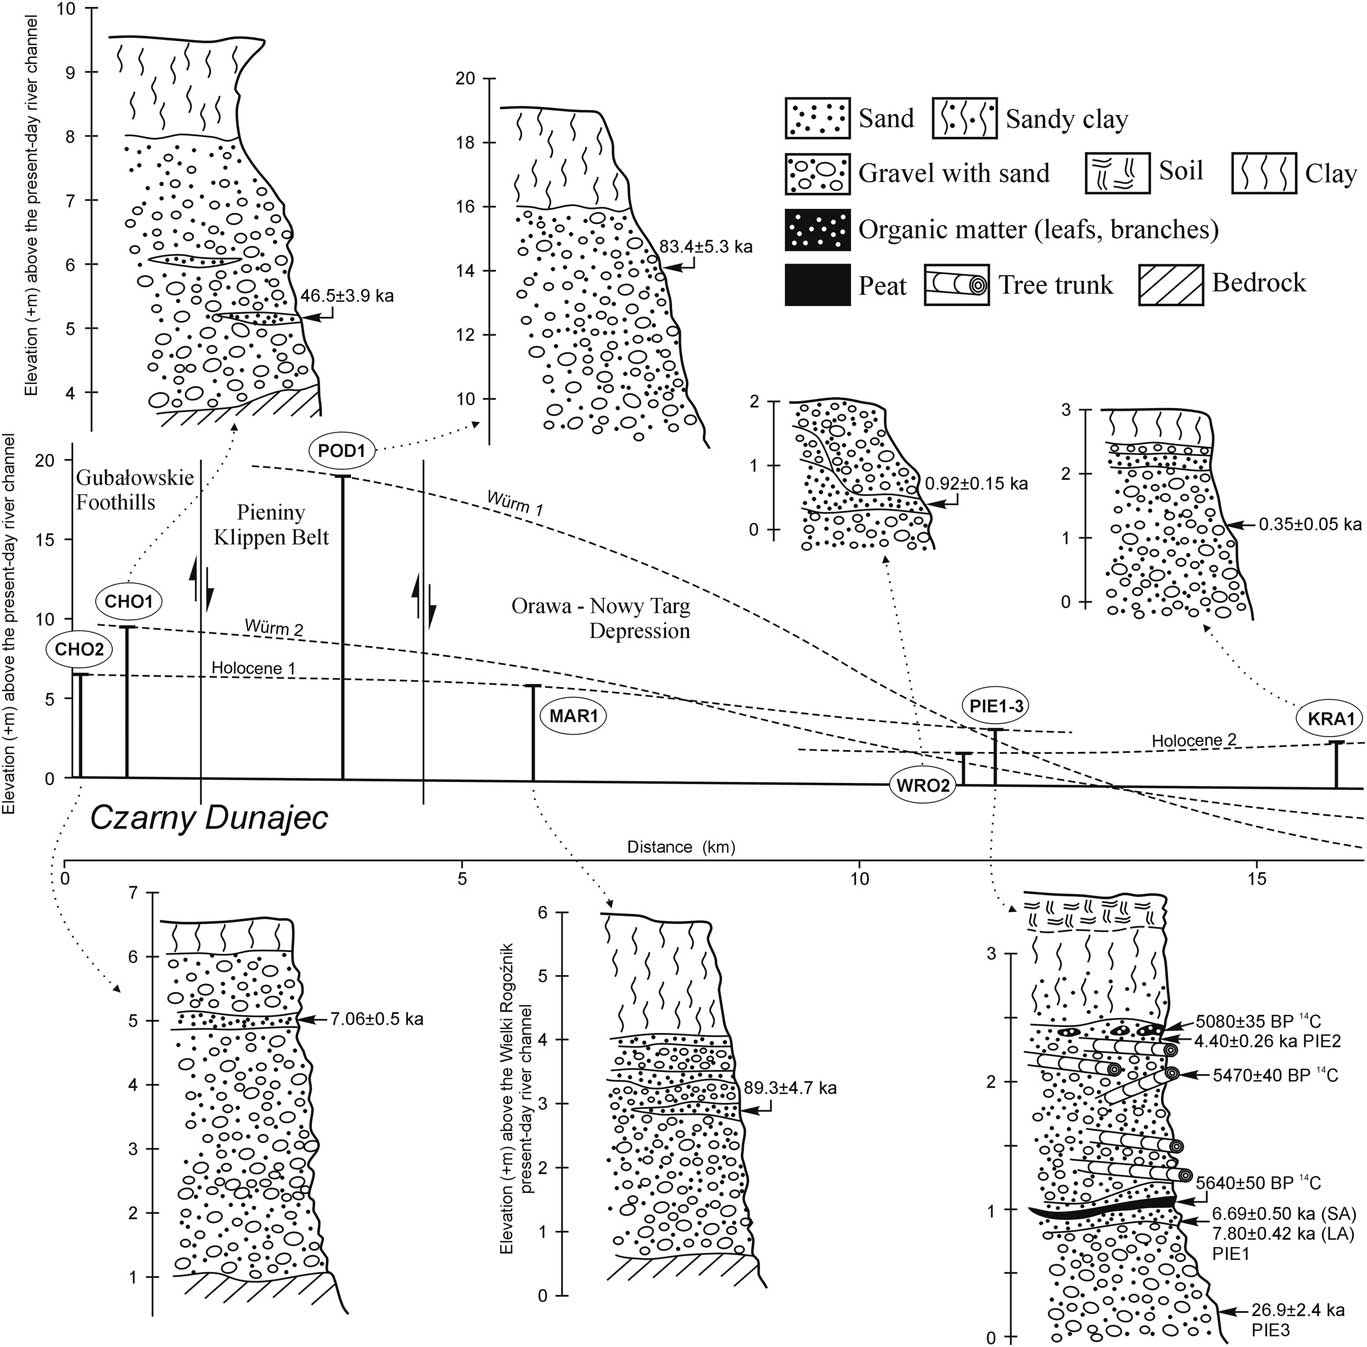
Vertically scaled geologic sections and their elevation (+ metres) above the present-day Czarny Dunajec River channel along with their morphological relationships. The dotted lines stand for river terraces according to the data presented in Table 1.
Vertically scaled geologic sections, and their elevation (+ metres) above the present-day Biały Dunajec River channel along with their morphological relationships. The dotted lines stand for river terraces according to the data presented in Table 1.
River terraces (+metres above the current riverbed) in the northern foreland of the Tatra Mountains (based on: Romer, Reference Romer1929; Halicki, Reference Halicki1930; Klimaszewski Reference Klimaszewski1967; Watycha, Reference Watycha1976; Baumgart-Kotarba, Reference Baumgart-Kotarba1978, Reference Baumgart-Kotarba1983, 1991–Reference Baumgart-Kotarba1992; Kukulak, Reference Kukulak1993; Birkenmajer et al., Reference Birkenmajer, Derkacz, Lindner and Stuchlik2008). GF, Gubałowskie Foothills; ONTD, Orawa–Nowy Targ Depression; PKB, Pieniny Klippen Belt.
Alluvial sediments within river terraces situated at elevations from 6 m up to 100 m above the present-day river channels are believed to be deposited during Pleistocene glacial stages (Romer, Reference Romer1929; Halicki, Reference Halicki1930; Klimaszewski, Reference Klimaszewski1967; Baumgart-Kotarba, Reference Baumgart-Kotarba1978, Reference Baumgart-Kotarba1983). Gravel in the uppermost river terraces was assumed to represent deposition during the oldest glacial stage in the Tatra Mountains—Günz. Consequently, gravel sections at lower elevations were correlated with younger glacial stages (Mindel, Riss, and Würm). During the early 1990s, a TL (thermoluminescence) dating campaign was executed in the Biały Dunajec River valley (Lindner et al., Reference Lindner, Nitychoruk and Butrym1993). TL ages were determined for sediments from four river terraces and interpreted in the same way (443–398 ka, Mindel; 298–242 ka, Riss 1; 185–143 ka, Riss 2; and 89–25 ka, Würm). Assigning alluviation to glacial stages in this way then necessitated assigning incision phases to interglacial stages.
MATERIAL AND METHODS
Sampling
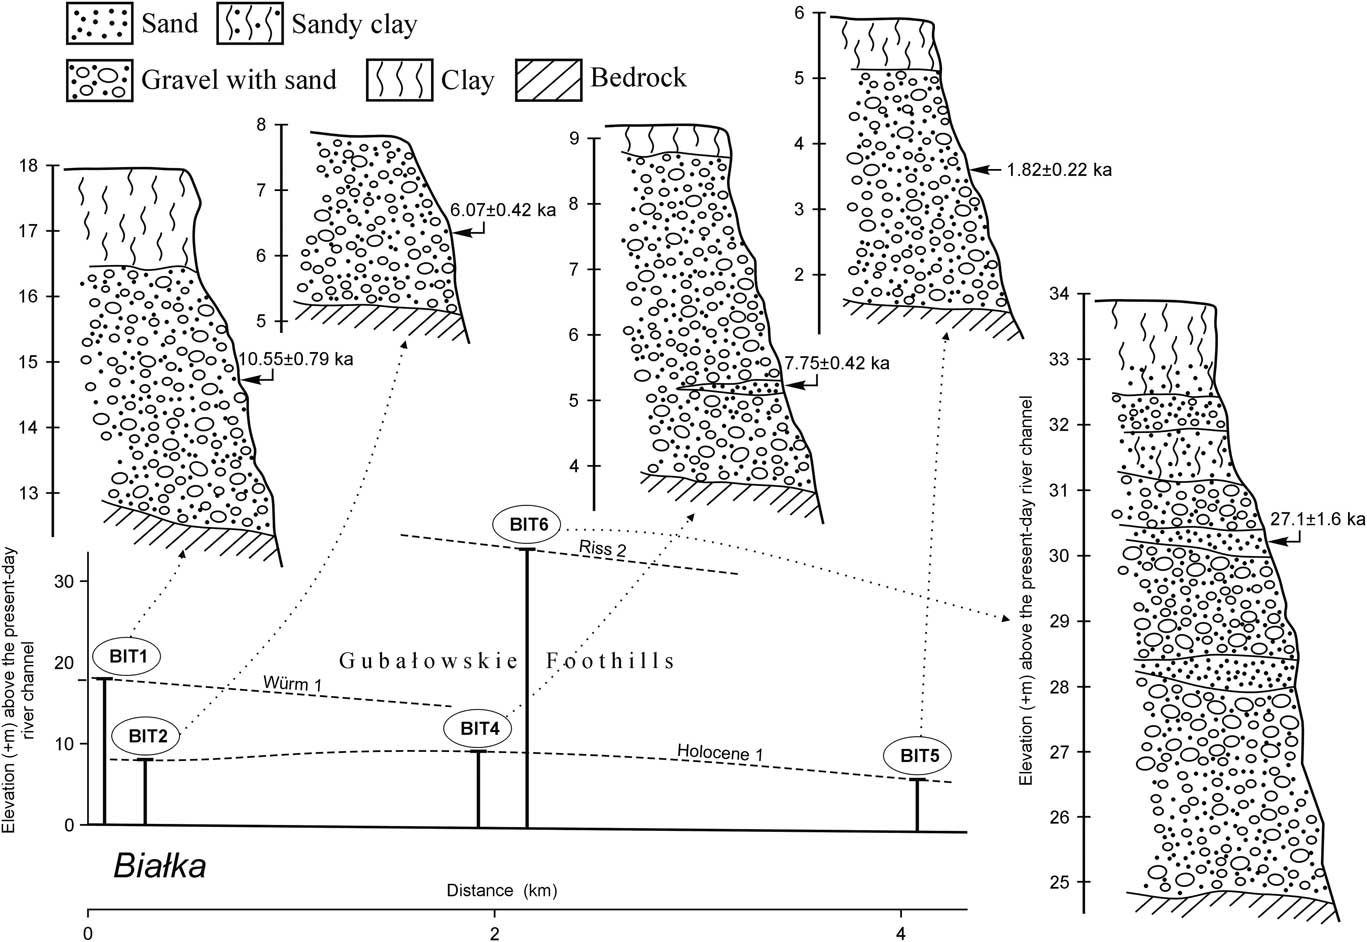
Alluvial deposits were mapped in the field including elevation above the present-day river channel (Figs. 2–4). Sections described in more detail for facies analysis and lithology and sampled for 14C and OSL dating came from natural river banks or artificial excavations. Different lithologies were described in a series of vertical logs. Interpretation of the sediments as fluvial was based on the range of facies present.
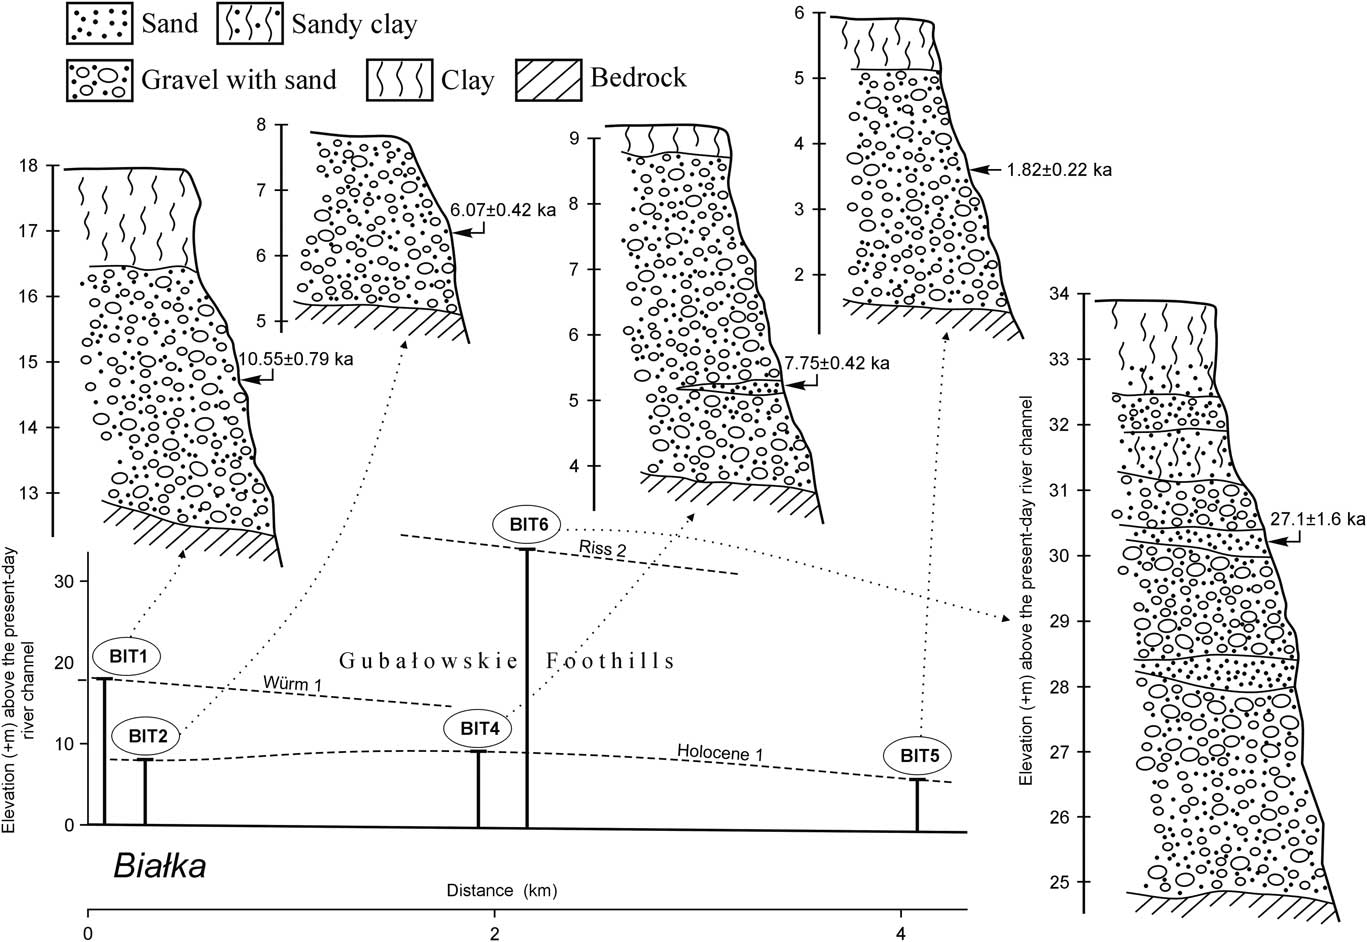
Vertically scaled geologic sections, and their elevation (+ metres) above the present-day Białka River channel along with their morphological relationships. The dotted lines stand for river terraces according to the data presented in Table 1.
OSL dating samples were taken from sandy beds if available. Otherwise, they were taken from beds that were mostly gravel with the aim of dating the interstitial sand. The latter type of sampling is not a common procedure but still can be successfully applied to coarse sediments (cf. Kenworthy et al., Reference Kenworthy, Rittenour, Pierce, Sutfin and Sharp2014). Such samples were taken roughly from the centre of each alluvial body as exposed in order to obtain the central age of a depositional phase. Most of the samples were not replicated because of the lack of sandy beds in most sections. Only at site PIE was replication undertaken (PIE1–3). Facies analysis showed two parts to the sequence at this exposure, and so samples were taken from the lower facies and two from the upper facies—one from the top and one from the bottom (Fig. 2). Sediments for OSL were sampled using watertight and light-tight plastic tubes (ф 4 cm, where ф is the diameter of the pipe), which were horizontally hammered into sediment, ~25–30 cm deep. Samples were taken for laboratory gamma spectrometry from all different lithologies within a 30 cm radius of each OSL sample to account for variable lithology in the largely heterogeneous alluvial sediments.
Radiocarbon dating sample collection was possible only from site PIE (Fig. 2), but dating was undertaken on three samples, each of which comprised 0.1–0.5 kg organic material (i.e., tree trunks, peat, leaves, and branches). Radiocarbon dating was carried out using the conventional liquid scintillation counting (LSC) dating technique at the Laboratory for Absolute Dating in Kraków, Poland (lab code MKL). Each sample was pretreated with the acid-alkali-acid method. A further procedure, after sample drying, involved the standard synthesis of benzene from carbonized samples (Skripkin and Kovalyukh, Reference Skripkin and Kovalyukh1998). Radiocarbon measurements were executed with a 3-photomultiplier spectrometer, the HIDEX 300SL (Krąpiec and Walanus, Reference Krąpiec and Walanus2011), and Quantulus 1220. Calibration of the radiocarbon ages (cal BP with probability of 68%) was undertaken using the IntCal13 data set (Reimer et al., Reference Reimer, Bard, Bayliss, Beck, Blackwell, Bronk Ramsey and Buck2013) and OxCal 4.2 software (Bronk Ramsey, Reference Bronk Ramsey2009).
Luminescence dating
OSL samples were analysed at the Lund Luminescence Laboratory, Lund University, Sweden (lab code Lund), and at the Gliwice Luminescence Laboratory Silesian University of Technology, Poland (lab code GdTL).
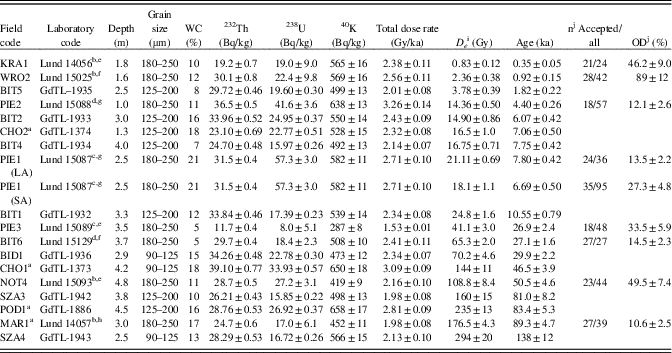
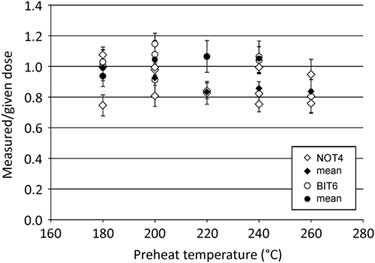
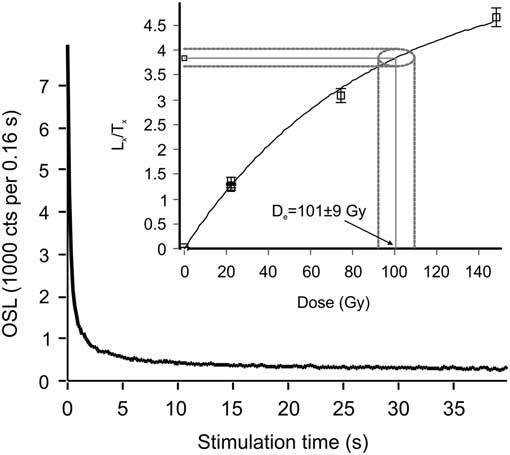
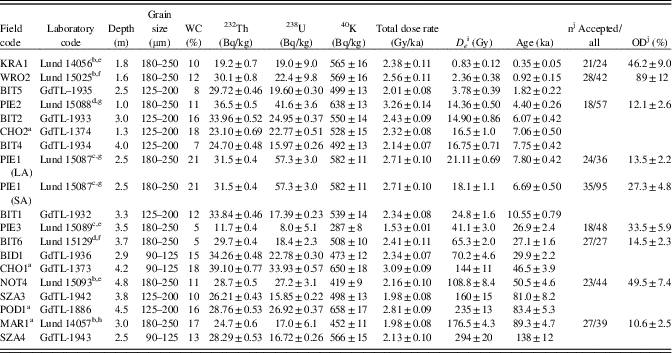
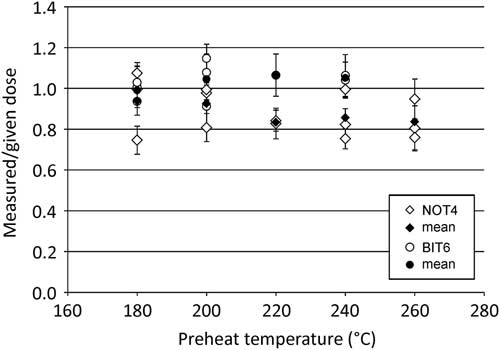
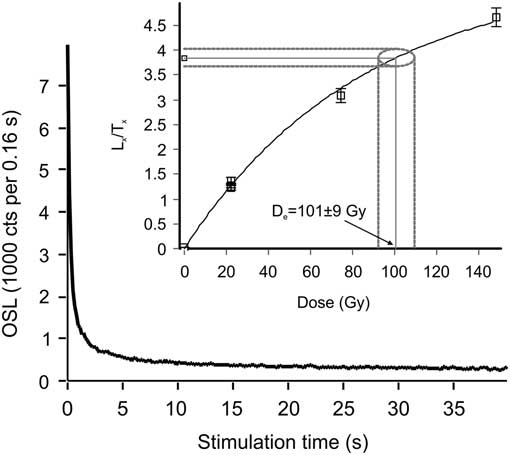
Medium to coarse quartz grains (90–125, 125–200, or 180–250 µm) were extracted by sieving and chemical treatment, including etching by HF for 60 minutes, and were analysed as large aliquots. Different grain sizes were used for measurements (Table 2), partly because of differing laboratory standards and partly because of the grain-size distribution of the samples. Measurements were done using single aliquot regenerative dose (SAR) protocols in a Risø TL/OSL reader DA-20 (Lund) and a Daybreak 2200 TL/OSL reader (Gliwice) with stimulation and temperature settings adapted to suit each sample based on feldspar contamination (IR/blue), preheat plateau, and dose recovery tests (Fig. 5; Murray and Wintle, Reference Murray and Wintle2000, Reference Murray and Wintle2003; Banerjee et al., Reference Banerjee, Murray, Bøtter-Jensen and Lang2001; Ankjærgaard et al., Reference Ankjærgaard, Jain, Thomsen and Murray2010). For details on protocol settings, see Table 2. All samples were measured as large aliquots (8 mm; ~600–800 grains); one sample (PIE1) was also measured as small aliquots (2 mm; ~50–70 grains). The luminescence signal was dominated by a fast component in all samples (Fig. 6). Aliquots were accepted if they had a recycling ratio within 10% of unity and a test dose error less than 10%. For the small aliquot measurements, 20% limits were used instead. This is because small aliquots scatter more than large aliquots, more accurately reflecting true grain-to-grain variation in the sample because there is less averaging. Some aliquots of samples PIE1–3 and NOT4 were rejected based on an IR depletion ratio (Duller, Reference Duller2003). The IR depletion ration is an indication of feldspar contamination for a quartz OSL sample. Essentially, 10% difference between the result of post–IR blue stimulation and blue-only stimulation is accepted and assumed to indicate that any feldspar contamination is insignificant. If the ratio is >10%, the presence of feldspar in the sample has affected the measurement, and the aliquots are rejected. Dose rate determination was done by laboratory gamma spectrometry including the contribution from cosmic radiation (Murray et al., Reference Murray, Marten, Johnson and Martin1987; Prescott and Hutton, Reference Prescott and Hutton1994). The alpha contribution was ignored. Water content was determined by weighing subsamples in their natural state, as well as dry and saturated. The sediments are assumed to have had water contents similar to that at the time of sampling since the time of deposition because they were probably isolated soon after deposition and unlikely to have been saturated since.
Sample information, dosimetry, and luminescence age. Depth from which samples were taken is given in metres below the outcrop top. Field water content (WC) was calculated as mass of water/mass of dry sediment×100%. For sample PIE1, LA stands for large aliquot and SA for small aliquot measurements. D e, the mean equivalent dose; OD, overdispersion.
a These samples were previously presented by Olszak et al. (Reference Olszak, Kukulak and Alexanderson2016).
b Blue stimulation with IR/blue test because of the presence of some aliquots with apparent feldspar contamination (Murray and Wintle, Reference Murray and Wintle2000, Reference Murray and Wintle2003; Duller, Reference Duller2003).
c Post–IR blue stimulation because of significant feldspar contamination (Banerjee et al., Reference Banerjee, Murray, Bøtter-Jensen and Lang2001).
d Pulsed post–IR blue stimulation because of a high level of apparent feldspar contamination (Ankjærgaard et al., Reference Ankjærgaard, Jain, Thomsen and Murray2010).
e Preheat 200°C, cut heat 160°C.
f Preheat 180°C, cut heat 160°C.
g Preheat 260°C, cut heat 220°C.
h Preheat 240°C, cut heat 200°C.
i The dose is the arithmetic mean (Lund samples).
j These data are available for Lund samples only.
Dose recovery at different preheat temperatures for samples NOT4 and BIT6. A ratio of measured to given dose close to 1 shows that the analytical protocol can successfully recover a known, given dose. The ratio is fairly stable with temperature for sample BIT6 but lowers slightly for sample NOT4. Preheats of 200°C (NOT4) and 180° (BIT6) were selected for dose estimation measurements.
Example of decay curve and (inset) growth curve for sample NOT4. The luminescence signal is dominated by a fast component, and the signal response continues to grow with increasing dose.
RESULTS
Alluvial sediments
Depending on location, the thickness of alluvial sediments ranges from a few metres within the Gubałowskie Foothills to tens of metres in the Orawa–Nowy Targ Depression (e.g., more than 100 m at WRO2; Watycha, Reference Watycha1973), all overlain by up to 3.5 m of fine clay deposits. As shown in Figures 2, 3, and 4, all the alluvial sediments are dominated by coarse massive gravel and contain thin discontinuous sand beds and organic matter only locally. All gravelly sediments comprise pebbles derived from the Tatra Mountains and the Podhale flysch. The alluvial sections sampled for OSL and radiocarbon group as follows: (1) sequences that comprise coarse gravels with interstitial sand (POD1, BID1, SZA3–4, BIT1–2, and BIT5), with significant weathering of gravels at SZA4 seen in the presence of a sandy residuum; (2) sequences that comprise coarse gravels with occasional sandy beds (CHO1–2, WRO2, KRA1, NOT4, BIT4, BIT6, and MAR1); and (3) a single, more complex sequence that also yielded organic matter (PIE1–3). The alluvial section where samples PIE1–3 were collected is bipartite (Fig. 2). The upper part of the section directly overlies the lower part with an abrupt contact. The lower part is coarser (up to 25-cm-length pebbles) than the upper part (up to 12-cm-length pebbles) and displays slight cementation. In turn, the upper part of the section is more sandy and contains organic matter. There is no obvious bedding within the gravel.
Dating results
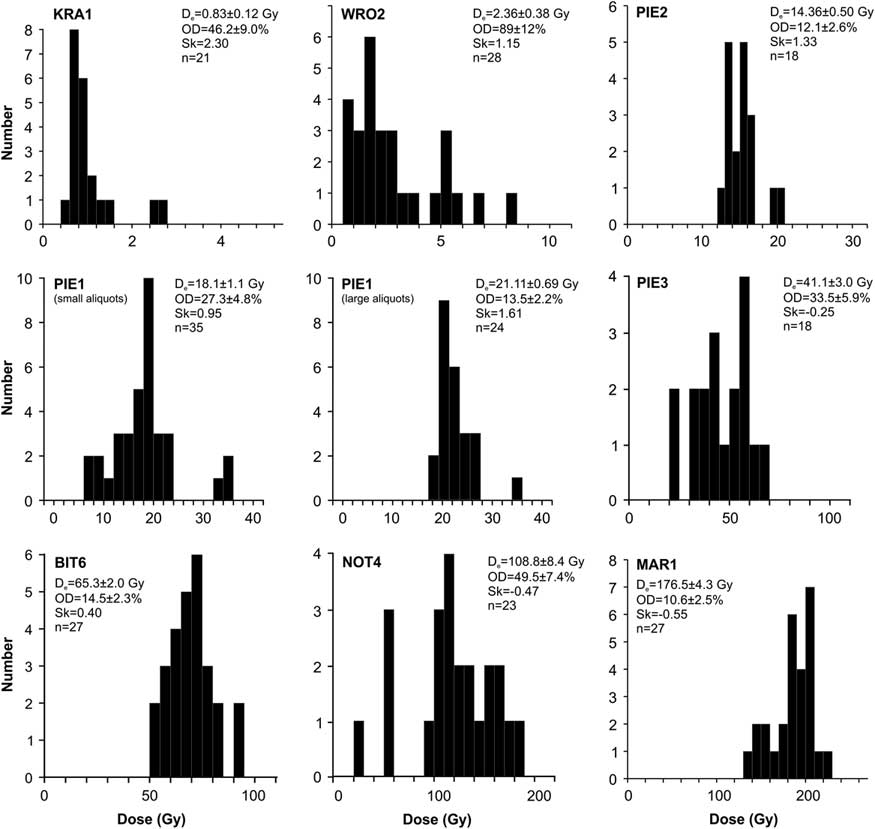
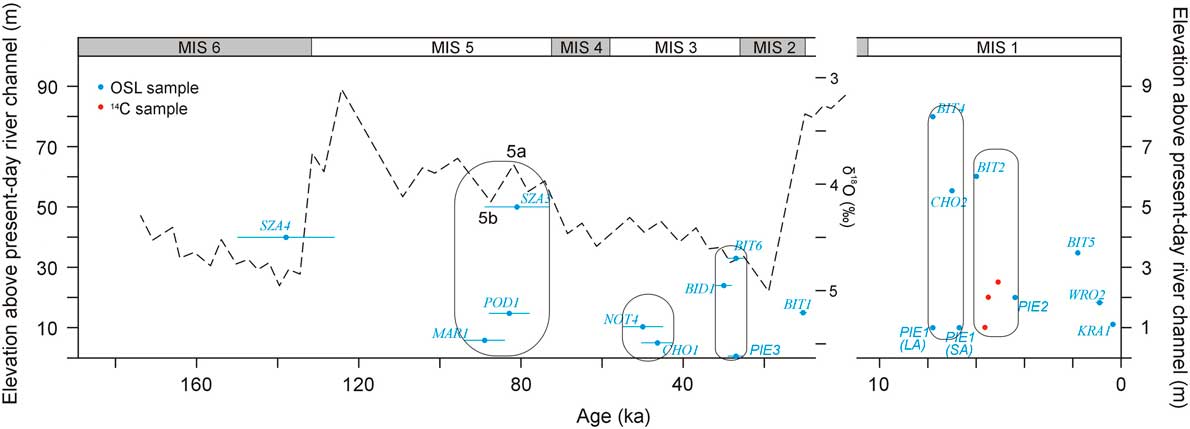
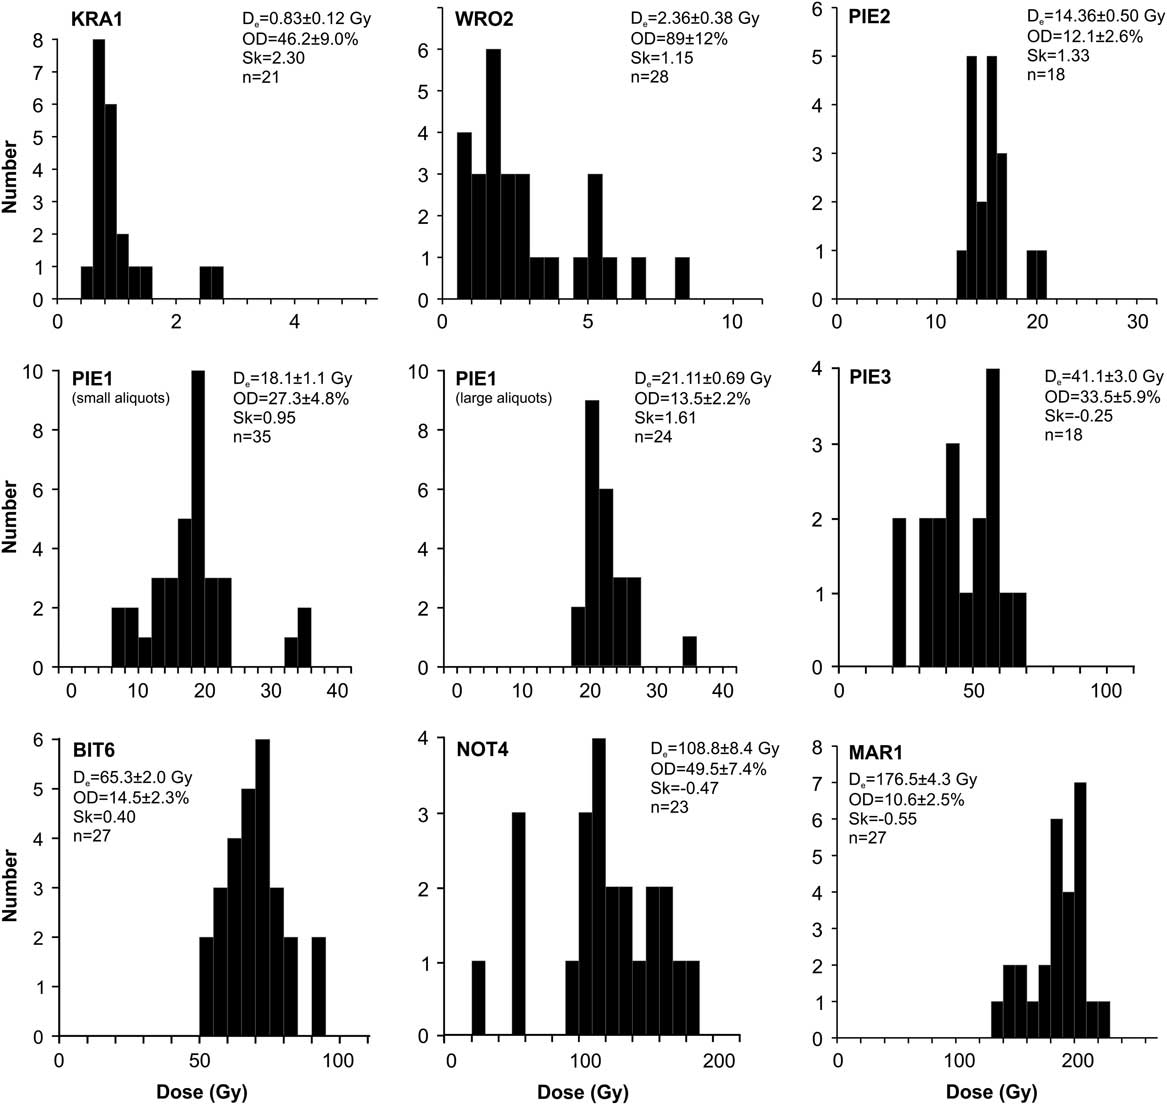
We present 18 OSL and 3 14C samples, and the resulting ages range from 138±12 to 0.35±0.05 ka. The equivalent doses for the OSL samples span between 294 and 0.8 Gy, and the environmental dose rates between 3.26 and 1.53 Gy/ka (Table 2). For all Lund samples, preheat values were chosen that showed good dose recovery in experiments (Fig. 5), although even at other preheats, dose recovery was good, showing that the SAR protocol of Murray and Wintle (Reference Murray and Wintle2000) behaved well on these samples. A further check on reliability is the investigation of dose distributions, because it has been suggested that higher scatter or positive skewness can be indicative of incomplete bleaching of the OSL signal before deposition, a source of concern in heterogeneous fluvial sediments (e.g., Arnold and Roberts, Reference Arnold and Roberts2009). However, it should be remembered that averaging within large aliquots makes the dose distributions of these less conclusive than those from single grain measurements (Duller Reference Duller2008). For four of the OSL samples (PIE1, PIE2, BIT6, and MAR1), the overdispersion (OD) of the dose distributions agrees with values from well-bleached samples (13±7%; Arnold and Roberts, Reference Arnold and Roberts2009; Table 2), suggesting that these samples are sufficiently bleached. The small-aliquot dose distribution of sample PIE1 has a larger OD (27%; Table 2) but is less skewed than its large-aliquot counterpart (Fig. 7). Some effect of incomplete bleaching thus cannot be ruled out, but appears—at least for this sample—to be relatively small. The effect is likely larger for sample WRO2, which has a significantly positively skewed and highly overdispersed (large-aliquot) dose distribution (Table 2, Fig. 7). Samples NOT4 and PIE3 do not show incomplete bleaching, but are instead negatively skewed, which may result instead from microscale differences in local dosimetry (e.g., Wallinga, Reference Wallinga2002). It should also be noted that sample MAR1 contained some aliquots that were close to or at saturation (D e > 2D 0); these were not accepted, and the age may thus be considered a minimum age. Comparison of these dating results with the Marine Oxygen Isotope Stages (MISs) in Figure 8 allows us to group samples of similar age (circled in Fig. 8), which we suggest represent episodes of alluviation. Each group contains at least two samples. Samples not included in the groups may indicate additional alluviation phases, but these are not defined without additional samples.
Histograms of dose distributions for samples measured at the Lund Luminescence Laboratory, in order of age (Table 2). D e, the mean equivalent dose; n, number of accepted aliquots; OD, overdispersion; Sk, skewness. All data are from large aliquots, except for sample PIE1, for which there are also small-aliquot data. Note that the scale on the axes varies between plots.
(colour online) Temporal and vertical distribution of optically stimulated luminescence (OSL) and 14C ages. PIE1(LA) stands for large aliquots, and PIE1(SA) for small aliquots. MIS, Marine Oxygen Isotope Stage.
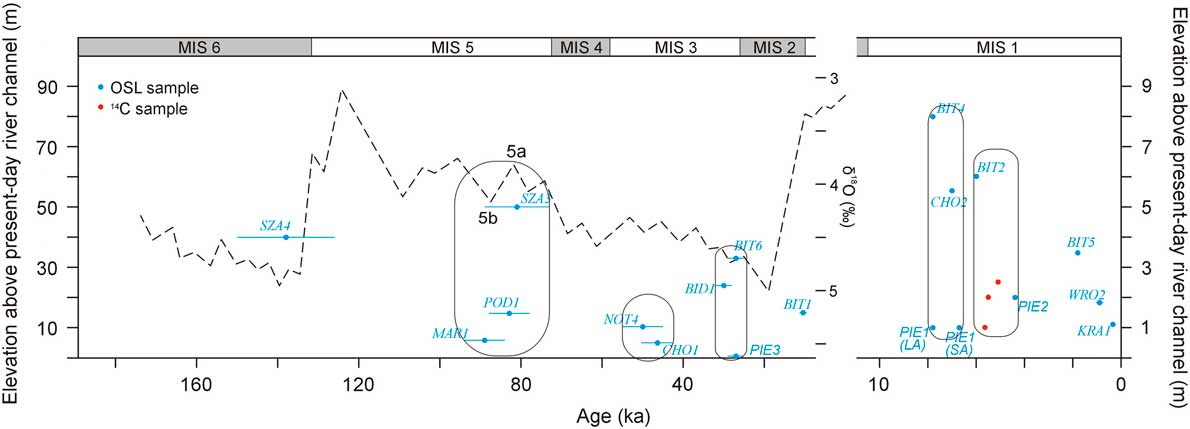
The oldest alluvial sediment predates the last interglacial stage, falling within MIS 6 (~138 ka ago, sample SZA4 from the Biały Dunajec River valley; Fig. 1). These sediments are preserved ~40 m above the present-day river channel, and their elevation is ~10 m lower than the elevation of sediments, which represent another, younger period of sedimentation. These younger sediments are preserved on the opposite bank of the river and were deposited ~81 ka ago (SZA3) during MIS 5 (MIS 5b–MIS 5a). Fluvial sedimentation at this time is also documented from the Czarny Dunajec, near the village of Podczerwone (POD1, ~83 ka), and from the Wielki Rogoźnik River valley, near the village of Zaskale (MAR1, ~89 ka). The latter sediments (MAR1) were not deposited by the Wielki Rogoźnik River, but it is not clear whether they were deposited by the Czarny Dunajec or the Biały Dunajec.
Deposition of younger alluvial sediments is centred around 50 ka (early MIS 3), based on a date of 50±5 ka for sediments of a terrace (15 m high) near Nowy Targ (NOT4) and a sample from the Czarny Dunajec River valley, dated at 46.5±3.9 ka (CHO1). A further suite of OSL ages falls into very late MIS 3, based on three OSL samples from each river valley: 27.1±1.6 ka (BIT6; Białka), 29.9±2.2 ka (BID1; Biały Dunajec), and 26.9±2.4 ka (PIE3; Czarny Dunajec). The latter date is for sediments of the Czarny Dunajec alluvial fan, which are covered by younger deposits, enriched in organic matter (Fig. 2).
A single sample collected in the Białka River valley was dated to 10.55±0.79 ka (BIT1)—the transition from the last glacial stage to the Holocene. Following this, eight OSL and three 14C samples from the Czarny Dunajec and Białka river valleys (Figs. 1, 2) fall into the Holocene, ranging in age from 7.8 (or 7.75 ka, if the age of sample PIE1[SA] is accepted) to 0.35 ka. There are not enough samples of Holocene age to effectively group all of these into alluviation phases. It is possible that deposition is continuous during interglacial stages and that the smaller error bars on ages in the Holocene would enable smaller-scale spatial and temporal variability in alluviation to be traced if enough samples were measured. For example, we do not yet have any Holocene ages from the Biały Dunajec River valley.
DISCUSSION
Alluvial phases
The results indicate six alluviation phases, which occurred during late MIS 5 (MIS 5a–MIS 5b), late MIS 3, two phases during MIS 1 (mid-Holocene; Fig. 8), and additionally, during late MIS 6 and early MIS 3. To date we have not documented any sample of alluvial sediments within the study area that could have been deposited during the last glacial maximum (i.e., ~20–17 ka ago). According to our present dating results (sample SZA4), the earliest alluviation in the northern foreland of the Tatra Mountains occurred during the latter part of the cold stage MIS 6. This coincides with MIS 6 alluvial aggradation in the middle reaches of the Dunajec River previously reported by Olszak and Adamiec (Reference Olszak and Adamiec2016). Alternatively, the error bars on this age estimate overlap the start of MIS 5e, meaning that these sediments could also be considered to be deposited in response to the climate transition (cf. Stokes et al., Reference Stokes, Mather, Belfoul, Faik, Bouzid, Geach, Cunha, Boulton and Thiel2017).
An alluviation phase around 89–81 ka (late MIS 5; Fig. 8) is based on three samples (MAR1, POD1, and SZA3). The topographic position of sediments dated at 81.0±8.2 ka (SZA3) must be considered. These sediments are elevated much higher (~50 m; Fig. 3) above the current riverbed than those (POD1, ~19 m) from the Czarny Dunajec River valley and MAR1 (~6 m; Fig. 2) from the Wielki Rogoźnik River valley. The very low elevation of sediments of sample MAR1 is explained by their location within the southern border of the Orawa–Nowy Targ Depression (Figs. 1, 2). A different explanation is needed for the low elevation of POD1 in relation to SZA3. This may have resulted from the tectonic faulting in the region (i.e., different rates of uplift). It is believed that the northeastern termination of the Vienna Basin Fault System extends farther towards the northeast, from Žilina to the Orawa-Nowy Targ Depression (Tokarski et al., Reference Tokarski, Márton, Świerczewska, Fheed, Zasadni and Kukulak2016). This tectonic system would then include the faults that occur along the Czarny Dunajec River and the Wielki Rogoźnik River, roughly from Chochołów to Długopole and from Chochołów to Zaskale, respectively (Bac-Moszaszwili, Reference Bac-Moszaszwili1993). A consideration of dip-slip movement along those faults can explain the low elevation of sample POD1. Nevertheless, the morpho-tectonic assessment requires further investigations.
During MIS 3, there are possibly two phases of alluviation. The older one, at around 50 ka conflicts with earlier TL dating. This is seen particularly clearly in the alluvial sediments near Nowy Targ (NOT4). Here, an OSL sample from the top part of the gravel series (sampled at the depth of 4.8 m; Fig. 3) gave an age of 50.5±4.6 ka (NOT4). TL dating from these sediments (Lindner et al., Reference Lindner, Nitychoruk and Butrym1993) at a depth of 6.0 m was determined at 27±4 ka, giving an age reversal if both techniques were equally reliable. This is the opposite of the effect that would be expected given the poorer bleachability of the TL signal (Huntley et al., Reference Huntley, Godfrey-Smith and Thewalt1985). It is not clear how else to explain this difference, because there is no change with height in the nature of the gravely deposits concerning lithology, internal structure, cementing, or pebble size and therefore no sedimentologic evidence of multiple phases of deposition. Although it is true that this site is located within the Orawa–Nowy Targ Depression, which has been subsiding, and the alluvial sediments, accreting vertically, are likely to comprise several episodes of deposition (cf. Birkenmajer et al., Reference Birkenmajer, Derkacz, Lindner and Stuchlik2008), the properties of the deposits are such that we are reluctant to state that the studied sediments were deposited during two separate episodes, particularly because younger sediments would be expected above, not below, older deposits. The exact relationship between these two sample locations, however, was not observed. The OSL age from Nowy Targ (NOT4) is supported by an OSL age (46.5±3.9 ka; CHO1) for deposits from the Czarny Dunajec River valley, and therefore, this suite of the ages might support alluviation phase ~50–46 ka ago. Although the TL age is largely consistent with the suggested late MIS 3 alluviation phase, which is indicated to occur ~30–27 ka ago (Fig. 8), it is still enigmatic. Further age estimates are needed from this site to clarify how many alluviation phases are represented.
The Holocene age estimates (OSL and 14C) indicate two phases of alluviation. The first phase dates from approximately 7.8 to 7 ka ago (~7.8 and 6.7 ka, if the age of sample PIE1[SA] is included), and the second phase from 6 to 4.4 ka (Fig. 8). This latter phase is based on both OSL and radiocarbon ages, which compare well (Fig. 2). These two phases are reported from both the Czarny Dunajec River and the Białka River. We argue that there is insufficient evidence to define separate phases of alluviation on the basis of the remaining OSL ages—that is, BIT1 (10.55±0.79 ka), BIT5 (1.82±0.22 ka), WRO2 (0.92±0.15 ka), and KRA1 (0.35±0.05 ka). This is because the associated uncertainties on such young ages are small, meaning that phases would be defined on the basis of a single sample only, at least one of which (WRO2) may suffer from incomplete bleaching. This lacks robustness. Defining further phases of Holocene alluviation will require further dating analyses.
Controls on alluviation
If the upstream reaches of a catchment are glaciated, the glaciers considerably influence the downstream catchment hydrology and sediment input (cf. Cordier et al., Reference Cordier, Adamson, Delmas, Calvet and Harmand2017). This is because of the vast amounts of glacier-derived meltwater and sediment that are subsequently transported and deposited downstream. Glaciers produce large quantities of sediment during glacial maxima through intense erosion. The sediment is transferred and deposited in frontal moraines and/or evacuated via meltwater streams. Following this, during warming and glacier retreat, there is an increase in discharge (meltwater) and subsequent erosion and reworking of glacially produced sediments. It is therefore possible that glaciers can significantly influence river behaviour during periods of cold climate and warming.
Despite this, we only documented two samples of sediments that can be directly attributed to glacial forcing. Deposits dated to 138±12 (SZA4) and 10.55±0.79 ka (BIT1) might have resulted from high sediment discharges because of glacier melting and sediment erosion upstream. Alternatively, the older sample may also indicate aggradation under cold-climate conditions because of commonly accepted processes (Olszak, Reference Olszak2017), rather than glacier conditions in the Tatra Mountains. This geologic site is located ~20 km downstream from the reconstructed ice-margin in the Biały Dunajec fluvial system during the MIS 6 cold period (Lindner et al., Reference Lindner, Nitychoruk and Butrym1993, Reference Lindner, Dzierżek, Marciniak and Nitychoruk2003). It is possible that the proglacial floodplain did not stretch this distance, and the sediments of sample SZA4 are not a part of the proglacial floodplain. So far, we have not found sediments deposited during the MIS 2 cold period in the studied reaches of river valleys. However, alluvial sediments of that age were found in nonglaciated areas—smaller river valleys (Wielki Rogoźnik and Mały Rogoźnik), which were not occupied by glaciers at all (Olszak et al., Reference Olszak, Kukulak and Alexanderson2016).
In contrast, we have recognised three phases (~89–81, ~50–46, and ~30–27 ka) of alluvial sediment storage that occurred during warm stages of the Pleistocene (Fig. 8). Material deposited within these phases cannot have been driven directly by glacial activity. Instead, glacially produced material stored within frontal moraines and proglacial floodplains was subsequently eroded, then transferred and deposited downstream. Therefore, alluviation occurred during warm periods in the study area, indirectly driven by mountain glaciers. This effect is magnified by morpho-tectonic conditions in this region (i.e., tectonic uplift in the Tatra Mountains and subsidence in the Orawa–Nowy Targ Depression). Significant river incision was also documented for similar circumstances in the northern Alps (Preusser et al., Reference Preusser, Graf, Keller, Krayss and Schluchter2011). Here, the onset of deglaciation facilitated erosion and subsequent incision, which led to enhanced sediment transfer downstream. These processes also drove alluviation in the Ybbs valley in northern Austria (Bickel et al., Reference Bickel, Lüthgens, Lomax and Fiebig2015), and in the southern Alps in Italy (Carton et al., Reference Carton, Bondesan, Fontana, Meneghel, Miola, Mozzi, Primon and Surian2009; Fontana et al., Reference Fontana, Mozzi and Marchetti2014). In the latter case, however, large alluvial fans were formed by glaciofluvial sedimentation during the last glacial stage, while the onset of deglaciation resulted in erosion and reworking of sediments that were deposited farther downstream. In contrast, results of extensive investigations in the Pyrenees suggest that fluvial aggradation occurred largely during Pleistocene cold stages (e.g., Lewis et al., Reference Lewis, McDonald, Sancho, Peña and Rhodes2009; Calvet et al., Reference Calvet, Delmas, Gunnell, Braucher and Bourlès2011; García-Ruiz et al., Reference García-Ruiz, Martí-Bono, Peña-Monné, Sancho, Rhodes, Valero-Garcés, Gonzáles-Sampériz and Moreno2013; Delmas et al., Reference Delmas, Braucher, Gunnell, Guillou, Calvet and Bourlès2015).
A phase of alluvial storage during late MIS 3 might have been driven by increased river incision upstream from the northern foreland of the Tatra Mountains as climate cooled into the glacial maximum in MIS 2. Such river incision during cooling transitions has been proposed for many areas (e.g., Cordier et al., Reference Cordier, Harmand, Frechen and Beiner2006; Winsemann et al., Reference Winsemann, Lang, Roskosch, Polom, Böhner, Brandes, Glotzbach and Frechen2015) including the Carpathians (Starkel, Reference Starkel2003; Olszak, Reference Olszak2017).
The two phases of Holocene alluviation may be interpreted in the same way as the older “warm” phase alluviation—that is, resulting from enhanced erosion upstream in the Tatra Mountains and the southern part of the Gubałowskie Foothills, and subsequent sedimentation downstream in the northern Gubałowskie Foothills and the Orawa–Nowy Targ Depression. The proglacial alluvial sediments most likely experienced severe erosion during the MIS 2/MIS 1 transition and the early Holocene (cf. Carton et al., Reference Carton, Bondesan, Fontana, Meneghel, Miola, Mozzi, Primon and Surian2009). Thus, remobilized alluvial sediments contributed to alluviation downstream of the former glacial margin since ~8 ka ago.
The extensive suite of OSL and radiocarbon ages presented in this article has enabled comparison of alluviation phases with climatic changes. In contrast with many models of fluvial response to climate in nonglaciated catchments, we do not see a clear dominance of alluviation during cold-climate phases, although there is evidence of some. Instead, the majority of alluviation is dated to warmer-climate phases, driven by reworking of glacially deposited sediments. Further dating of these sequences will likely enable the determination of more precise timing of alluviation phases, particularly at the border of the Gubałowskie Foothills and the Tatra Mountains.
In addition to the identification of temporal phases of alluviation, attention must be paid to the elevation of such deposits in the landscape. The vertical distribution of similar OSL ages (Fig. 8) clearly shows their different elevation above the current riverbed in different locations (Fig. 1). This is attributed to spatially varying magnitudes of river incision since alluviation, rather than different elevations during deposition. The magnitude of incision is largely controlled by rates of tectonic uplift. The elevation of samples might result also from the thickness of alluvium (i.e., vertical scale of alluviation), which may differ by several metres between valleys. If this is not the case, then faulting can be inferred from alluvial sediments of similar age being preserved at different elevations.
CONCLUSIONS
We outline a total of six alluviation phases since MIS 6 in the northern Gubałowskie Foothills and the Orawa–Nowy Targ Depression (northern foreland of the Tatra Mountains). The results show that the alluvial sediments were almost exclusively deposited during warm stages of the late Quaternary. Therefore, these alluvial sequences are not controlled directly by glaciers. This indicates that proglacial floodplains did not reach the northern part of the Gubałowskie Foothills. However, huge quantities of glacially produced sediments, deposited upstream from the study area, were subject to erosion during later warmer periods, reworked, and subsequently deposited downstream from proglacial plains and the former ice margin. This conceptual model shows a significant delay between sediment production (moraine and proglacial floodplain formation) and alluvial deposition (terrace and fan formations downstream).
This conclusion that alluvial sediment storage in the foreland of the Tatra Mountains occurred largely under temperate-climate conditions supersedes previous assessments regarding the age of the alluvial sediments, which were previously assumed to be deposited during cold stages of the Pleistocene. Although absolute dating of sequences is always to be undertaken where possible, these results and those presented by Olszak et al. (Reference Olszak, Kukulak and Alexanderson2016) introduce “warm” alluviation to be a principle in the regional fluvial chronostratigraphy.
ACKNOWLEDGMENTS
Statutory project (11.11.140.626) of the AGH University of Science and Technology (to JO) and the National Science Centre, Poland (2012/07/B/ST10/04318), provided the financial support of this research. We thank Martin Stokes, an anonymous reviewer, the editor Lewis Owen, and the guest editor Becky Briant for their valuable comments on a previous version of the manuscript.